. 2015 Dec 9:6:8885.
doi: 10.1038/ncomms9885.

Long-term neural and physiological phenotyping of a single human

Affiliations

Long-term neural and physiological phenotyping of a single human

Russell A Poldrack et al. Nat Commun. .

Abstract

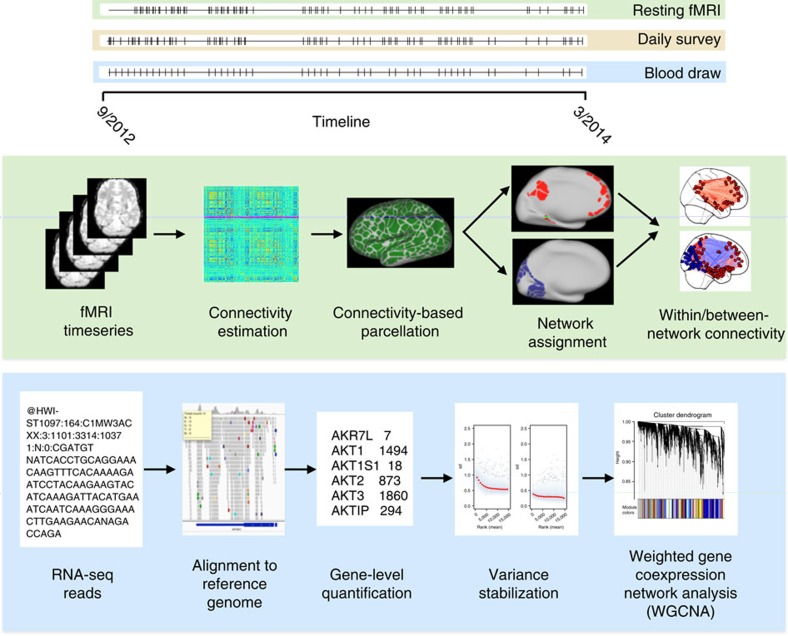
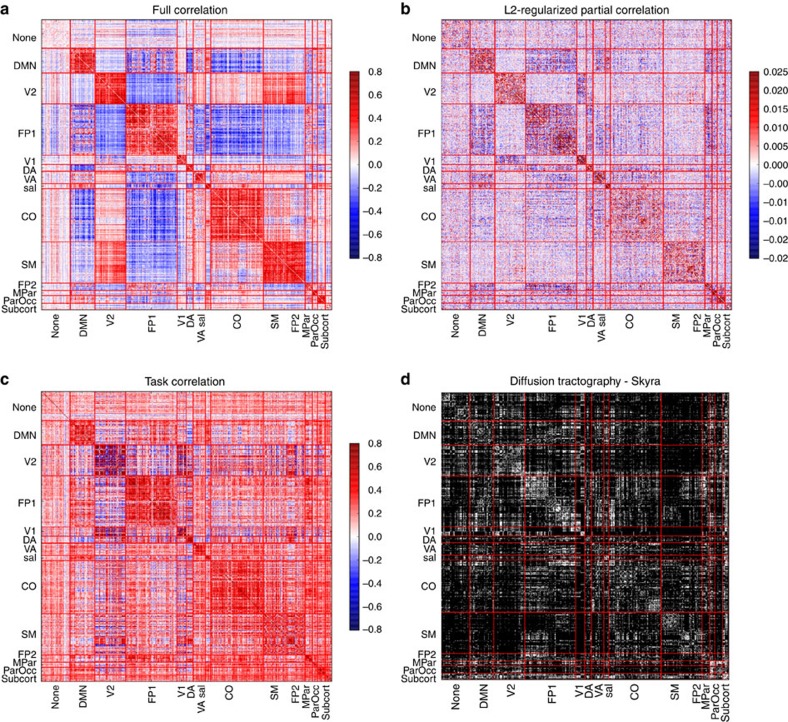
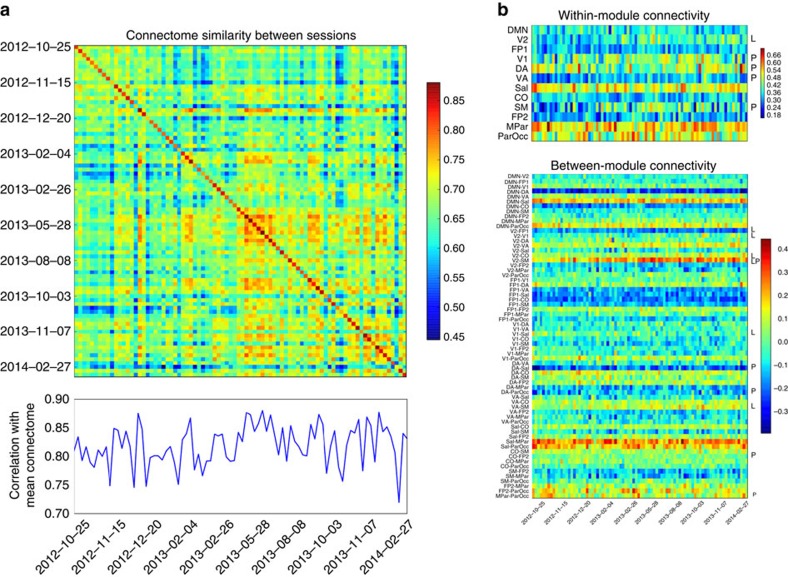
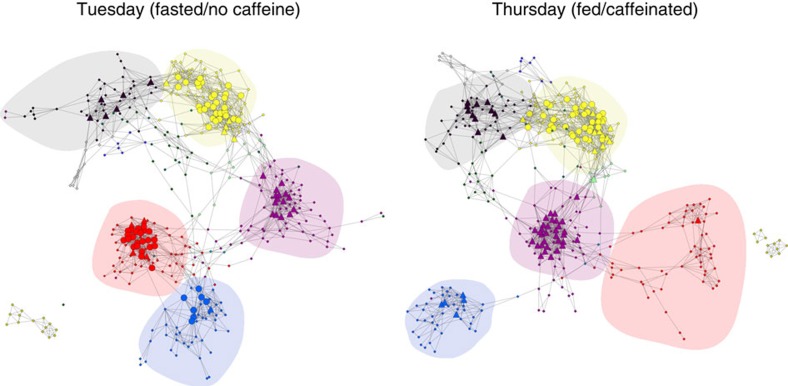
Psychiatric disorders are characterized by major fluctuations in psychological function over the course of weeks and months, but the dynamic characteristics of brain function over this timescale in healthy individuals are unknown. Here, as a proof of concept to address this question, we present the MyConnectome project. An intensive phenome-wide assessment of a single human was performed over a period of 18 months, including functional and structural brain connectivity using magnetic resonance imaging, psychological function and physical health, gene expression and metabolomics. A reproducible analysis workflow is provided, along with open access to the data and an online browser for results. We demonstrate dynamic changes in brain connectivity over the timescales of days to months, and relations between brain connectivity, gene expression and metabolites. This resource can serve as a testbed to study the joint dynamics of human brain and metabolic function over time, an approach that is critical for the development of precision medicine strategies for brain disorders.


Figures

Figure 1
Figure 1. Overview of the MyConnectome study design and analysis pipelines.
Top: a timeline of measurements obtained in the study for fMRI, behavioural measurements and blood samples. Each tick represents a single measurement. Middle: an overview of the resting-state fMRI analysis pipeline. Bottom: an overview of the RNA-sequencing pipeline.
Figure 2
Figure 2. Connectome-wide connectivity across methods.
Parcellated connectome matrices for (a) full correlation, (b) L2-regularized partial correlation, (c) meta-analytic task connectivity modelling and (d) diffusion tractography (binarized). Networks are sorted by network modules identified from the full correlation connectome. Module labels: none: unassigned, DMN:default mode network, V2: second visual network, FP1: fronto-parietal network, V1: primary visual network, DA: dorsal attention network, VA: ventral attention network, Sal: salience network, CO:cingulo-opercular network, SM:somatomotor network, FP2: secondary fronto-parietal network, MPar:medial parietal network, ParOcc: parieto-occipital network, subcort: subcortical regions.
Figure 3
Figure 3. Longitudinal variability in brain connectivity.
(a) Similarity between connectome-wide connectivity patterns across sessions, computed as the Pearson correlation between the connectivity values across the parcellated connectivity matrix. Values on the diagonal as well as the lower plot represent the similarity between each session and the mean across sessions; off-diagonal elements reflect the similarity between each pair of sessions. (b) Time series of connectivity within modules (upper panel) and between modules (lower panel). Notations to the right of each row mark the presence of significant linear (L) and polynomial (P) trends.
Figure 4
Figure 4. Effects of feeding/caffeine on large-scale network structure.
Networks were generated by binarizing the correlation matrices between parcels at a 1% density threshold, separately for Tuesdays (fasted) and Thursdays (fed/caffeinated). Network visualization was performed using yFiles organic layout in Cytoscape. Hubs are shown as larger nodes, with provincial hubs depicted as circles and connector hubs depicted as triangles. Network module membership is coded by node colour; major networks are shaded, including somatomotor (red), second visual (blue), cingulo-opercular (purple), fronto-parietal (yellow) and default mode (black).
Figure 5
Figure 5. Comparison of fMRI and diffusion connectivity measures.
(a) Functional connectomes were thresholded at varying densities, and the resulting connections were assessed to identify the proportion of those connections that had non-zero structural connectivity identified using probabilistic diffusion tractography (thresholded at 10% density). The dashed line represents the proportion expected by chance, based on randomization of the structural connections. (b) The proportion of connections surviving at each given density that were interhemispheric, at a range of densities, for each measure. (c) Functional connectomes were thresholded at 0.25% density and presented in three-dimensional stereotactic space. Red connections had non-zero tractography connections, whereas blue connections had zero tractography connections across 500,000 samples.
Figure 6
Figure 6. Diffusion tractography results.
Diffusion-weighted imaging identified an anomalous feature with the subject's corpus callosum. Glyphs (left top) reflect the underlying dominant-fibre orientation peaks, and tractography image on the right (inferior view) highlights the region with crossing fibres.
Figure 7
Figure 7. Relations between gene expression and resting-state connectivity.
Image shows a heatmap for associations between between-module connectivity in resting-state networks (rows) and gene expression in WGCNA modules (columns). The colour scale reflects the t-statistic for association between each pair of variables. Plus signs indicate those sets that are significant at q<0.1.
Figure 8
Figure 8. Phenome-wide network analysis.
A ‘phenome-wide network' was generated by treating each significant association (FDR q<0.05) as an edge in a network. The node shape denotes the variable class, node colour denotes network modules as determined using Infomap clustering and the edge colour represents a sign of association (red: positive, blue:negative).

References

    1. Kupper Z. & Hoffmann H. Course patterns of psychosocial functioning in schizophrenia patients attending a vocational rehabilitation program. Schizophr. Bull. 26, 681–698 (2000). - PubMed
    1. Chen R. et al.. Personal omics profiling reveals dynamic molecular and medical phenotypes. Cell 148, 1293–1307 (2012). - PMC - PubMed
    1. Freimer N. & Sabatti C. The human phenome project. Nat. Genet. 34, 15–21 (2003). - PubMed
    1. Bilder R. M. et al.. Phenomics: the systematic study of phenotypes on a genome-wide scale. Neuroscience 164, 30–42 (2009). - PMC - PubMed
    1. Smith S. M. et al.. Correspondence of the brain's functional architecture during activation and rest. Proc. Natl Acad. Sci. USA 106, 13040–13045 (2009). - PMC - PubMed

Publication types

Associated data