. 2016 Apr;30(4):873-82.
doi: 10.1038/leu.2015.334. Epub 2015 Dec 9.

FOXM1 is a therapeutic target for high-risk multiple myeloma

Affiliations

FOXM1 is a therapeutic target for high-risk multiple myeloma

C Gu et al. Leukemia. 2016 Apr.

Abstract

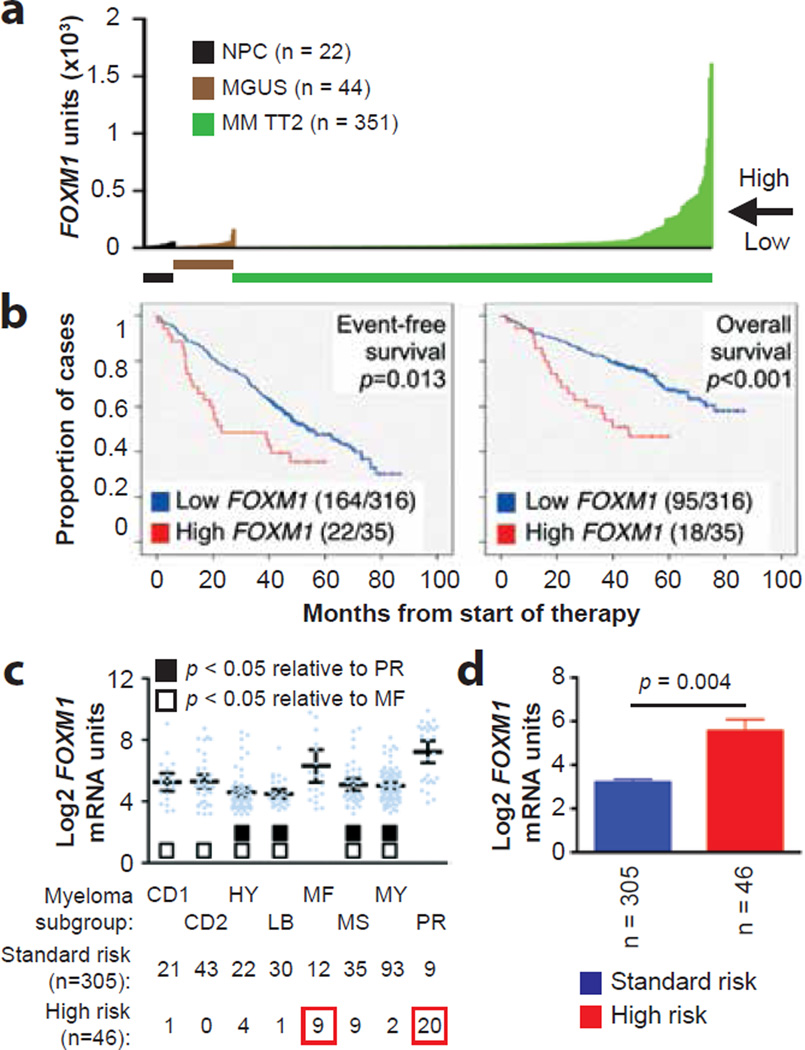
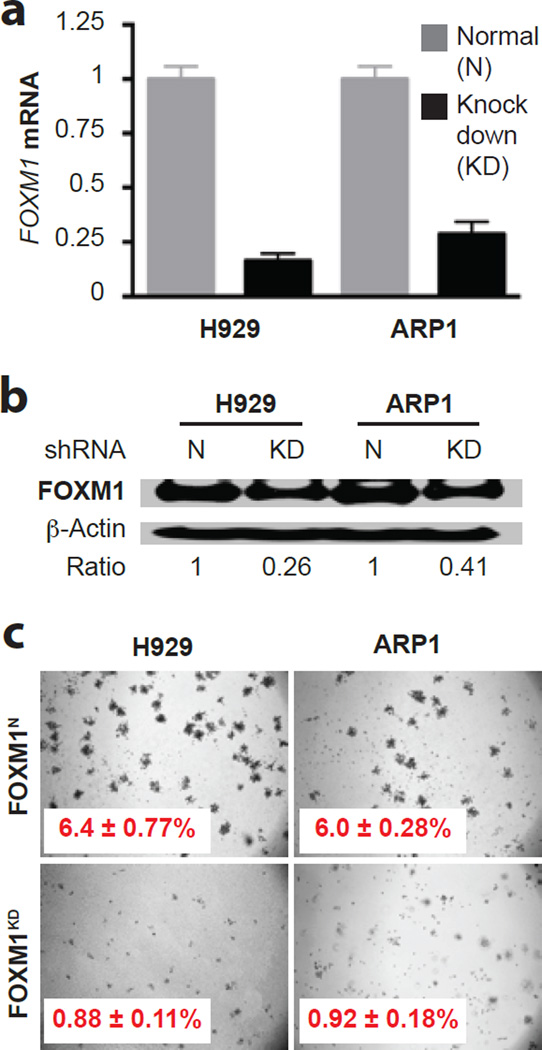
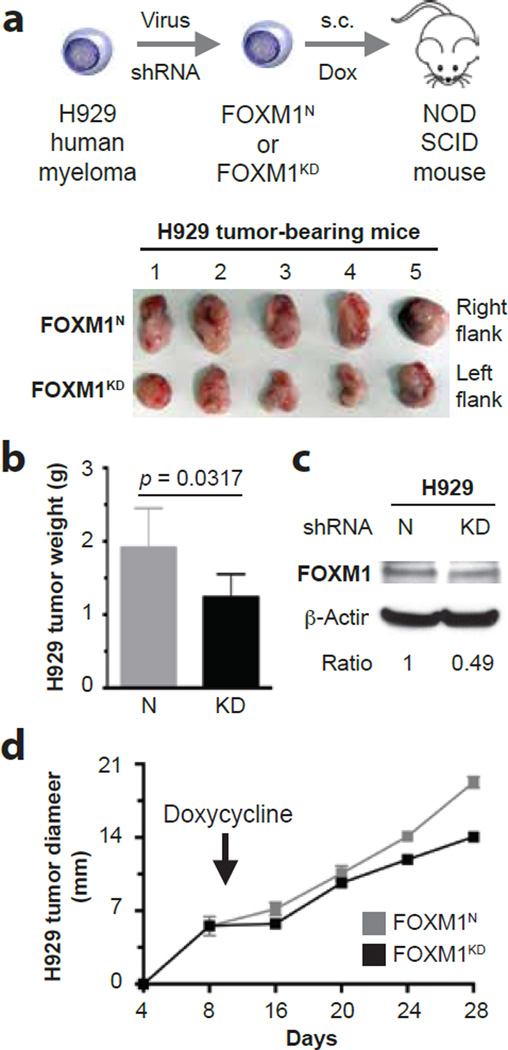
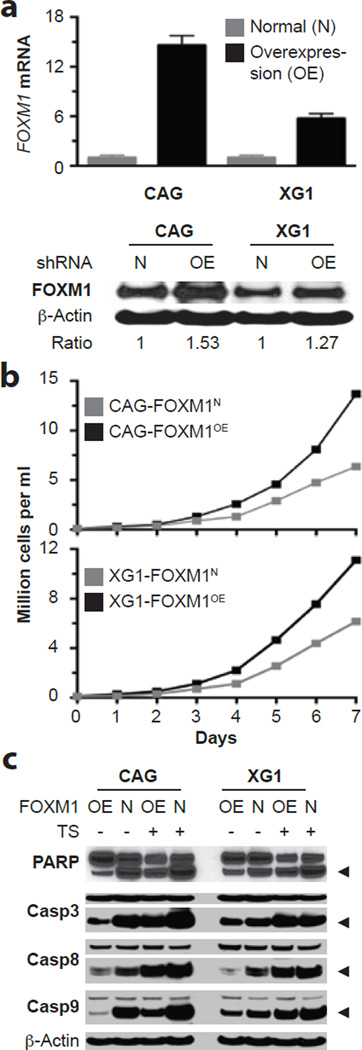
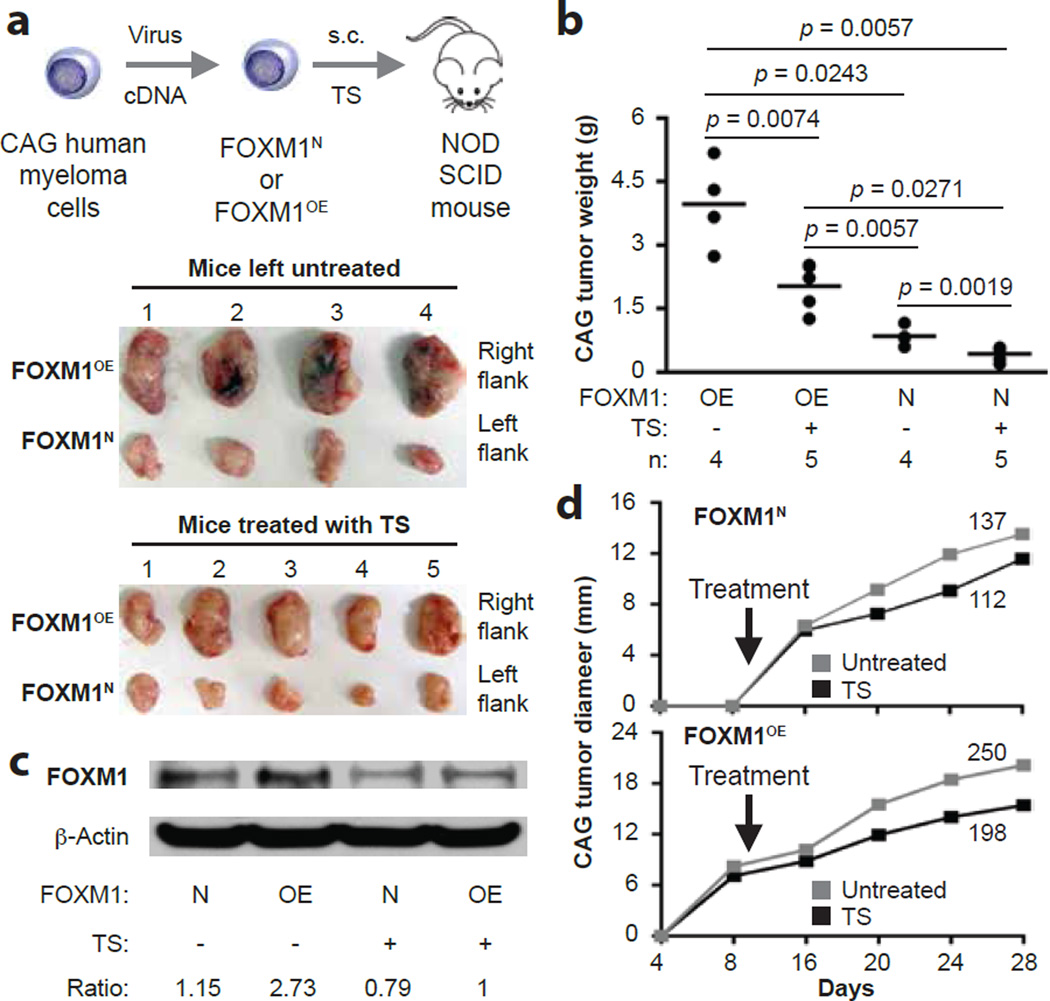
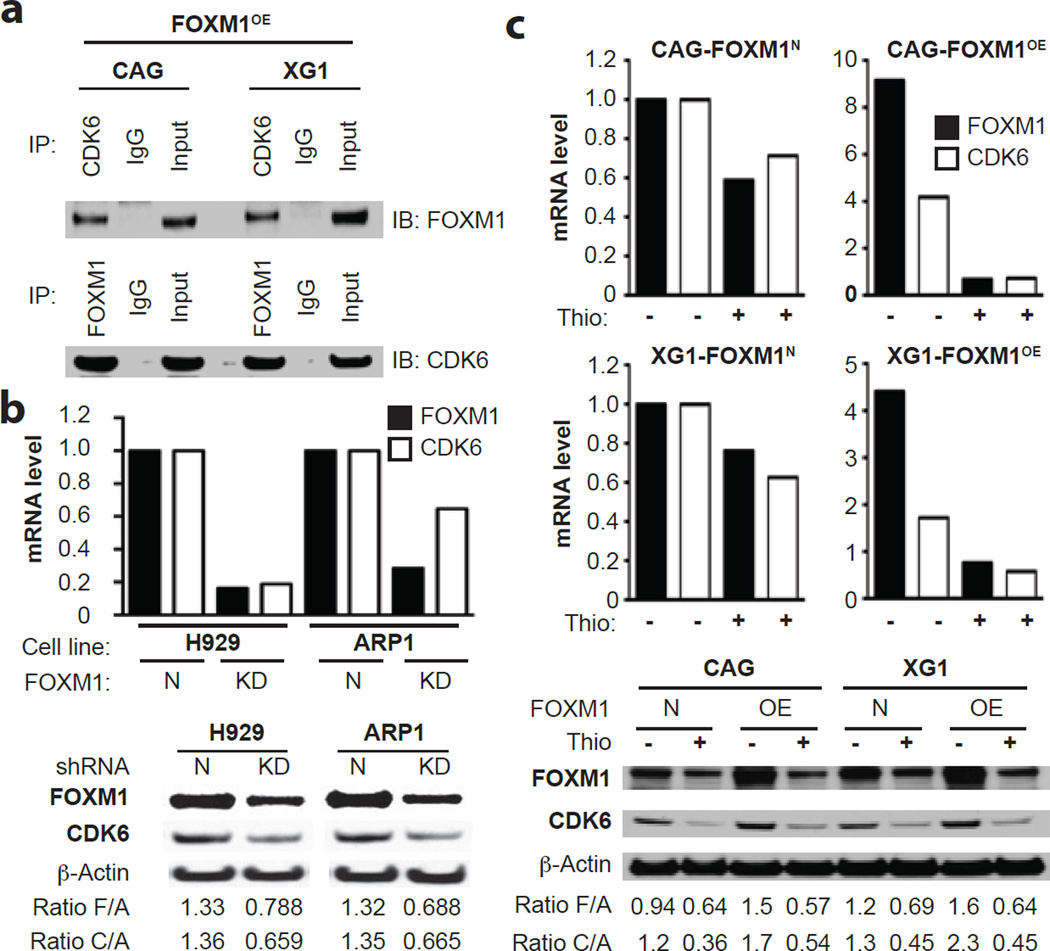
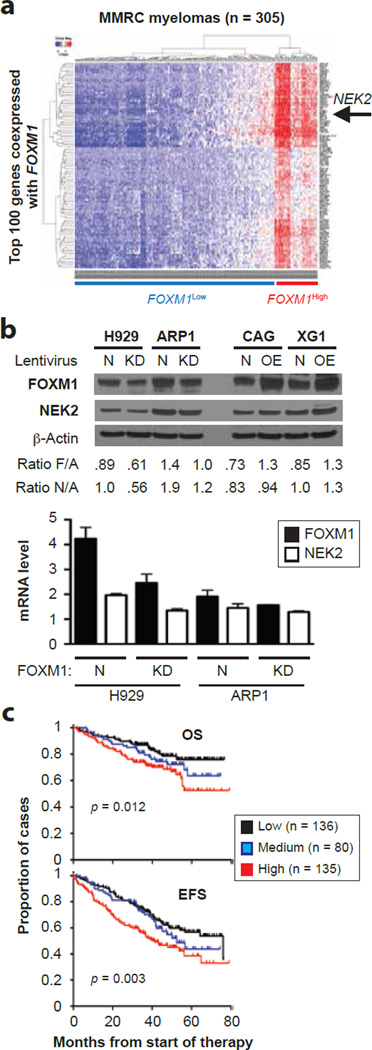
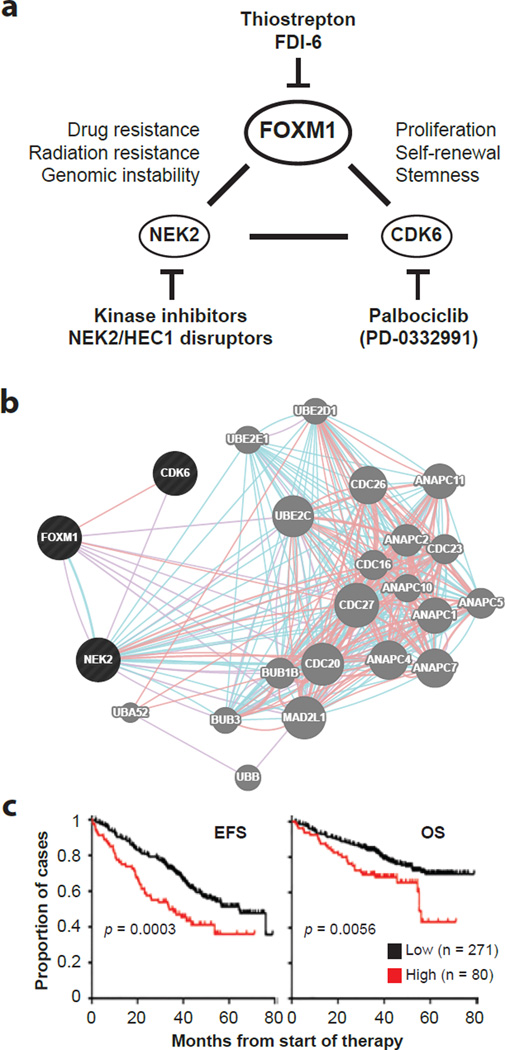
The transcription factor forkhead box M1 (FOXM1) is a validated oncoprotein in solid cancers, but its role in malignant plasma cell tumors such as multiple myeloma (MM) is unknown. We analyzed publicly available MM data sets and found that overexpression of FOXM1 prognosticates inferior outcome in a subset (~15%) of newly diagnosed cases, particularly patients with high-risk disease based on global gene expression changes. Follow-up studies using human myeloma cell lines (HMCLs) as the principal experimental model system demonstrated that enforced expression of FOXM1 increased growth, survival and clonogenicity of myeloma cells, whereas knockdown of FOXM1 abolished these features. In agreement with that, constitutive upregulation of FOXM1 promoted HMCL xenografts in laboratory mice, whereas inducible knockdown of FOXM1 led to growth inhibition. Expression of cyclin-dependent kinase 6 (CDK6) and NIMA-related kinase 2 (NEK2) was coregulated with FOXM1 in both HMCLs and myeloma patient samples, suggesting interaction of these three genes in a genetic network that may lend itself to targeting with small-drug inhibitors for new approaches to myeloma therapy and prevention. These results establish FOXM1 as high-risk myeloma gene and provide support for the design and testing of FOXM1-targeted therapies specifically for the FOXM1(High) subset of myeloma.


Conflict of interest statement

Conflict-of-interest

The authors declare no competing financial interests.

Figures

Figure 1
Figure 1. FOXM1 mRNA levels predict poor survival in a subset of patients with newly diagnosed myeloma
(a) Line graph depicting the range of FOXM1 mRNA levels (gene probe ID 202580) in normal bone marrow (BM) plasma cells (NPC), “premalignant” BM plasma cells from individuals with monoclonal gammopathy of undetermined significance (MGUS) or malignant plasma cells from patients with newly diagnosed multiple myeloma (MM) from the University of Arkansas Total Therapy 2 (TT2) cohort. Specimens exhibiting less and more than 200 units of FOXM1 message were categorized as FOXM1Low and FOXM1High, respectively. This is indicated by the horizontal, labeled arrow pointing left. (b) Reduced event-free survival (EFS) and overall survival (OS) in newly diagnosed TT2 patients harboring high FOXM1 levels. Of 351 myeloma cases, 316 (90%) had low FOXM1 levels (blue curve) and 35 (10%) had high FOXM1 levels (red curve). EFS and OS data were available from 186 (53%) and 113 (32%) patients, respectively. (c) Mean values of FOXM1 levels in 8 molecular subgroups of MM: CD1, CCND1/CCND3 group 1; CD2, CCND1/CCND3 group 2; HY, hyperdiploid; LB, low bone disease; MF, MAF/MAFB; MS, MMSET; MY, myeloid; PR, proliferation. FOXM1 is significantly elevated in MF myelomas as compared to 6 subgroups with low FOXM1 levels (open squares), and in the PR myelomas as compared to 4 such subgroups (closed squares), as assessed using the Bonferoni t test. The number of patients within each molecular subgroup who exhibit the standard-risk or high-risk UAMS-70-gene signature is indicated at the bottom. In total, 46 of 351 patients fell into the high-risk category with at least one case in each of the molecular subgroups except CD2. (d) FOXM1 expression in high-risk MM, as defined by the UAMS-70-gene signature (n = 46), is elevated compared to that in low-risk MM (n = 305; Mann-Whitney test).
Figure 2
Figure 2. Genetic knockdown of FOXM1 mitigates clonogenicity of myeloma in vitro
(a) FOXM1 message levels in H929 and ARP1 myeloma cells, using qRT-PCR as measurement tool. Cells either under-expressed FOXM1 due to lentiviral transduction of a FOXM1–targeted shRNA “knockdown” construct (KD) or expressed FOXM1 at normal levels (N) following transduction of a non-targeted or “scrambled” shRNA used as control. Average loss of FOXM1 mRNA upon gene KD was ~80% and ~70% in H929 and ARP1 cells, respectively. (b) Western analysis of samples included in panel a. Whole cell lysates were electrophoretically fractionated and immunoblotted using antibodies to FOXM1 and β-actin. Densitometry was employed to determine the FOXM1-to-β-actin ratio. Loss of FOXM1 protein in H929 and ARP1 KD cells amounted to 74% and 59%, respectively. (c) Photographic images of representative soft-agar plates indicating the decreased clonogenic growth of FOXM1KD cells (bottom) compared to FOXM1N cells (top).
Figure 3
Figure 3. Inducible downregulation of FOXM1 inhibits myeloma xenografts in NSG mice
(a) Shown at top is a scheme of the study design. FOXM1KD and FOXM1N H929 cells, generated using lentiviral shRNA transduction, were xenografted subcutaneously (s.c.) into the left and right flank of NSG hosts, respectively. Ten days later, mice received doxycycline in the drinking water to induce FOXM1-targeted shRNA in case of KD cells and scrambled shRNA in case of N cells. On day 28, xenografts were harvested and photographic images were taken (bottom). (b) Mean weight of FOXM1KD and FOXM1N xenografts on day 28 post myeloma cell transfer. (c) Western blot comparing FOXM1 protein levels in day-28 FOXM1KD and FOXM1N xenografts. (d) Time course of tumor growth in NSG mice. Doxycycline treatment of mice began 10 days after myeloma cell transfer, as indicated by a vertical, labeled arrow pointing down. Tumor diameters were measured using a caliper, beginning on day 8 after xenografting. Mice were euthanized on day 28. Mean tumor diameters (squares) and standard deviations of the mean (short vertical lines with error bars) are plotted. Regression analysis of growth rates demonstrated that the FOXM1KD tumors (y = 0.665x + 0.0295; r2 = 0.948; p < 10−3) lagged behind their FOXM1N counterparts (y = 0.896x + 0.0280; r2 = 0.973; p < 10−3) by ~25%. The area under the curve of the FOXM1KD tumors (160) was ~15% smaller than that of the FOXM1N (188) tumors.
Figure 4
Figure 4. Enforced expression of FOXM1 promotes growth and survival of myeloma cells in vitro
(a) FOXM1 message levels measured by qRT-PCR (top) and FOXM1 protein levels determined by Western blotting (bottom) in CAG and XG1 myeloma cells that were either overexpressing FOXM1 constitutively due to lentiviral transduction of a FOXM1 cDNA gene (OE) or containing normal amounts of FOXM1 (N) due to transduction of an “empty” virus. The average increase in FOXM1 mRNA in OE cells was ~14-fold and ~6-fold in CAG and XG1 cells, respectively. The corresponding increase in FOXM1 protein was more modest, as indicated by the FOXM1-to-actin ratio below the Western blot. (b) Line graphs depicting the growth of FOXM1OE and FOXM1N CAG (top) or XG1 (bottom) cells during one week in cell culture. OE cells grew faster than N cells, using two-way ANOVA for statistical comparison (p < 0.05). (c) Western blots of whole-cell lysates of FOXM1OE and FOXM1N CAG (left) and XG1 (right) cells, using as detection tools specific antibodies to poly (ADP-ribose) polymerase (PARP) or three members of the apoptosis-related cysteine peptidase family of caspase proteins. Myeloma cells were either treated (indicated by “+” sign) using the FOXM1 inhibitor thiostrepton (TS) or left untreated (indicated by “-“ sign).
Figure 5
Figure 5. Treatment of NSG mice with thiostrepton inhibits FOXM1OE xenografts more effectively than FOXM1N xenografts
(a) Scheme of experimental approach (top) and photographic images of myeloma xenografts harvested upon study termination on day 28 (bottom). FOXM1OE and FOXM1N CAG cells were generated using in vitro lentiviral gene transduction, followed by xenografting s.c. into the right and left flank of NSG hosts, respectively. One half of the study group was treated with TS (30 mg/kg IP twice weekly) beginning on day 10 post cell transfer, while the other half was left untreated. (b) Mean tumor weights (indicated by horizontal lines) in the 4 experimental groups at end of study on day 28 post cell transfer. Tumor weights in TS-treated mice were smaller than in untreated mice (p values of Mann-Whitney tests are indicated) in case of both FOXM1OE and FOXM1N xenografts. The magnitude of TS-dependent tumor reduction was ~8 times higher in OE samples (4.2 g – 2.6 g = 1.6 g) compared to N samples (0.8 g – 0.6 g = 0.2 g). (c) Representative Western blot of FOXM1 protein levels in FOXM1OE and FOXM1N xenografts collected from TS-treated (“+”) or untreated (“-“) hosts on day 28 post cell transfer. The ratios of FOXM1 to β-actin are indicated below the blot. (d) Time course of tumor growth in NSG mice treated with TS or left untreated. Mean values (squares) are plotted. Areas under the curve, a metric of tumor growth that ranged from 112 to 250 in 4 experimental groups, are also indicated.
Figure 6
Figure 6. Physical interaction and co-expression of FOXM1 and CDK6 in myeloma cells
(a) Co-immunoprecipitation (Co-IP) result indicating physical interaction of FOXM1 and CDK6 in FOXM1-overexpressing (OE) CAG cells (left) and XG1 cells (right). Immunoblots using specific antibodies (Ab’s) to FOXM1 (after IP using Ab to CDK6) or CDK6 (after IP using Ab to FOXM1) are shown on top of each other. IgG isotype controls (labeled “IgG”) and samples of whole cell lysates not subjected to Co-IP (labeled “Input”) were included as controls. (b) FOXM1 message (black bars) and CDK6 message (white bars) determined by qRT-PCR (top) and corresponding protein levels determined by immunoblotting (bottom) in FOXM1KD and FOXM1N H929 (left) and XG1 (right) myeloma cells. The ratios of target proteins to the house keeping protein, β-actin, are indicated below the Western blots. F/A and C/A denote the ratios including FOXM1 and CDK6, respectively. (c) FOXM1 and CDK6 mRNA (top) and protein (bottom) levels in FOXM1OE and FOXM1N CAG or XG1 myeloma cells treated with TS (+) or left untreated (-). F/A and C/A ratios are as in panel b.
Figure 7
Figure 7. Coordinated expression of FOXM1 and NEK2 in myeloma cells
(a) Co-expression of FOXM1 and NEK2 in the MMRC dataset (305 patients) publicly available at the Broad Institute’s Myeloma Genome Portal. The heat map contains the top 100 genes co-expressed with FOXM1. Each row and column represents one specific gene and patient, respectively. The position of NEK2, which is among the top 10 co-regulated genes, is indicated by a labeled arrow that points left. (b) Shown at top is an immunoblot analysis of the FOXM1 and NEK2 protein levels in paired FOXM1KD/FOXM1N samples of H929 and ARP1 myeloma cells (left) or paired FOXM1OE/FOXM1N samples of CAG and XG1 myeloma cells (right). The ratios of target to house keeping protein (β-actin) are indicated below the Western blots: F/A for FOXM1 and N/A for NEK2. Presented at bottom is the result of a qRT-PCR analysis of FOXM1 and NEK2 expression in FOXM1KD and FOXM1N H929 (left) and ARP1 (right) cells, demonstrating that genetic down regulation of FOXM1 leads to a corresponding drop in NEK2 message. (c) Expression levels of FOXM1 and NEK2 are associated with survival in TT2 myeloma patients. Cases were stratified as high or low expressers when both FOXM1 and NEK2 message were above (indicated in red) or below (black) the medium level in the TT2 dataset. All remaining cases (i.e., FOXM1High/NEK2Low or FOXM1Low/NEK2High) were designated as medium expressers (blue). Event-free survival (EFS) and overall survival (OS) in all 3 groups was plotted and statistically compared using log-rank analysis.
Figure 8
Figure 8. FOXM1 may interact with CDK6 and NEK2 to shorten survival of patients with high-risk myeloma
(a) Working model on the interaction of FOXM1, CDK6 and NEK2 in myeloma. Although FOXM1 is most firmly established as a proliferation-associated gene, new findings indicating that FOXM1 governs self-renewal and tumorigenicity of cancer stem cell-like cells in glioblastoma, and that the FOXM1 target, CDK6, serves as a key regulator of leukemia stem cell activation, raise the possibility that the interaction of FOXM1 and CDK6 in myeloma is also important for stemness. Additionally, FOXM1 may collaborate with NEK2 to drive resistance of myeloma cells to cancer therapy, given that NEK2 has been implicated in acquired drug resistance of many cancers and specifically shown to activate certain ABC drug transporters in myeloma. Specific inhibitors of all 3 genes have been developed. Palbocicblib has already demonstrated activity in clinical trials on myeloma. (b) Genetic interaction network of FOXM1, CDK6 and NEK2 (indicated in black to the left) generated with the help of the GeneMANIA online tool. Blue and pink lines denote pathways and physical interactions, respectively. Network genes are indicated by grey circles to the right that are labeled. The network’s apparent enrichment for ubiquination genes (not shown) points to the proteasome, suggesting in turn that the FOXM1-CDK6-NEK2 network core is involved in the response of myeloma cells to proteasome inhibition, a widely used treatment for myeloma. (c) Kaplan-Meier plots of event-free survival (EFS, left) and overall survival (OS, right) of patients with myeloma from the TT2 cohort stratified according to high levels (red) or low levels (black) of FOXM1, CDK6 and NEK2 message upon microarray analysis. Myelomas containing higher than median amounts of mRNA of all three genes were designated as high (n = 80), whereas myelomas that did not meet this criterion were designated as low (n = 271). The differences in survival were significant using log-rank analysis (p < 0.05).

References

    1. Zhan F, Huang Y, Colla S, Stewart JP, Hanamura I, Gupta S, et al. The molecular classification of multiple myeloma. Blood. 2006 Sep 15;108(6):2020–2028. - PMC - PubMed
    1. Shaughnessy JD, Jr, Zhan F, Burington BE, Huang Y, Colla S, Hanamura I, et al. A validated gene expression model of high-risk multiple myeloma is defined by deregulated expression of genes mapping to chromosome 1. Blood. 2007 Mar 15;109(6):2276–2284. - PubMed
    1. Kuiper R, Broyl A, de Knegt Y, van Vliet MH, van Beers EH, van der Holt B, et al. A gene expression signature for high-risk multiple myeloma. Leukemia. 2012 Nov;26(11):2406–2413. - PubMed
    1. Wu P, Walker BA, Broyl A, Kaiser M, Johnson DC, Kuiper R, et al. A gene expression based predictor for high risk myeloma treated with intensive therapy and autologous stem cell rescue. Leukemia & lymphoma. 2015 Mar;56(3):594–601. - PMC - PubMed
    1. Rajkumar SV. Multiple myeloma: 2012 update on diagnosis, risk-stratification, and management. Am J Hematol. 2012 Jan;87(1):78–88. - PMC - PubMed

Publication types

MeSH terms