

Bacterial Colonies in Solid Media and Foods: A Review on Their Growth and Interactions with the Micro-Environment
- PMID: 26648910
- PMCID: PMC4664638
- DOI: 10.3389/fmicb.2015.01284
Bacterial Colonies in Solid Media and Foods: A Review on Their Growth and Interactions with the Micro-Environment
Abstract
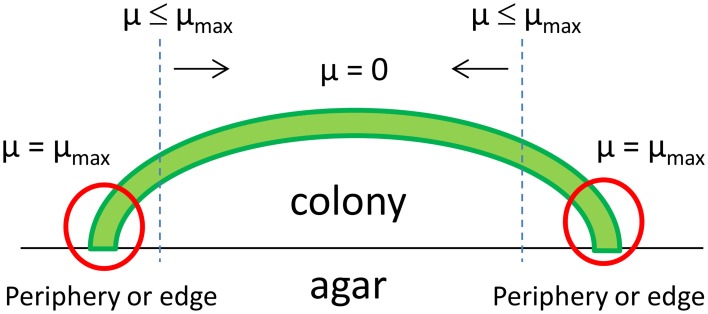
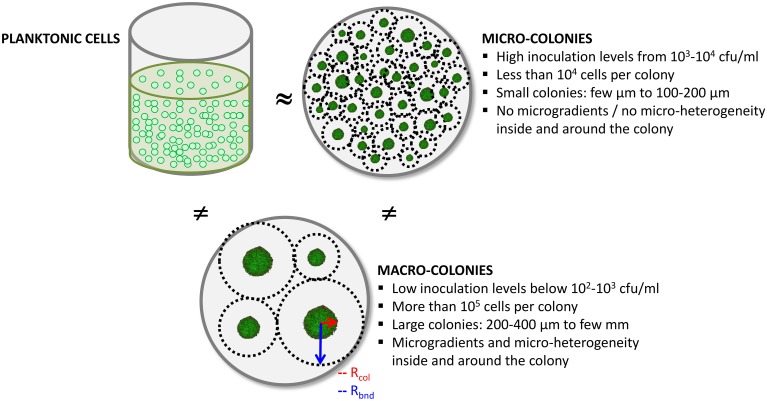
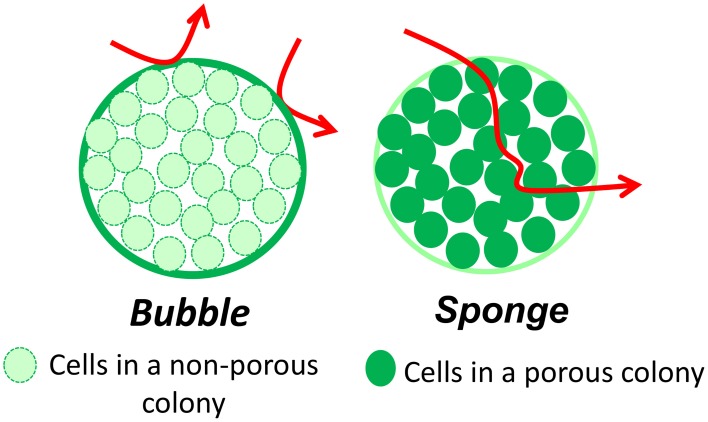
Bacteria, either indigenous or added, are immobilized in solid foods where they grow as colonies. Since the 80's, relatively few research groups have explored the implications of bacteria growing as colonies and mostly focused on pathogens in large colonies on agar/gelatine media. It is only recently that high resolution imaging techniques and biophysical characterization techniques increased the understanding of the growth of bacterial colonies, for different sizes of colonies, at the microscopic level and even down to the molecular level. This review covers the studies on bacterial colony growth in agar or gelatine media mimicking the food environment and in model cheese. The following conclusions have been brought to light. Firstly, under unfavorable conditions, mimicking food conditions, the immobilization of bacteria always constrains their growth in comparison with planktonic growth and increases the sensibility of bacteria to environmental stresses. Secondly, the spatial distribution describes both the distance between colonies and the size of the colonies as a function of the initial level of population. By studying the literature, we concluded that there systematically exists a threshold that distinguishes micro-colonies (radius < 100-200 μm) from macro-colonies (radius >200 μm). Micro-colonies growth resembles planktonic growth and no pH microgradients could be observed. Macro-colonies growth is slower than planktonic growth and pH microgradients could be observed in and around them due to diffusion limitations which occur around, but also inside the macro-colonies. Diffusion limitations of milk proteins have been demonstrated in a model cheese around and in the bacterial colonies. In conclusion, the impact of immobilization is predominant for macro-colonies in comparison with micro-colonies. However, the interaction between the colonies and the food matrix itself remains to be further investigated at the microscopic scale.
Keywords: Growth; bacterial colony; cheese; diffusion limitation; porosity; spatial distribution.
Figures

 ), 24 h (
 ), 26 h (
 ), and all measurements from 42 to 72 h (red bold line,
  ). Adapted from Jeanson et al. (2013).
Similar articles
-
Colonial vs. planktonic type of growth: mathematical modeling of microbial dynamics on surfaces and in liquid, semi-liquid and solid foods.Front Microbiol. 2015 Oct 29;6:1178. doi: 10.3389/fmicb.2015.01178. eCollection 2015. Front Microbiol. 2015. PMID: 26579087 Free PMC article. Review.
-
Porosity of Lactococcus lactis subsp. lactis LD61 colonies immobilised in model cheese.Int J Food Microbiol. 2013 May 15;163(2-3):64-70. doi: 10.1016/j.ijfoodmicro.2013.02.014. Epub 2013 Mar 1. Int J Food Microbiol. 2013. PMID: 23558188
-
Diffusion of solutes inside bacterial colonies immobilized in model cheese depends on their physicochemical properties: a time-lapse microscopy study.Front Microbiol. 2015 Apr 30;6:366. doi: 10.3389/fmicb.2015.00366. eCollection 2015. Front Microbiol. 2015. PMID: 25983724 Free PMC article.
-
Microgradients of pH do not occur around Lactococcus colonies in a model cheese.Appl Environ Microbiol. 2013 Oct;79(20):6516-8. doi: 10.1128/AEM.01678-13. Epub 2013 Aug 9. Appl Environ Microbiol. 2013. PMID: 23934499 Free PMC article.
-
The Minderoo-Monaco Commission on Plastics and Human Health.Ann Glob Health. 2023 Mar 21;89(1):23. doi: 10.5334/aogh.4056. eCollection 2023. Ann Glob Health. 2023. PMID: 36969097 Free PMC article. Review.
Cited by
-
Denitrifying bacteria respond to and shape microscale gradients within particulate matrices.Commun Biol. 2021 May 13;4(1):570. doi: 10.1038/s42003-021-02102-4. Commun Biol. 2021. PMID: 33986448 Free PMC article.
-
Transcriptomic responses of Aspergillus flavus to temperature and oxidative stresses during aflatoxin production.Sci Rep. 2021 Feb 2;11(1):2803. doi: 10.1038/s41598-021-82488-7. Sci Rep. 2021. PMID: 33531617 Free PMC article.
-
Use of the speckle imaging sub-pixel correlation analysis in revealing a mechanism of microbial colony growth.Sci Rep. 2023 Feb 14;13(1):2613. doi: 10.1038/s41598-023-29809-0. Sci Rep. 2023. PMID: 36788263 Free PMC article.
-
Selection in a growing colony biases results of mutation accumulation experiments.Sci Rep. 2022 Sep 14;12(1):15470. doi: 10.1038/s41598-022-19928-5. Sci Rep. 2022. PMID: 36104390 Free PMC article.
-
Biofilm through the Looking Glass: A Microbial Food Safety Perspective.Pathogens. 2022 Mar 12;11(3):346. doi: 10.3390/pathogens11030346. Pathogens. 2022. PMID: 35335670 Free PMC article. Review.
References
-
- Antwi M., Bernaerts K., Van Impe J. F., Geeraerd A. H. (2007). Modelling the combined effects of structured food model system and lactic acid on Listeria innocua and Lactococcus lactis growth in mono- and coculture. Int. J. Food Microbiol. 120, 71–84. 10.1016/j.ijfoodmicro.2007.04.015 - DOI - PubMed
Publication types
LinkOut - more resources
Full Text Sources
Other Literature Sources