

Comparing Observed with Predicted Weekly Influenza-Like Illness Rates during the Winter Holiday Break, United States, 2004-2013
- PMID: 26649568
- PMCID: PMC4674102
- DOI: 10.1371/journal.pone.0143791
Comparing Observed with Predicted Weekly Influenza-Like Illness Rates during the Winter Holiday Break, United States, 2004-2013
Abstract
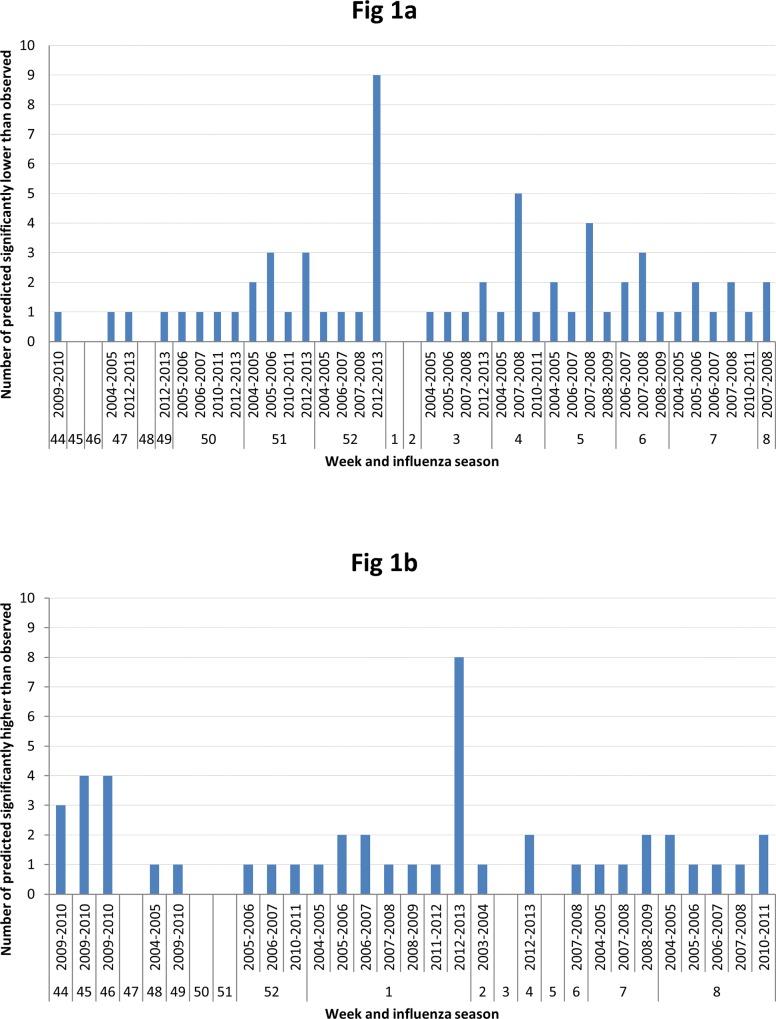
In the United States, influenza season typically begins in October or November, peaks in February, and tapers off in April. During the winter holiday break, from the end of December to the beginning of January, changes in social mixing patterns, healthcare-seeking behaviors, and surveillance reporting could affect influenza-like illness (ILI) rates. We compared predicted with observed weekly ILI to examine trends around the winter break period. We examined weekly rates of ILI by region in the United States from influenza season 2003-2004 to 2012-2013. We compared observed and predicted ILI rates from week 44 to week 8 of each influenza season using the auto-regressive integrated moving average (ARIMA) method. Of 1,530 region, week, and year combinations, 64 observed ILI rates were significantly higher than predicted by the model. Of these, 21 occurred during the typical winter holiday break period (weeks 51-52); 12 occurred during influenza season 2012-2013. There were 46 observed ILI rates that were significantly lower than predicted. Of these, 16 occurred after the typical holiday break during week 1, eight of which occurred during season 2012-2013. Of 90 (10 HHS regions x 9 seasons) predictions during the peak week, 78 predicted ILI rates were lower than observed. Out of 73 predictions for the post-peak week, 62 ILI rates were higher than observed. There were 53 out of 73 models that had lower peak and higher post-peak predicted ILI rates than were actually observed. While most regions had ILI rates higher than predicted during winter holiday break and lower than predicted after the break during the 2012-2013 season, overall there was not a consistent relationship between observed and predicted ILI around the winter holiday break during the other influenza seasons.
Conflict of interest statement
Figures
Similar articles
-
Surveillance for influenza--United States, 1997-98, 1998-99, and 1999-00 seasons.MMWR Surveill Summ. 2002 Oct 25;51(7):1-10. MMWR Surveill Summ. 2002. PMID: 12418623
-
Influenza-like illness-related emergency department visits: Christmas and New Year holiday peaks and relationships with laboratory-confirmed respiratory virus detections, Edmonton, Alberta, 2004-2014.Influenza Other Respir Viruses. 2017 Jan;11(1):33-40. doi: 10.1111/irv.12416. Epub 2016 Aug 30. Influenza Other Respir Viruses. 2017. PMID: 27442911 Free PMC article.
-
Surveillance for influenza--United States, 1994-95, 1995-96, and 1996-97 seasons.MMWR CDC Surveill Summ. 2000 Apr 28;49(3):13-28. MMWR CDC Surveill Summ. 2000. PMID: 10817484
-
Holiday weight gain: fact or fiction?Nutr Rev. 2000 Dec;58(12):378-9. doi: 10.1111/j.1753-4887.2000.tb01839.x. Nutr Rev. 2000. PMID: 11206847 Review.
-
Harmonizing influenza primary-care surveillance in the United Kingdom: piloting two methods to assess the timing and intensity of the seasonal epidemic across several general practice-based surveillance schemes.Epidemiol Infect. 2015 Jan;143(1):1-12. doi: 10.1017/S0950268814001757. Epub 2014 Jul 15. Epidemiol Infect. 2015. PMID: 25023603 Free PMC article. Review.
Cited by
-
Concordance between the Clinical Diagnosis of Influenza in Primary Care and Epidemiological Surveillance Systems (PREVIGrip Study).Int J Environ Res Public Health. 2022 Jan 23;19(3):1263. doi: 10.3390/ijerph19031263. Int J Environ Res Public Health. 2022. PMID: 35162284 Free PMC article.
-
Spatial Variation in Humidity and the Onset of Seasonal Influenza Across the Contiguous United States.Geohealth. 2022 Feb 1;6(2):e2021GH000469. doi: 10.1029/2021GH000469. eCollection 2022 Feb. Geohealth. 2022. PMID: 35136850 Free PMC article.
-
The impact of regular school closure on seasonal influenza epidemics: a data-driven spatial transmission model for Belgium.BMC Infect Dis. 2018 Jan 10;18(1):29. doi: 10.1186/s12879-017-2934-3. BMC Infect Dis. 2018. PMID: 29321005 Free PMC article.
-
A comprehensive analysis of amino-peptidase N1 protein (APN) from Anopheles culicifacies for epitope design using Immuno-informatics models.Bioinformation. 2019 Sep 17;15(8):600-612. doi: 10.6026/97320630015600. eCollection 2019. Bioinformation. 2019. PMID: 31719771 Free PMC article.
-
Contact, Travel, and Transmission: The Impact of Winter Holidays on Influenza Dynamics in the United States.J Infect Dis. 2017 Mar 1;215(5):732-739. doi: 10.1093/infdis/jiw642. J Infect Dis. 2017. PMID: 28031259 Free PMC article.
References
-
- Textbook of Influenza. Second ed. John Wiley & Son, Ltd, The Atrium, Southern Gate, Chichester, Wesr Sussex, PO 19 8SQ, UK: Wiley Blackwell; 2013.
-
- National and Regional Level Outpatient Illness and Viral Surveillance US Centers for Disease Control and Prevention. US Centers for Disease Control and Prevention. Available: http://gis.cdc.gov/grasp/fluview/fluportaldashboard.html. Accessed 21 December 2014.
Publication types
MeSH terms
LinkOut - more resources
Full Text Sources
Other Literature Sources
Medical
Miscellaneous
