. 2015 Dec 24;528(7583):565-9.
doi: 10.1038/nature16451. Epub 2015 Dec 9.

Unique role for ATG5 in neutrophil-mediated immunopathology during M. tuberculosis infection

Affiliations

Unique role for ATG5 in neutrophil-mediated immunopathology during M. tuberculosis infection

Jacqueline M Kimmey et al. Nature. .

Abstract

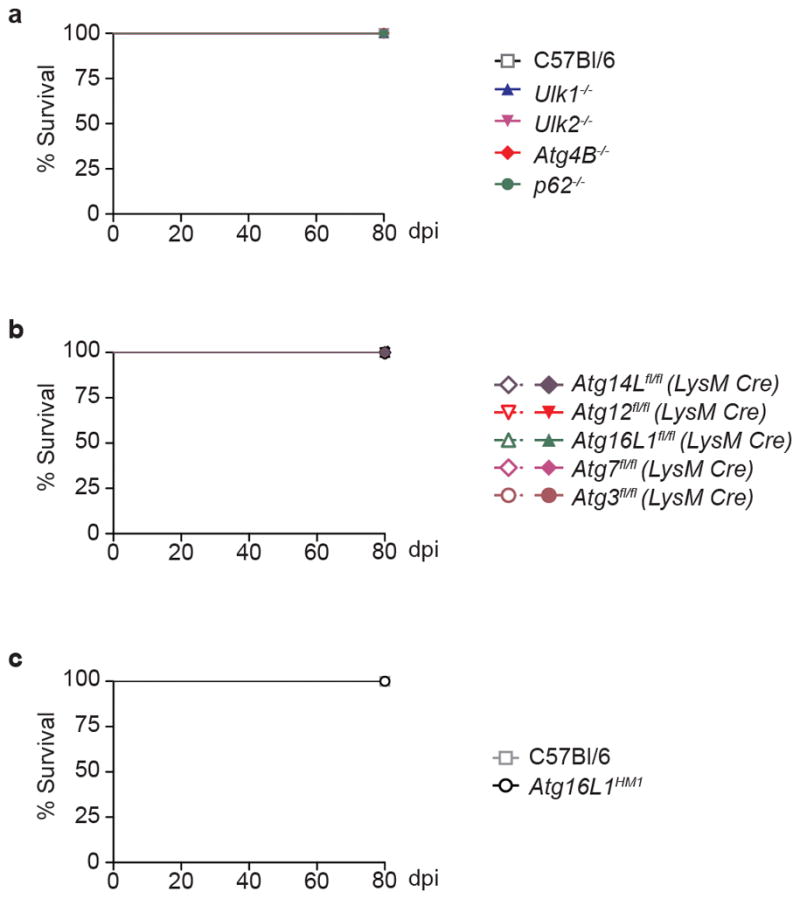
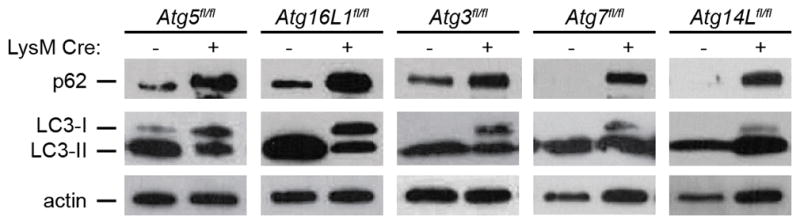
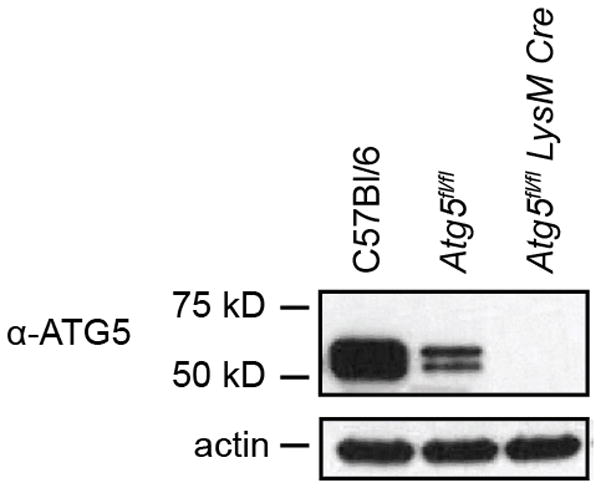
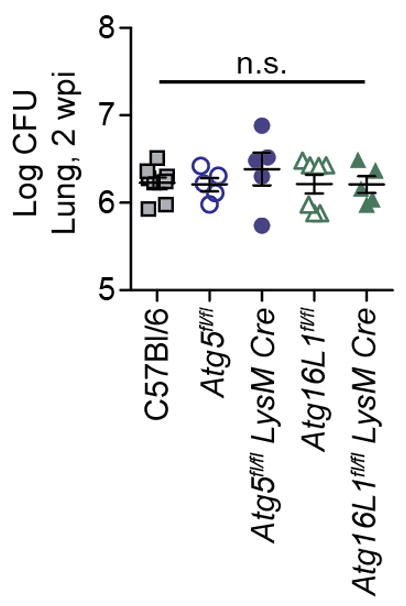
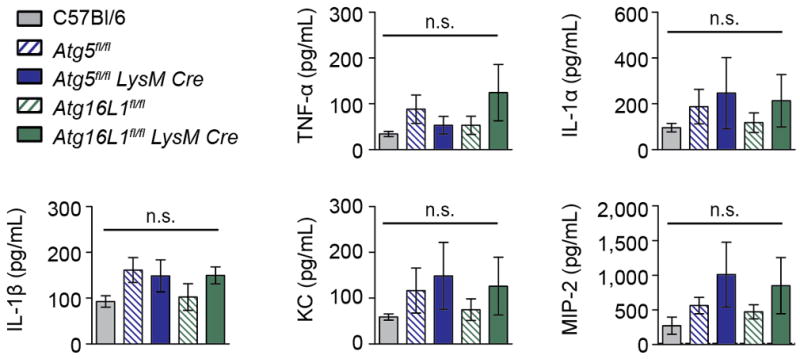
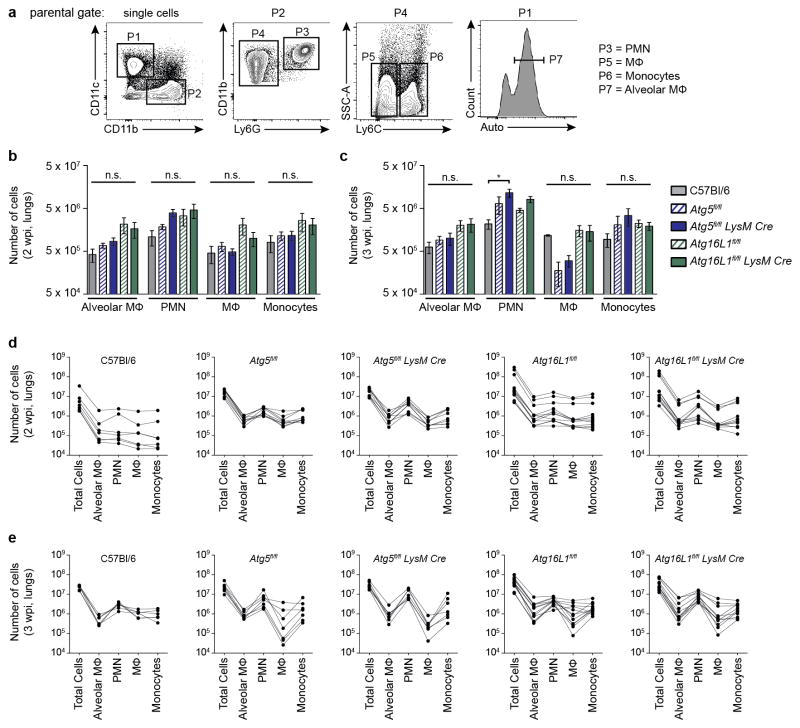
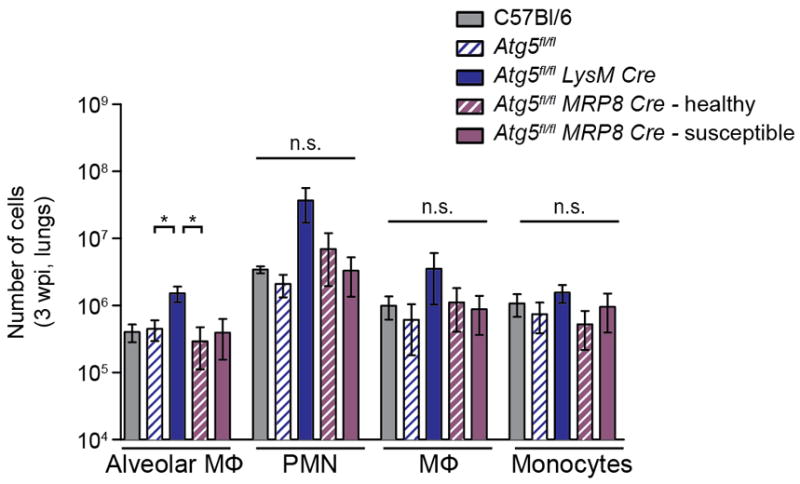
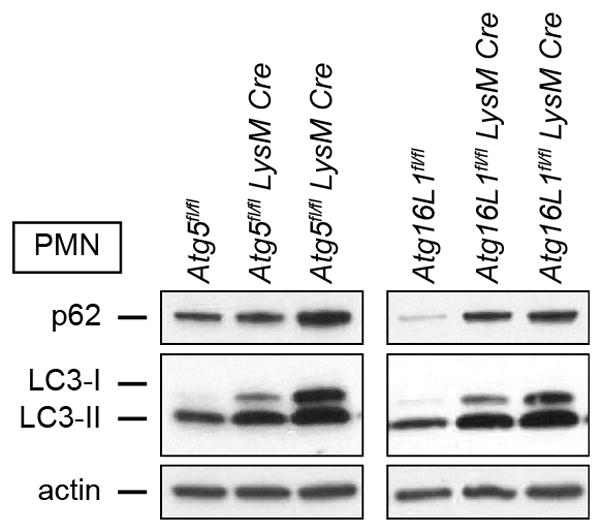
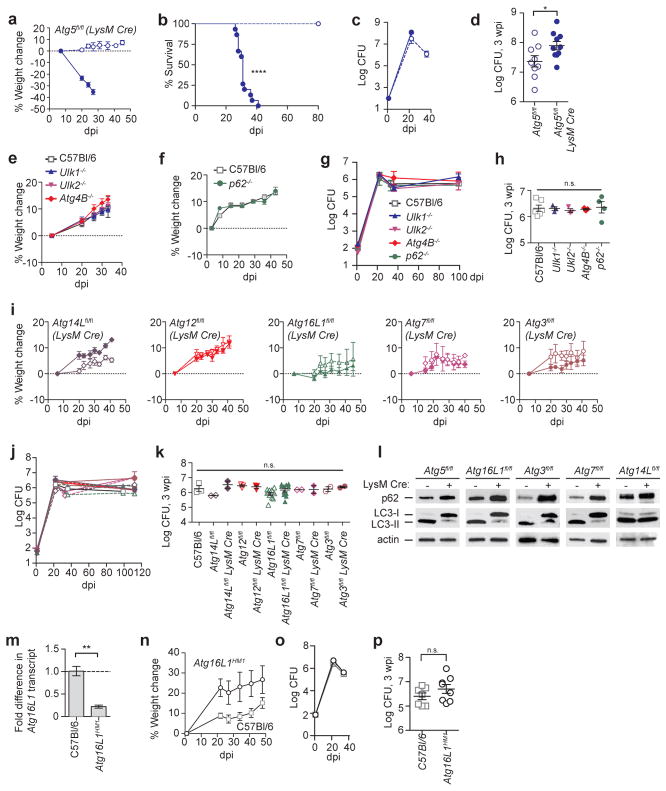
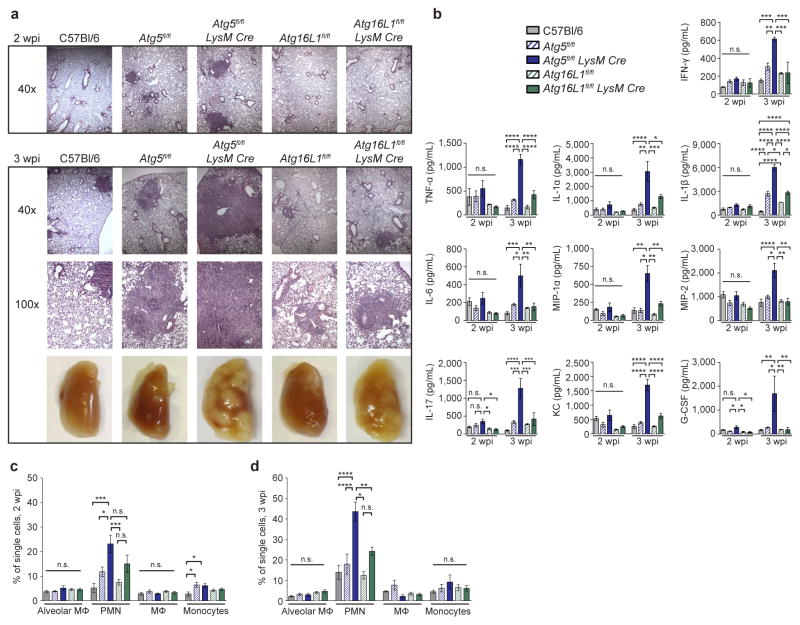
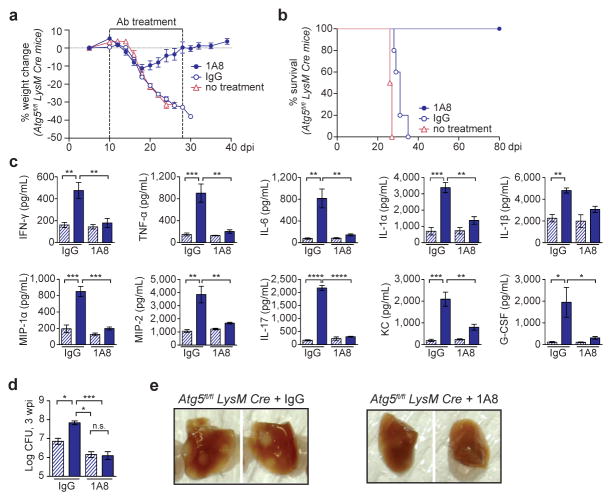
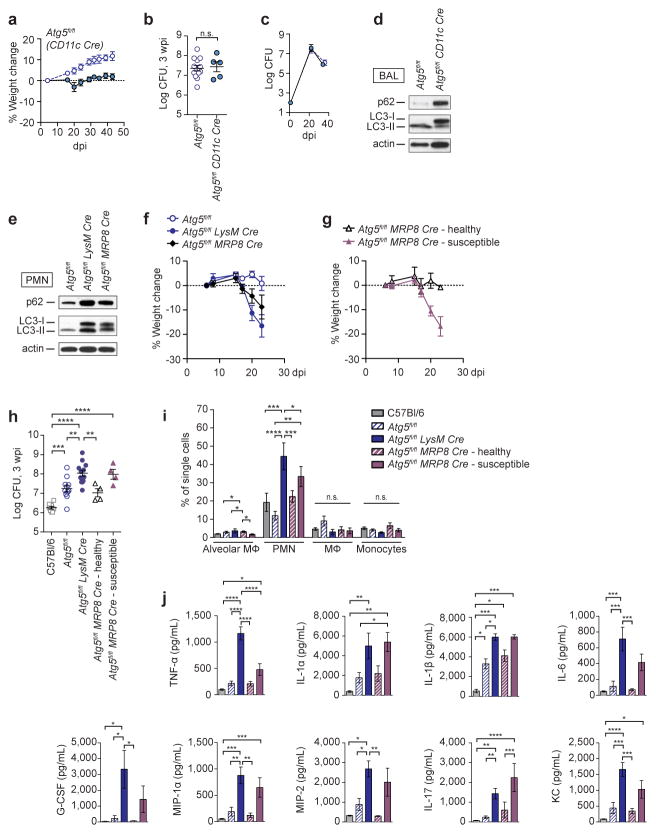
Mycobacterium tuberculosis, a major global health threat, replicates in macrophages in part by inhibiting phagosome-lysosome fusion, until interferon-γ (IFNγ) activates the macrophage to traffic M. tuberculosis to the lysosome. How IFNγ elicits this effect is unknown, but many studies suggest a role for macroautophagy (herein termed autophagy), a process by which cytoplasmic contents are targeted for lysosomal degradation. The involvement of autophagy has been defined based on studies in cultured cells where M. tuberculosis co-localizes with autophagy factors ATG5, ATG12, ATG16L1, p62, NDP52, BECN1 and LC3 (refs 2-6), stimulation of autophagy increases bacterial killing, and inhibition of autophagy increases bacterial survival. Notably, these studies reveal modest (~1.5-3-fold change) effects on M. tuberculosis replication. By contrast, mice lacking ATG5 in monocyte-derived cells and neutrophils (polymorponuclear cells, PMNs) succumb to M. tuberculosis within 30 days, an extremely severe phenotype similar to mice lacking IFNγ signalling. Importantly, ATG5 is the only autophagy factor that has been studied during M. tuberculosis infection in vivo and autophagy-independent functions of ATG5 have been described. For this reason, we used a genetic approach to elucidate the role for multiple autophagy-related genes and the requirement for autophagy in resistance to M. tuberculosis infection in vivo. Here we show that, contrary to expectation, autophagic capacity does not correlate with the outcome of M. tuberculosis infection. Instead, ATG5 plays a unique role in protection against M. tuberculosis by preventing PMN-mediated immunopathology. Furthermore, while Atg5 is dispensable in alveolar macrophages during M. tuberculosis infection, loss of Atg5 in PMNs can sensitize mice to M. tuberculosis. These findings shift our understanding of the role of ATG5 during M. tuberculosis infection, reveal new outcomes of ATG5 activity, and shed light on early events in innate immunity that are required to regulate disease pathology and bacterial replication.


Conflict of interest statement

The authors have no competing financial interests to declare.

Figures

Extended Data Figure 1
Extended Data Figure 1. Survival of mice with defects in autophagy genes other than Atg5
Percent survival of mice following infection with 100 CFU of aerosolized Mtb. a, Survival of C57Bl/6 (open squares), Ulk1−/− (blue triangles), Ulk2−/− (inverted pink triangles), Atg4B−/− (red diamonds), and p62−/− (green circles) mice. b, Survival of Atg14Lfl/fl-LysM-Cre (purple diamonds), Atg12fl/fl-LysM-Cre (red inverted triangles), Atg16L1fl/fl-LysM-Cre (green triangles), Atg7fl/fl-LysM-Cre (pink diamonds), Atg3fl/fl-LysM-Cre (brown circles) and corresponding floxed control mice. Floxed control mice are shown in open shapes, LysM-Cre-expressing mice are shown in closed shapes. c, Survival of C57Bl/6 (open squares), Atg16L1HM1 (open circles). Samples represent biological replicates. See Supplementary Figure 2 for sample sizes.
Extended Data Figure 2
Extended Data Figure 2. Analysis of autophagy in bronchoalveolar MΦ
Western blot analysis of p62, LC3, and actin levels in ex vivo macrophages isolated from bronchoalveolar lavages of uninfected mice. For gel source data, see Supplementary Figure 1.
Extended Data Figure 3
Extended Data Figure 3. Atg5fl/fl bone marrow derived MΦ are hypomorphic for ATG5
Western blot analysis of ATG5 (ATG5–ATG12 conjugate, 56 kDa) and actin in uninfected bone marrow derived MΦ. For gel source data, see Supplementary Figure 1.
Extended Data Figure 4
Extended Data Figure 4. Loss of Atg5 or Atg16L1 in LysM+ cells does not lead to increased CFU at 2 wpi
Log pulmonary CFU at 2 weeks post infection (wpi). Samples represent biological replicates.
Extended Data Figure 5
Extended Data Figure 5. Cytokine levels in uninfected lungs
Concentration of cytokines in lungs (homogenized in 1mL) from uninfected mice. Levels of IFN-γ, IL-6, MIP-1α, IL-17, and G-CSF were below the limit of detection. C57Bl/6 (grey solid bars), Atg5fl/fl (blue striped bars), Atg5fl/fl-LysM-Cre (blue solid bars), Atg16L1fl/fl (green striped bars), Atg16L1fl/fl-LysM-Cre (green solid bars). Statistical differences were determined by one-way ANOVA and Bonferonni’s multiple comparison test. n.s., not significant. Samples represent biological replicates. See Supplementary Figure 2 for sample sizes and results from all statistical comparisons.
Extended Data Figure 6
Extended Data Figure 6. Number of inflammatory cells in lungs of mice at 2 and 3 wpi (related to Fig. 2)
a, Gating strategy for analysis of inflammatory cells in lungs at 2 and 3 wpi. Single lung cells were gated based on CD11b, CD11c, Ly6G, Ly6C and autofluorescence (auto). The parental gate is shown above each contour plot. Representative data is shown from an Atg5fl/fl mouse at 2 wpi. b, c, C57Bl/6 (grey solid bars), Atg5fl/fl (blue striped bars), Atg5fl/fl-LysM-Cre (blue solid bars), Atg16L1fl/fl (green striped bars), Atg16L1fl/fl-LysM-Cre (green solid bars). Mean number of alveolar MΦ, PMN, recruited MΦ, and inflammatory monocytes in lungs at 2 wpi (b) and 3 wpi (c). Flow cytometry data presented in (b) and (c) and in Fig. 2 are the compilation of results from five experiments. In some experiments, different amounts of lung were collected for analysis, making it difficult to compare the average number of each cells between strains, unless the data is normalized (as done in Fig. 2c, d – percentage of total cells). Therefore, to compare the raw number of cells detected in each cell population, each mouse analyzed at 2 wpi (d) and 3 wpi (e) has been graphed individually. Each line represents a different mouse, with dots indicating the number of total cells, alveolar MΦ, PMN, recruited MΦ and inflammatory monocytes. Statistical differences were determined by one-way ANOVA and Bonferonni’s multiple comparison test (b, c). * P < 0.05. Notable comparisons that were not significantly different are designated as n.s. Samples represent biological replicates. See Supplementary Figure 2 for sample sizes and results from all statistical comparisons.
Extended Data Figure 7
Extended Data Figure 7. Number of inflammatory cells in lungs of mice at 3 wpi (related to Fig. 4)
Number of alveolar MΦ, PMN, recruited MΦ, and inflammatory monocytes in lungs at 3 wpi. C57Bl/6 (grey solid bars), Atg5fl/fl (blue striped bars), Atg5fl/fl-LysM-Cre (blue solid bars), “healthy” Atg5fl/fl-MRP8-Cre (purple striped bars), and “susceptible” Atg5fl/fl-MRP8-Cre (purple solid bars). Statistical differences were determined by one-way ANOVA and Bonferonni’s multiple comparison test * P < 0.05. Notable comparisons that were not significantly different are designated as n.s. Samples represent biological replicates. See Supplementary Figure 2 for sample sizes and results from all statistical comparisons.
Extended Data Figure 8
Extended Data Figure 8. Analysis of autophagy in bone marrow PMN
Western blot analysis of p62, LC3, and actin in bone marrow PMN from uninfected mice. Each lane represents an individual mouse. Two replicates of the Atg5fl/fl-LysM-Cre and Atg16L1fl/fl-LysM-Cre mice are shown. For gel source data, see Supplementary Figure 1.
Figure 1
Figure 1. ATG5, in contrast to other ATG factors, is essential to control Mtb infection
a – k, Mice infected with approximately 100 CFU of Mtb were monitored at various days post infection (dpi) or weeks post infection (wpi). a, Weight change, b, survival, and c, d, log pulmonary CFU of Atg5fl/fl (open circles) and Atg5fl/fl-LysM-Cre (closed circles). e, f, Weight change, and g, h, log pulmonary CFU of C57Bl/6 (open squares), Ulk1−/− (blue triangles), Ulk2−/− (inverted pink triangles), Atg4B−/− (red diamonds), and p62−/− (green circles) mice. i, Weight change and j, k, log pulmonary CFU of Atg14Lfl/fl-LysM-Cre (purple diamonds), Atg12fl/fl-LysM-Cre (red inverted triangles), Atg16L1fl/fl-LysM-Cre (green triangles), Atg7fl/fl-LysM-Cre (pink diamonds), Atg3fl/fl-LysM-Cre (brown circles) and corresponding floxed control mice. Floxed control mice are shown in open shapes, LysM-Cre-expressing mice are shown in closed shapes. l, Western blot analysis of p62, LC3 and actin in ex vivo peritoneal MΦ from uninfected mice. m, Fold change in Atg16L1 transcript from Atg16L1HM1 lungs as compared to C57Bl/6 at 3 wpi. n, Weight change and o, p, log pulmonary CFU of Atg16L1HM1 (open circles) and C57Bl/6 mice (open squares). When used, center values represent the mean ± SEM. Statistical differences were determined by log-rank Mantel-Cox test (b), Student’s t-test (d, m, and p) or one-way ANOVA and Bonferonni’s multiple comparison test (h, k). * P < 0.05, ** P < 0.01, ****P < 0.0001. Notable comparisons that were not significantly different are designated as n.s. Samples represent biological replicates. See Supplementary Fig. 1 for gel source data, Supplementary Fig. 2 for sample sizes and results from all statistical comparisons.
Figure 2
Figure 2. Loss of Atg5 in LysM+ cells leads to earlier and more severe lung inflammation during Mtb infection
a, H&E stained histology of lungs at 2 and 3 wpi and gross pathology of lungs at 3 wpi. b – d, C57Bl/6 (grey solid bars), Atg5fl/fl (blue striped bars), Atg5fl/fl-LysM-Cre (blue solid bars), Atg16L1fl/fl (green striped bars), Atg16L1fl/fl-LysM-Cre (green solid bars). b, Concentration of cytokines in lungs (homogenized in 5mL) at 2 and 3 wpi as detected by ELISA. c, d, Frequency of alveolar MΦ, PMN, recruited MΦ, and inflammatory monocytes as a percentage of all single cells in lungs at 2 wpi (c) and 3 wpi (d). Statistical differences were determined by one-way ANOVA and Bonferonni’s multiple comparison test (b–d). * P < 0.05, ** P < 0.01, ***P < 0.001, ****P < 0.0001. Notable comparisons that were not significantly different are designated as n.s. Samples represent biological replicates. See Supplementary Figure 2 for sample sizes and results from all statistical comparisons, Extended Data Fig. 5 for cytokine levels in uninfected lungs, and Extended Data Fig. 6 for gating strategy and number of cells in lungs.
Figure 3
Figure 3. Depletion of PMN allows for survival of Atg5fl/fl-LysM-Cre mice during Mtb infection
a, Weight change and b, survival of Atg5fl/fl-LysM-Cre mice that received PMN-depleting anti-Ly6G (1A8, closed blue circle), isotype control (IgG, open blue circle), or no treatment (open pink triangle) every other day from 10 – 28 dpi. c, d, Atg5fl/fl (blue striped bars) and Atg5fl/fl-LysM-Cre (blue solid bars) mice were treated with IgG or 1A8 and analyzed at 3 wpi. c, Cytokine concentration in lungs (homogenized in 5mL) and d, log pulmonary CFU. e, Pulmonary pathology of Atg5fl/fl-LysM-Cre mice at 3 wpi following treatment with IgG or 1A8. Statistical differences were determined by one-way ANOVA and Bonferonni’s multiple comparison test (c, d). * P < 0.05, ** P < 0.01, ***P < 0.001, ****P < 0.0001. Notable comparisons that were not significantly different are designated as n.s. Samples represent biological replicates. See Supplementary Figure 2 for sample sizes and results from all statistical comparisons.
Figure 4
Figure 4. Loss of Atg5 in PMN, but not alveolar MΦ or DCs, can cause susceptibility to Mtb
a, Weight change and b, c, log pulmonary CFU of Atg5fl/fl (open circles) and Atg5fl/fl-CD11c-Cre (closed circles). d, Western blot analysis of p62, LC3, and actin in bronchoalveolar MΦ from Atg5fl/fl and Atg5fl/fl-CD11c-Cre mice. e, Western blot analysis of p62, LC3, and actin in bone marrow PMN from Atg5fl/fl, Atg5fl/fl-LysM-Cre and Atg5fl/fl-MRP8-Cre mice. f, Weight change of Atg5fl/fl (open blue circles), Atg5fl/fl-LysM-Cre (closed blue circles), Atg5fl/fl-MRP8-Cre (closed black diamonds) mice following infection with Mtb. g, Weight change of mice following infection with Mtb. 50% of Atg5fl/fl-MRP8-Cre mice lost over 5% of their weight by 20 dpi (“susceptible,” closed purple triangles) while 50% of Atg5fl/fl-MRP8-Cre mice did not (“healthy,” open black triangles). h, Log pulmonary CFU at 3 wpi. i, j, C57Bl/6 (grey solid bars), Atg5fl/fl (blue striped bars), Atg5fl/fl-LysM-Cre (blue solid bars), “healthy” Atg5fl/fl-MRP8-Cre (purple striped bars), and “susceptible” Atg5fl/fl-MRP8-Cre (purple solid bars). i, Concentration of cytokines in lungs (homogenized in 5mL) at 3 wpi. j, Frequency of alveolar MΦ, PMN, recruited MΦ, and inflammatory monocytes as a percentage of single cells in lungs at 3 wpi. When used, center values represent the mean ± SEM. Statistical differences were determined by one-way ANOVA and Bonferonni’s multiple comparison test (h–j). * P < 0.05, ** P < 0.01, ***P < 0.001, ****P < 0.0001. Notable comparisons that were not significantly different are designated as n.s. Samples represent biological replicates. See Supplementary Figure 2 for sample sizes and results from all statistical comparisons, and Extended Data Fig. 7 for total numbers of cells in lungs.

Comment in

References

    1. Deretic V. Autophagy in Tuberculosis. Cold Spring Harbor Perspectives in Medicine. 2014 doi: 10.1101/cshperspect.a018481. - DOI - PMC - PubMed
    1. Dutta RK, Kathania M, Raje M, Majumdar S. IL-6 inhibits IFN-γ induced autophagy in Mycobacterium tuberculosis H37Rv infected macrophages. Int J Biochem Cell Biol. 2012;44:942–954. - PubMed
    1. Juárez E, et al. NOD2 enhances the innate response of alveolar macrophages to Mycobacterium tuberculosis in humans. Eur J Immunol. 2012;42:880–889. - PubMed
    1. Watson RO, Manzanillo PS, Cox JS. Extracellular M. tuberculosis DNA Targets Bacteria for Autophagy by Activating the Host DNA-Sensing Pathway. Cell. 2012;150:803–815. - PMC - PubMed
    1. Seto S, Tsujimura K, Horii T, Koide Y. Autophagy Adaptor Protein p62/SQSTM1 and Autophagy-Related Gene Atg5 Mediate Autophagosome Formation in Response to Mycobacterium tuberculosis Infection in Dendritic Cells. PLoS ONE. 2013;8:e86017. - PMC - PubMed

Publication types

MeSH terms