. 2015 Nov 2;11(11):2114-2122.
doi: 10.1080/15548627.2015.1099796.

A large-scale analysis of autophagy-related gene expression identifies new regulators of autophagy

Affiliations

A large-scale analysis of autophagy-related gene expression identifies new regulators of autophagy

Amélie Bernard et al. Autophagy. .

Abstract

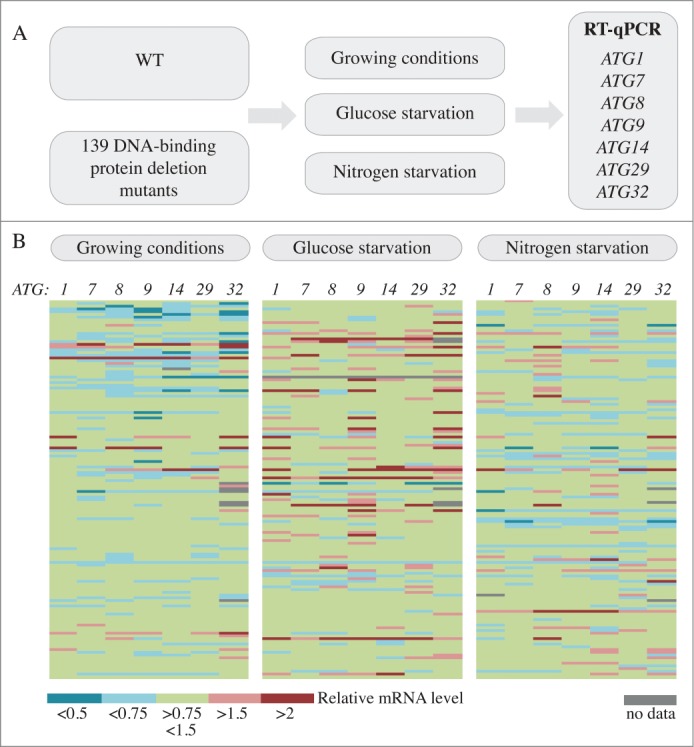
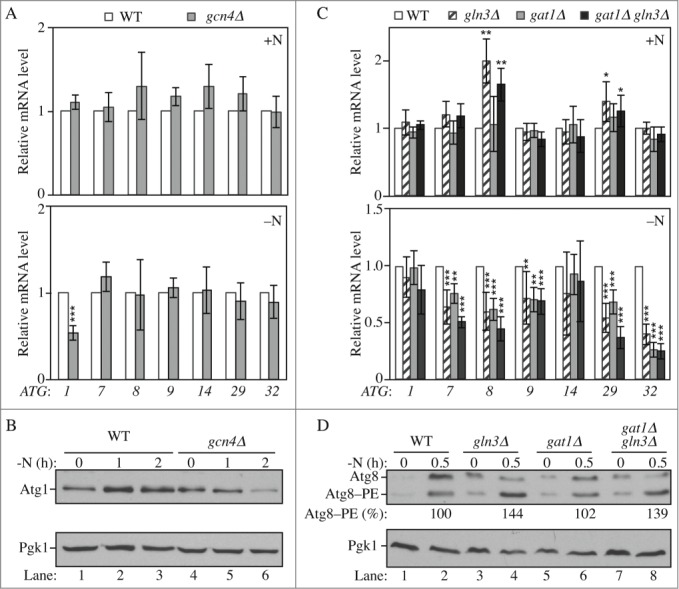
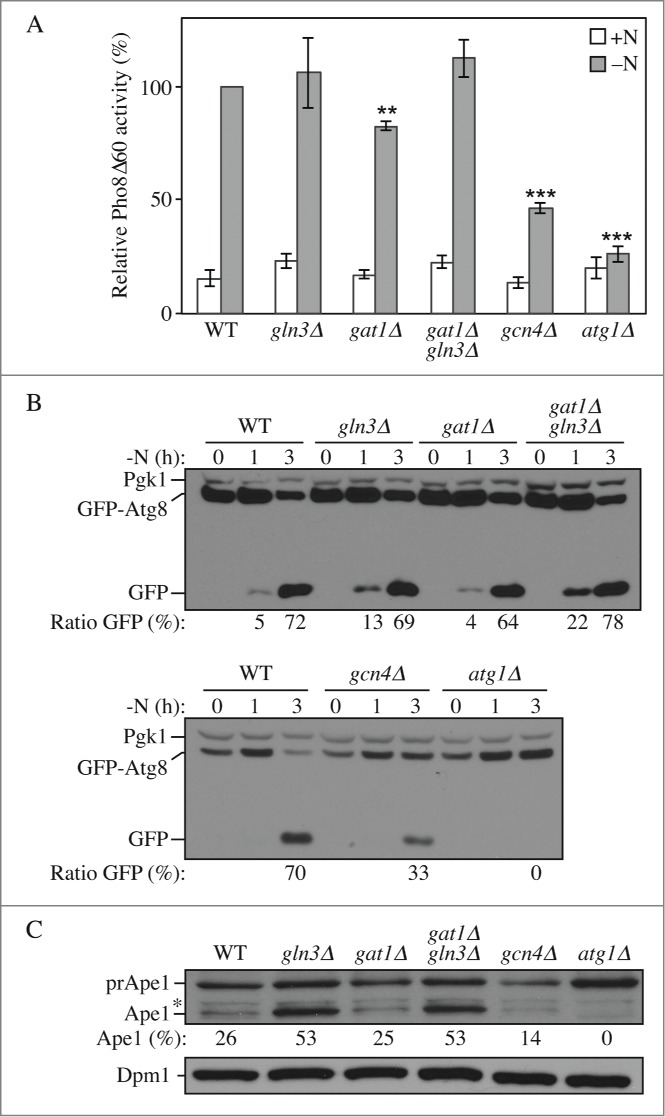
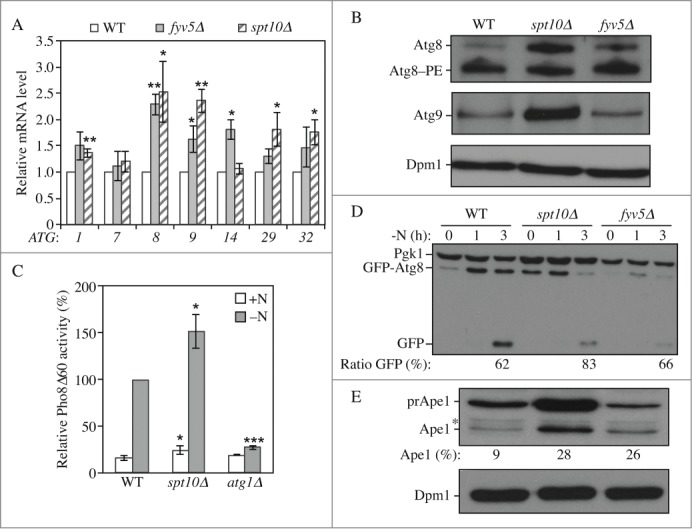
Autophagy is a pathway mediating vacuolar degradation and recycling of proteins and organelles, which plays crucial roles in cellular physiology. To ensure its proper cytoprotective function, the induction and amplitude of autophagy are tightly regulated, and defects in its regulation are associated with various diseases. Transcriptional control of autophagy is a critical aspect of autophagy regulation, which remains largely unexplored. In particular, very few transcription factors involved in the activation or repression of autophagy-related gene expression have been characterized. To identify such regulators, we analyzed the expression of representative ATG genes in a large collection of DNA-binding mutant deletion strains in growing conditions as well as after nitrogen or glucose starvation. This analysis identified several proteins involved in the transcriptional control of ATG genes. Further analyses showed a correlation between variations in expression and autophagy magnitude, thus identifying new positive and negative regulators of the autophagy pathway. By providing a detailed analysis of the regulatory network of the ATG genes our study paves the way for future research on autophagy regulation and signaling.

Keywords: autophagy; gene expression; stress; transcription factor; yeast.


Figures

Figure 1.
Figure 1.
A screen for DNA-binding proteins involved in the regulation of ATG gene expression. (A) Schematic of the screen. (B) Color graph illustrating the results of the screen. Each line represents the mRNA level of an independent mutant relative to the wild type in the same condition, which was set to 1.
Figure 2.
Figure 2.
Gln3, Gat1 and Gcn4 are transcriptional modulators of ATG genes upon nitrogen starvation. (A-B) Gcn4 is required for the proper induction of ATG1 upon nitrogen starvation. (A) Wild-type (WLY176; SEY6210) and gcn4Δ (YAB387) cells were grown in YPD (+N) until mid-log phase (upper panel) and then starved for nitrogen (-N) for 1 h (lower panel). mRNA levels were quantified by RT-qPCR. The mRNA level of individual ATG genes was normalized to the mRNA level of the corresponding gene in wild-type cells, which was set to 1. The data represent the average of at least 3 independent experiments. (B) Wild-type and gcn4Δ cells were grown in YPD until mid-log phase and then starved for nitrogen (-N) for the indicated times. Protein extracts were analyzed by western blot with anti-Atg1 and anti-Pgk1 (loading control) antisera. (C-D) Gln3 and Gat1 are required for the proper induction of ATG7, ATG8, ATG9, ATG29 and ATG32 after nitrogen starvation; the deletion of GLN3 increases the expression of ATG8 and ATG29 in growing conditions. (C) Wild-type (WLY176), gln3Δ (YAB385), gat1Δ (YAB384) and gat1Δ gln3Δ (YAB386) cells were grown and mRNA analyzed as in (A). The data represent the average of at least 3 independent experiments. (D) For the analysis of Atg8 protein level, wild-type (WLY176; SEY6210), gln3Δ (YAB385), gat1Δ (YAB384) and gat1Δ gln3Δ (YAB386) cells were grown as in (B). Protein extracts were analyzed by western blot with anti-Atg8 and anti-Pgk1 (loading control) antisera. The percent Atg8–PE of total Atg8 is indicated.
Figure 3.
Figure 3.
Gln3, Gat1 and Gcn4 affect autophagy activity. Wild-type (WLY176), gln3Δ (YAB385), gat1Δ (YAB384), gat1Δ gln3Δ (YAB386), gcn4Δ (YAB387) and atg1Δ (WLY192) cells were grown in YPD (+N) and then starved for nitrogen for the indicated times. (A) Autophagy activity as measured by the Pho8Δ60 assay is decreased in gat1Δ and gcn4Δ cells. Cells were starved for nitrogen for 3 h (-N). The Pho8Δ60 activity was measured and normalized to the activity of the wild-type cells after starvation, which was set to 100%. n=3 independent experiments. (B) Autophagy as measured by the GFP-Atg8 processing assay is increased shortly after starvation in gln3Δ and gat1Δ gln3Δ cells, but decreased in gat1Δ and gcn4Δ cells. Cells were transformed with an integrating plasmid carrying a GFP-Atg8 construct under the control of the CUP1 promoter. Cells were collected and protein extracts analyzed by western blot with anti-YFP antibody and anti-Pgk1 (loading control) antiserum. The percentage of free GFP:total GFP is indicated. (C) The Cvt pathway as measured by the maturation of prApe1 is increased in gln3Δ and gat1Δ gln3Δ cells but decreased in gcn4Δ cells. Cells were grown in nutrient-rich medium until mid-log phase and then collected. Protein extracts were analyzed by western blot with anti-Ape1 antiserum and anti-Dpm1 (loading control) antibody. prApe1, precursor form; Ape1, mature form. The percentage of Ape1:total Ape1 is indicated. *, Nonspecific band.
Figure 4.
Figure 4.
Spt10 and Fyv5 are transcriptional repressors of ATG gene expression. Wild type (WLY176), spt10Δ (YAB415), fyv5Δ (YAB414) and atg1Δ (WLY192) cells were grown in YPD (+N) until mid-log phase. (A) Spt10 and Fyv5 repress the expression of ATG genes in growing conditions. mRNA was extracted and quantified by RT-qPCR as in Figure 2. Data represent the average of at least 3 independent experiments. (B) Protein extracts were analyzed by western blot with anti-Atg8, anti-Atg9 and anti-Dpm1 (loading control) antisera and antibodies. (C-D) Autophagy is increased in spt10Δ cells. Cells were grown in YPD until mid-log phase (+N) and then starved for nitrogen (-N) for the indicated times. (C) The Pho8Δ60 activity was measured and normalized as in Figure 2 for cells that were starved for 3 h. Data represent the average of at least 3 independent experiments. (D) Cells were transformed with an integrating plasmid carrying a GFP-Atg8 construct under the control of the endogenous ATG8 promoter. Protein extracts were analyzed by western blot with anti-YFP antibody and anti-Pgk1 (loading control) antisera. The percentage of free GFP:total GFP is indicated. (E) The Cvt pathway as measured by the maturation of prApe1 is increased in spt10Δ and fyv5Δ cells. Proteins were extracted from cells grown in nutrient-rich conditions, and the extracts were analyzed by western blot with anti-Ape1 antiserum and anti-Dpm1 (loading control) antibody. prApe1, precursor form; Ape1, mature form. The percentage of Ape1:total Ape1 is indicated. *, Nonspecific band.
Figure 5.
Figure 5.
Sfl1 promotes ATG gene expression and autophagy. (A–B) The overexpression of Sfl1 induces the expression of ATG genes and proteins. Wild-type cells (WLY176; SEY6210) and cells with overexpressed (OE) Sfl1 (YAB377) were grown in YPD (+N) until mid-log phase. (A) Cells in growing conditions (+N, upper panel) and after 1 h of nitrogen starvation (-N, lower panel) were collected. mRNA levels were analyzed and quantified as in Figure 2. Data represent the average of at least 3 independent experiments. (B) Protein extracts were analyzed by western blot with anti-Atg1, anti-Atg9, anti-Atg8 and anti-Pgk1 (loading control) antisera. (C) The overexpression of Sfl1 promotes autophagy activity in growing conditions. Cells were transformed with an integrating plasmid carrying a GFP-Atg8 construct under the endogenous ATG8 promoter. Protein extracts were analyzed by western blot with anti-YFP antibody and anti-Pgk1 (loading control) antisera. The percentage of free GFP:total GFP is indicated. (D) The Cvt pathway as measured by the maturation of prApe1 is increased in cells overexpressing Sfl1. Proteins were extracted from cells grown in nutrient-rich conditions. Extracts were analyzed by western blot with anti-Ape1 antiserum and anti-Dpm1 (loading control) antibody. prApe1, precursor form; Ape1, mature form. The percentage of Ape1:total Ape1 is indicated. *, Nonspecific band.

References

    1. Xie Z, Klionsky DJ. Autophagosome formation: core machinery and adaptations. Nat Cell Biol 2007; 9:1102-9; PMID:17909521; http://dx.doi.org/ 10.1038/ncb1007-1102 - DOI - PubMed
    1. Tsukada M, Ohsumi Y. Isolation and characterization of autophagy-defective mutants of Saccharomyces cerevisiae. FEBS Lett 1993; 333:169-74; PMID:8224160; http://dx.doi.org/ 10.1016/0014-5793(93)80398-E - DOI - PubMed
    1. Levine B, Klionsky DJ. Development by self-digestion: molecular mechanisms and biological functions of autophagy. Dev Cell 2004; 6:463-77; PMID:15068787; http://dx.doi.org/ 10.1016/S1534-5807(04)00099-1 - DOI - PubMed
    1. Deretic V, Levine B. Autophagy, immunity, and microbial adaptations. Cell Host Microbe 2009; 5:527-49; PMID:19527881; http://dx.doi.org/ 10.1016/j.chom.2009.05.016 - DOI - PMC - PubMed
    1. Shi CS, Shenderov K, Huang NN, Kabat J, Abu-Asab M, Fitzgerald KA, Sher A, Kehrl JH. Activation of autophagy by inflammatory signals limits IL-1beta production by targeting ubiquitinated inflammasomes for destruction. Nat Immunol 2012; 13:255-63; PMID:22286270; http://dx.doi.org/ 10.1038/ni.2215 - DOI - PMC - PubMed