. 2015 Dec;30(12):1299-315.
doi: 10.1007/s10654-015-0105-7. Epub 2015 Dec 9.

The Rotterdam Scan Study: design update 2016 and main findings

Affiliations

The Rotterdam Scan Study: design update 2016 and main findings

M Arfan Ikram et al. Eur J Epidemiol. 2015 Dec.

Abstract

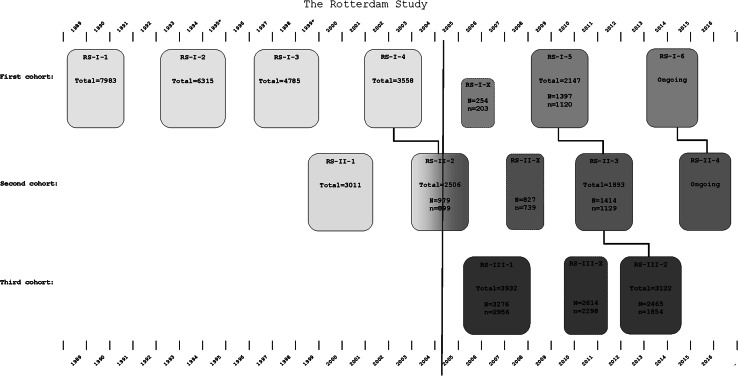
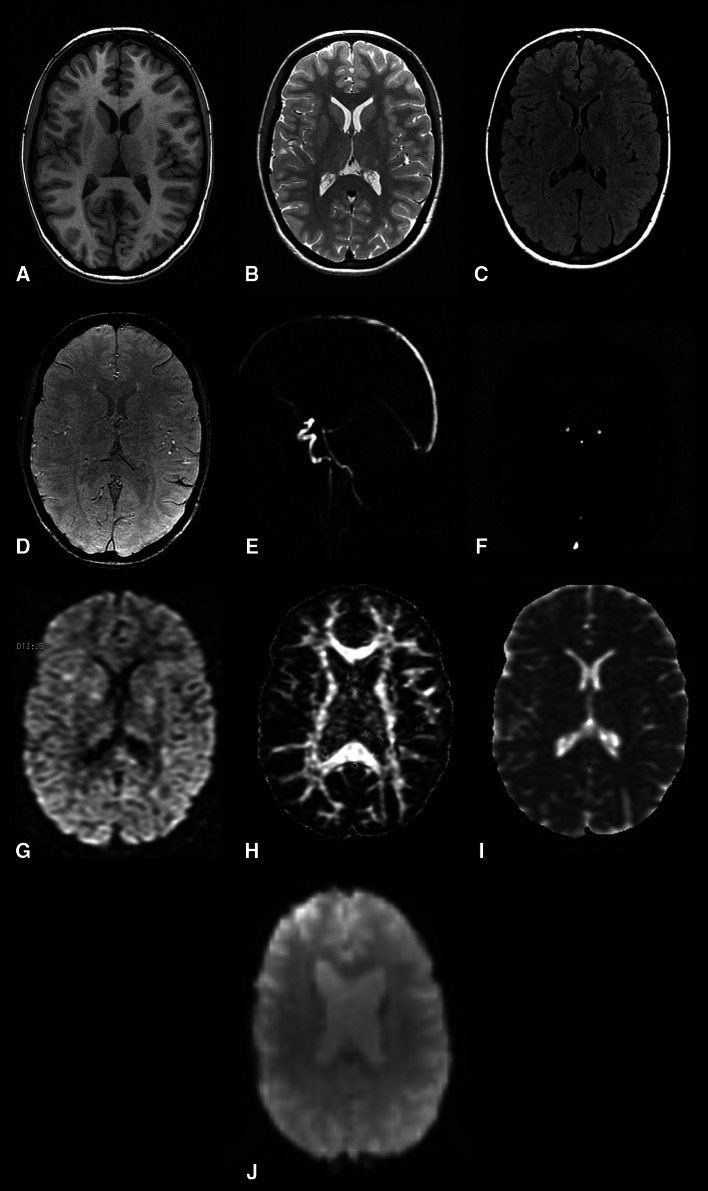
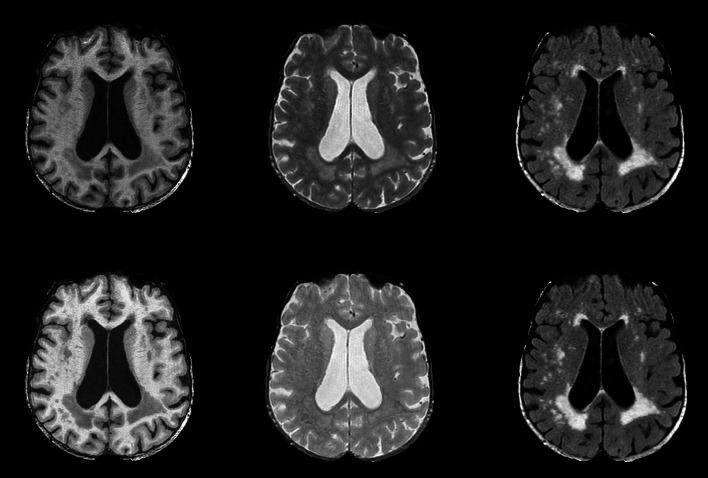
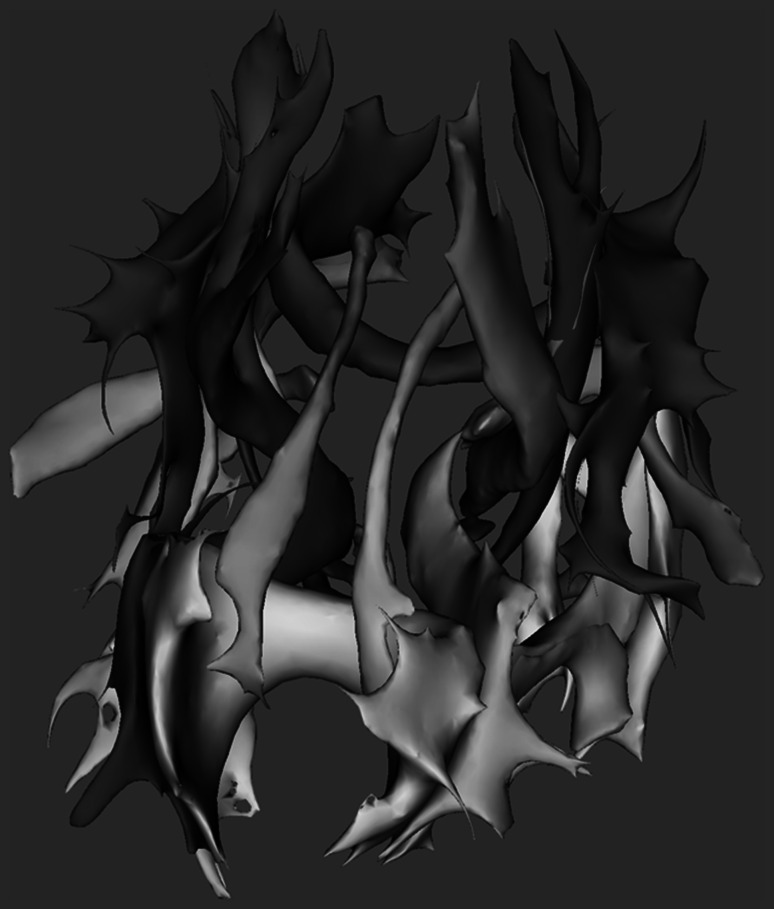
Imaging plays an essential role in research on neurological diseases in the elderly. The Rotterdam Scan Study was initiated as part of the ongoing Rotterdam Study with the aim to elucidate the causes of neurological disease by performing imaging of the brain in a prospective population-based setting. Initially, in 1995 and 1999, random subsamples of participants from the Rotterdam Study underwent neuroimaging, whereas from 2005 onwards MRI has been implemented into the core protocol of the Rotterdam Study. In this paper, we discuss the background and rationale of the Rotterdam Scan Study. Moreover, we describe the imaging protocol, image post-processing techniques, and the main findings to date. Finally, we provide recommendations for future research, which will also be topics of investigation in the Rotterdam Scan Study.

Keywords: Alzheimer’s disease; Cerebral blood flow; Cohort study; Dementia; Diffusion tensor imaging; Epidemiology; Genetics; Infarcts; Microbleeds; Neuroimaging; Population-based; Risk factors; Stroke; White matter lesions.


Figures

Fig. 1
Fig. 1
Overview of the sub-cohorts and examination visits of the Rotterdam Study, and imaging visits of the Rotterdam Scan Study. Boxes indicate examination visits of the three cohorts of the Rotterdam Study. Boxes with solid colors indicate visits, during which MRI imaging was conducted as part of the core protocol. Examination visits indicated with an ‘X’ indicate extra visits during which only MRI was performed. The red vertical line indicates the implementation of MRI on site in the core protocol of the Rotterdam Study. In 1995 and 1999 (indicated with *) 567 persons underwent MRI as part of the Rotterdam Scan Study outside the core protocol of the Rotterdam Study. ‘Total’ indicates the total number of persons taking part in that Rotterdam Study examination visit. ‘N’ indicates the number of persons that were eligible (no MRI contra-indications and no claustrophobia) and invited to take part in the Rotterdam Scan Study. ‘n’ indicates the number of persons that underwent brain MRI in the Rotterdam Scan Study
Fig. 2
Fig. 2
Depiction of the images acquired using the MRI protocol. First row: T1-weighted (a), proton-density-weighted (b), and fluid attenuated inversion recovery (c) images. Second row: T2*-weighted (d) image, sagittal scout for the 2D phase contrast measurement (e), and the resulting flow image (f). Third row: example of an image acquired using diffusion weighted imaging (g), map of fractional anisotropy (h), map of mean diffusivity (i), and resting-state functional MRI (j)
Fig. 3
Fig. 3
Example of brain tissue segmentation. Left column T1weighted sequence with k-nearest neighbor based tissue segmentation into grey matter (orange), white matter (green), cerebrospinal fluid (purple), and white matter lesions (red). Middle column: Proton-density weighted sequence with similar tissue segmentation. Right column FLAIR-sequence with white matter lesion segmentation (pink)
Fig. 4
Fig. 4
Example of the automatic analysis of diffusion MRI characteristics in 23 white matter structures
Fig. 5
Fig. 5
Screenshot of the tool which enables the visualization of the original scan with the image processing results. On the left screen, the mask for total intracranial volume is shown. On the right screen the rater can evaluate the tissue segmentation. In the lower panel, the rater can indicate the quality of the mask, the brain tissue segmentation and the white matter lesion segmentation

References

    1. Hachinski V. Stroke and Alzheimer disease: fellow travelers or partners in crime? Arch Neurol. 2011;68(6):797–798. - PubMed
    1. Seshadri S, Wolf PA, Beiser A, Au R, McNulty K, White R, et al. Lifetime risk of dementia and Alzheimer’s disease. The impact of mortality on risk estimates in the Framingham Study. Neurology. 1997;49(6):1498–1504. - PubMed
    1. Seshadri S, Wolf PA. Lifetime risk of stroke and dementia: current concepts, and estimates from the Framingham Study. Lancet Neurol. 2007;6(12):1106–1114. - PubMed
    1. Thies W, Bleiler L. 2011 Alzheimer’s disease facts and figures. Alzheimers Dement. 2011;7(2):208–244. - PubMed
    1. Meyer JS, Kawamura J, Terayama Y. White matter lesions in the elderly. J Neurol Sci. 1992;110(1–2):1–7. - PubMed

Publication types

MeSH terms

LinkOut - more resources