. 2015 Dec 9;11(12):e1004646.
doi: 10.1371/journal.pcbi.1004646. eCollection 2015 Dec.

Anxiety-Like Behavioural Inhibition Is Normative under Environmental Threat-Reward Correlations

Affiliations

Anxiety-Like Behavioural Inhibition Is Normative under Environmental Threat-Reward Correlations

Dominik R Bach. PLoS Comput Biol. .

Abstract

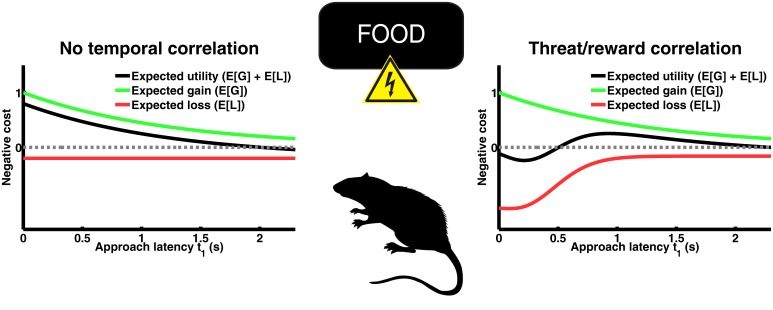
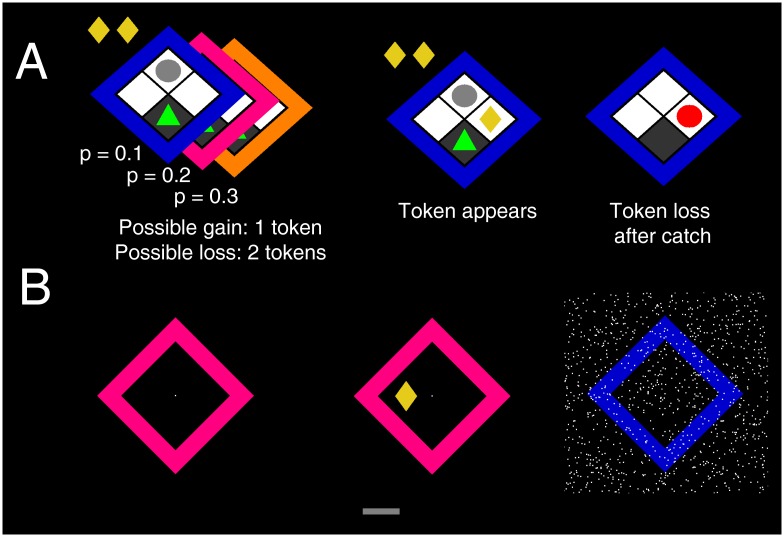
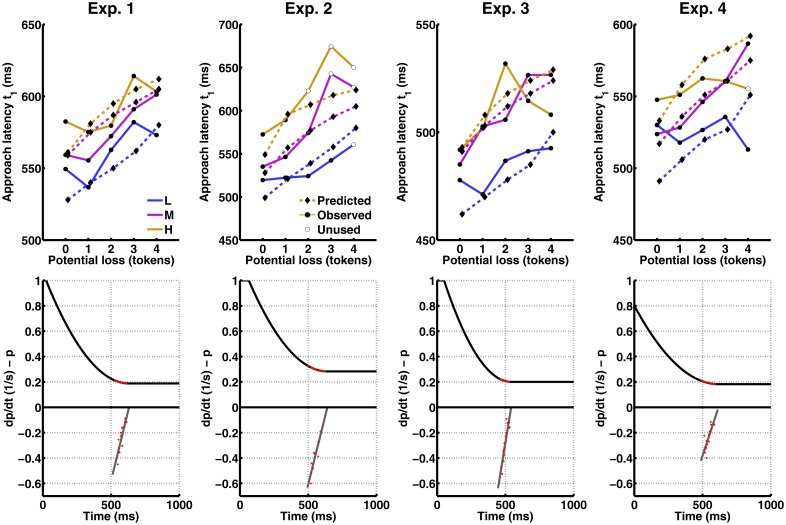
Behavioural inhibition is a key anxiety-like behaviour in rodents and humans, distinct from avoidance of danger, and reduced by anxiolytic drugs. In some situations, it is not clear how behavioural inhibition minimises harm or maximises benefit for the agent, and can even appear counterproductive. Extant explanations of this phenomenon make use of descriptive models but do not provide a formal assessment of its adaptive value. This hampers a better understanding of the neural computations underlying anxiety behaviour. Here, we analyse a standard rodent anxiety model, the operant conflict test. We harvest Bayesian Decision Theory to show that behavioural inhibition normatively arises as cost-minimising strategy in temporally correlated environments. Importantly, only if behavioural inhibition is aimed at minimising cost, it depends on probability and magnitude of threat. Harnessing a virtual computer game, we test model predictions in four experiments with human participants. Humans exhibit behavioural inhibition with a strong linear dependence on threat probability and magnitude. Strikingly, inhibition occurs before motor execution and depends on the virtual environment, thus likely resulting from a neural optimisation process rather than a pre-programmed mechanism. Individual trait anxiety scores predict behavioural inhibition, underlining the validity of this anxiety model. These findings put anxiety behaviour into the context of cost-minimisation and optimal inference, and may ultimately pave the way towards a mechanistic understanding of the neural computations gone awry in human anxiety disorder.


Conflict of interest statement

The author has declared that no competing interests exist.

Figures

Fig 1
Fig 1. Two scenarios for a rodent conflict test.
An animal is rewarded with food pellets for approaching a pellet dispenser, but there is a possibility of being punished by an electric shock. In scenario 1, the probability of threat is constant over time (red line) while the probability increases over time that the food pellet is withdrawn (green line). Expected utility, or negative expected loss, is maximal if the animal approaches the dispenser as quickly as biologically possible. In scenario 2, the threat probability is initially very high and decreases afterwards. This reflects naturally occurring temporal relations between predatory threat and reward. In this scenario, it is cost-minimising to move somewhat later (see Model and Methods for proofs, and S1 Text for the choice of parameters in these simulations).
Fig 2
Fig 2. Finding the approach latency that maximises expected utility.
First time derivatives of expected gain E(G) and negative expected loss −E(L). Under assumptions 7–8 (Model and Methods), the two curves must cross at least once, and that means there must be at least one stationary point. At least one of these stationary points is a maximiser. Crucially, the dotted line shows the impact of a small increase in L or a scaling of p(L). As one can see here, this will shift the optimal approach latency to the right, i. e. to later time points. The argument is formalised using Taylor series (see Model and Methods).
Fig 3
Fig 3. Human approach-avoidance conflict model.
A: In experiments 1, 2 and 4, a human player (green triangle) rests in a safe place on a 2×2 grid, opposite a “sleeping predator”(grey circle). On each epoch, 6 successive reward tokens appear on the remaining two grid blocks at random time points. Once they have appeared on the grid, the time until they disappear is exponentially distributed. The player can press a key (experiments 1–2) or move a joystick (experiment 4) to collect these tokens which accumulate over any given epoch. At any time during the game, the predator becomes active with constant probability, but once active it will only reveal itself if the player is currently outside the safe place. If the player is caught by the predator, it loses all tokens already collected in this epoch, and no more new tokens appear. Magnitude of potential loss therefore corresponds to the number of already collected tokens. Threat level, defined as the wake-up rate, is different for the three predators. This wake-up rate is signalled by different colours, and tailored to result in a wake-up probability of p = 0.1, p = 0.2, or p = 0.3 if the player stays outside the safe place for 100 ms. Participants played 270 epochs (experiment 2: 210 epochs), thus making up to 1620 choices. B: In experiment 3, the task statistics were the same as in experiment 1 but the graphical set up and cover story were entirely different. The player is required to move a virtual “lever”(grey bar at the bottom) to obtain tokens, which can be removed if “static interference” occurred during lever movement.
Fig 4
Fig 4. Results from experiments 1–4.
The figure shows responses to the possibility to collect the nth token after already having collected (n—1) tokens which constitutes the potential loss. L: low threat. M: medium threat. H: high threat. Action: Percentage of epochs in which the player chose to collect at least the nth token. One can see that on the first token, i. e. when there is no potential loss involved, players almost always approach. After collecting increasingly many tokens, approach choices are reduced, and they are also reduced by higher threat level, (i. e. probability of loss). Approach and return latencies: Because the players rarely approached after collecting 5 tokens, approach latency is only shown up to a potential loss of 4 tokens. As the data are unbalanced, mean approach latencies were estimated in a linear mixed effects model (see Model and Methods). Approach latencies are increased both by increasing potential loss (i. e. number of already collected tokens) and by increasing threat level (i. e. probability of loss). The reverse pattern is seen for return latencies.
Fig 5
Fig 5. Comparison of model predictions with observed approach latencies.
Upper panels: Predicted and observed approach latencies. Empty dots depict data points unused for the estimations (see Model and Methods). Lower panels: Reconstructed prior derivative (grey) and prior distribution (black). The prior derivative is scaled by the current catch rate and multiplied with current potential loss to derive the derivative of the expected loss (red curves in Fig 2). Red dots on the prior derivative depict data points used for the linear fit. Red dots on the prior depict range of predicted approach latencies.

References

    1. Gray JA, McNaughton N. The neuropsychology of anxiety: an enquiry into the functions of the septo-hippocampal system. vol. no. 33 2nd ed Oxford: Oxford University Press; 2000. Available from: http://www.loc.gov/catdir/enhancements/fy0639/2001280232-d.html.
    1. Adhikari A, Topiwala MA, Gordon JA. Synchronized activity between the ventral hippocampus and the medial prefrontal cortex during anxiety. Neuron. 2010. January;65(2):257–69. 10.1016/j.neuron.2009.12.002 - DOI - PMC - PubMed
    1. Likhtik E, Stujenske JM, Topiwala MA, Harris AZ, Gordon JA. Prefrontal entrainment of amygdala activity signals safety in learned fear and innate anxiety. Nat Neurosci. 2014. January;17(1):106–13. 10.1038/nn.3582 - DOI - PMC - PubMed
    1. Calhoon GG, Tye KM. Resolving the neural circuits of anxiety. Nat Neurosci. 2015. October;18(10):1394–404. 10.1038/nn.4101 - DOI - PMC - PubMed
    1. Montgomery KC. The relation between fear induced by novel stimulation and exploratory behavior. J Comp Physiol Psychol. 1955. August;48(4):254–60. 10.1037/h0043788 - DOI - PubMed