. 2016 May 15;33(10):917-28.
doi: 10.1089/neu.2015.4185. Epub 2016 Feb 11.

Serial Diffusion Tensor Imaging In Vivo Predicts Long-Term Functional Recovery and Histopathology in Rats following Different Severities of Spinal Cord Injury

Affiliations

Serial Diffusion Tensor Imaging In Vivo Predicts Long-Term Functional Recovery and Histopathology in Rats following Different Severities of Spinal Cord Injury

Samir P Patel et al. J Neurotrauma. .

Abstract

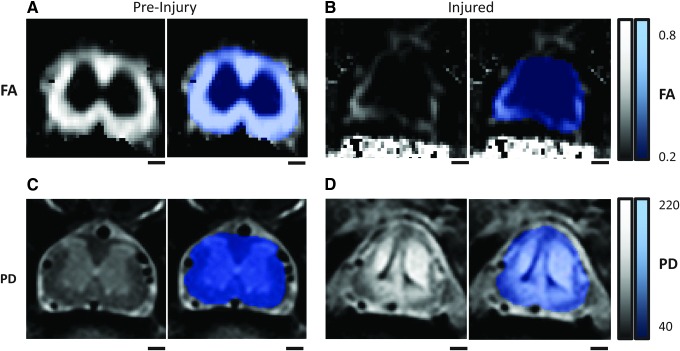
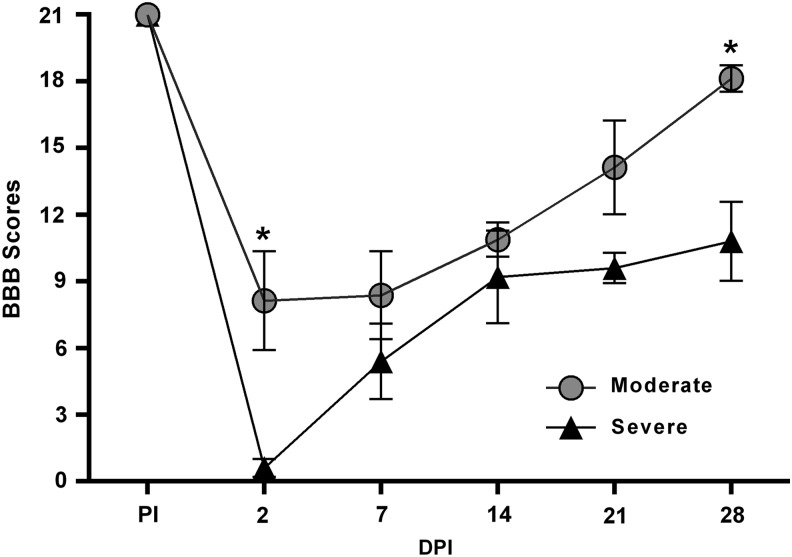
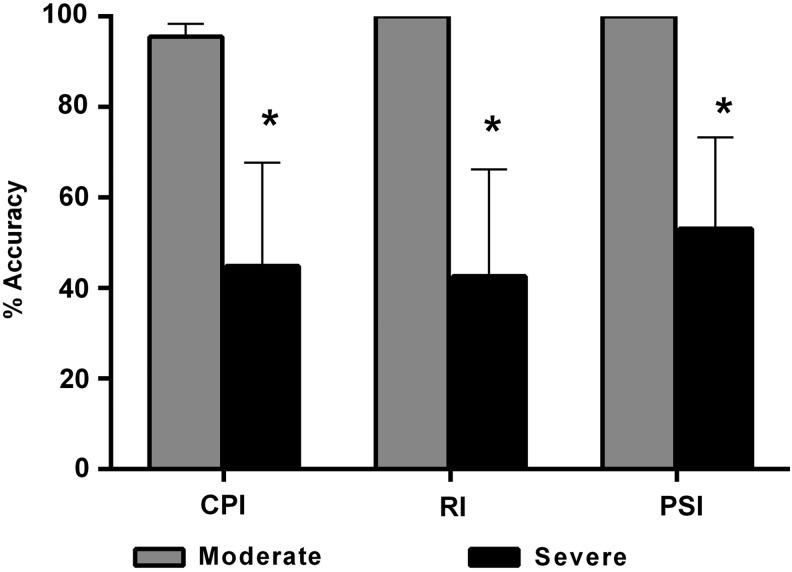
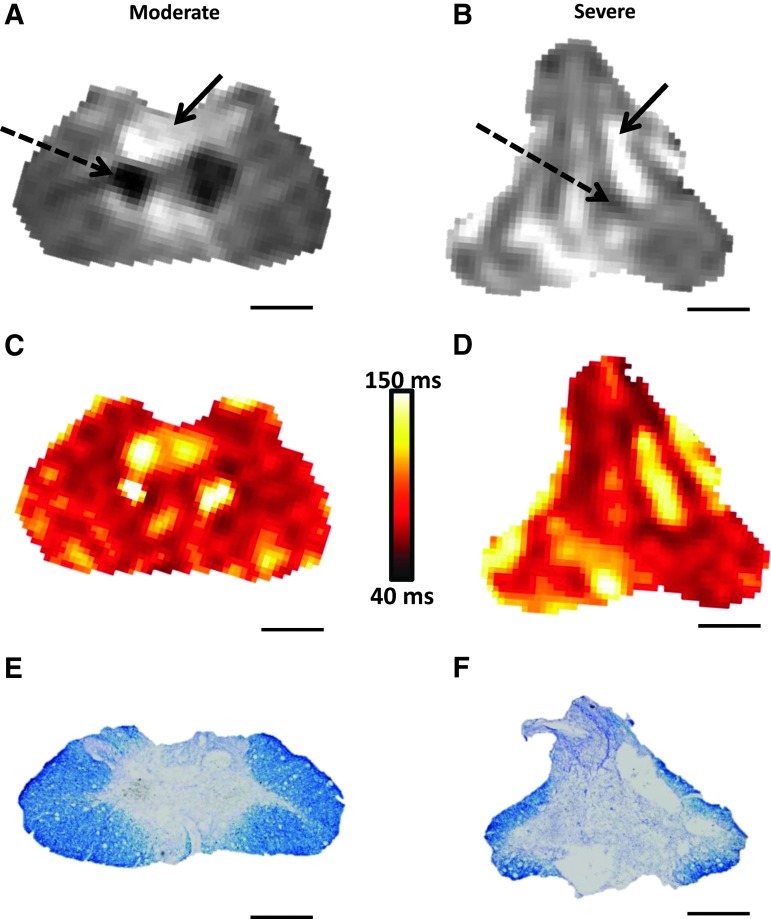
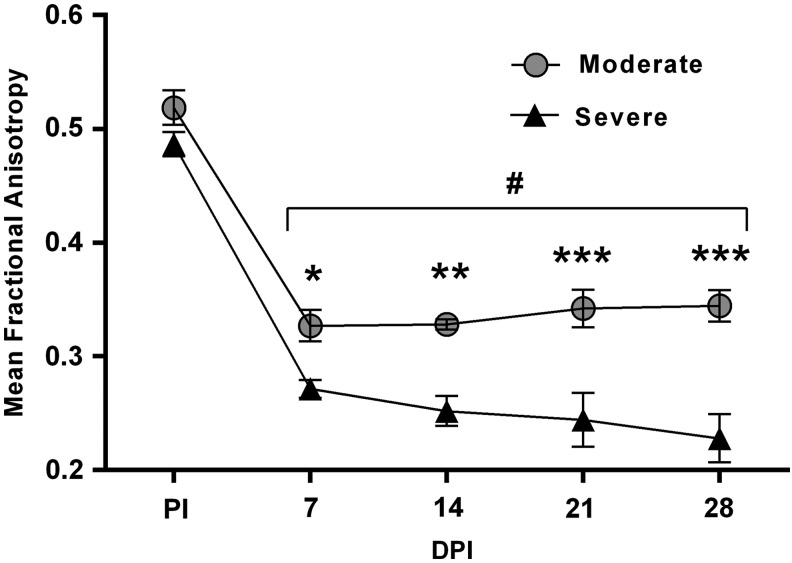
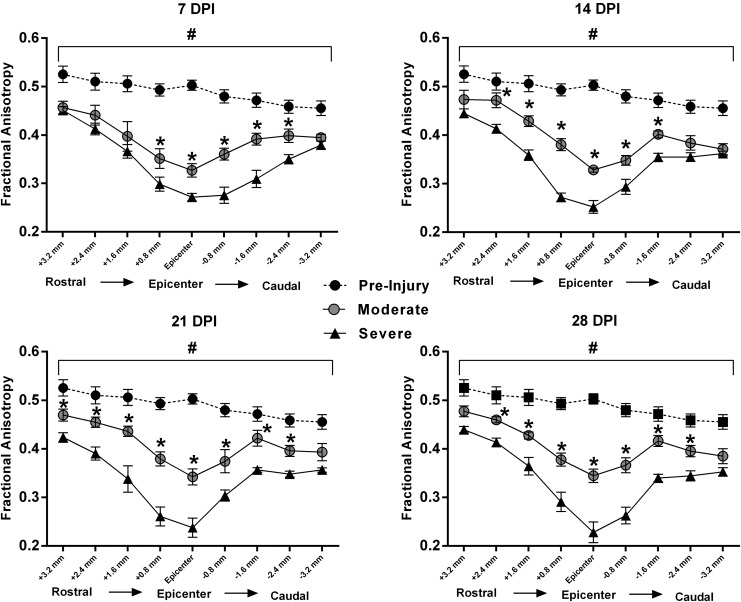
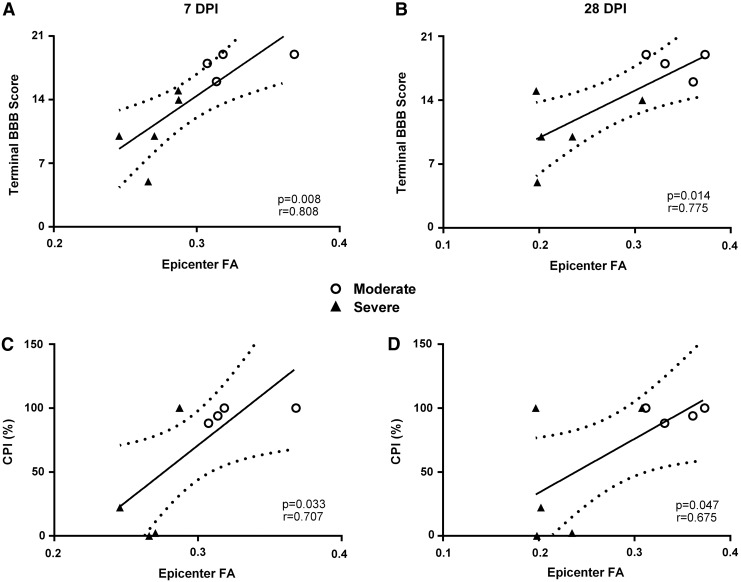
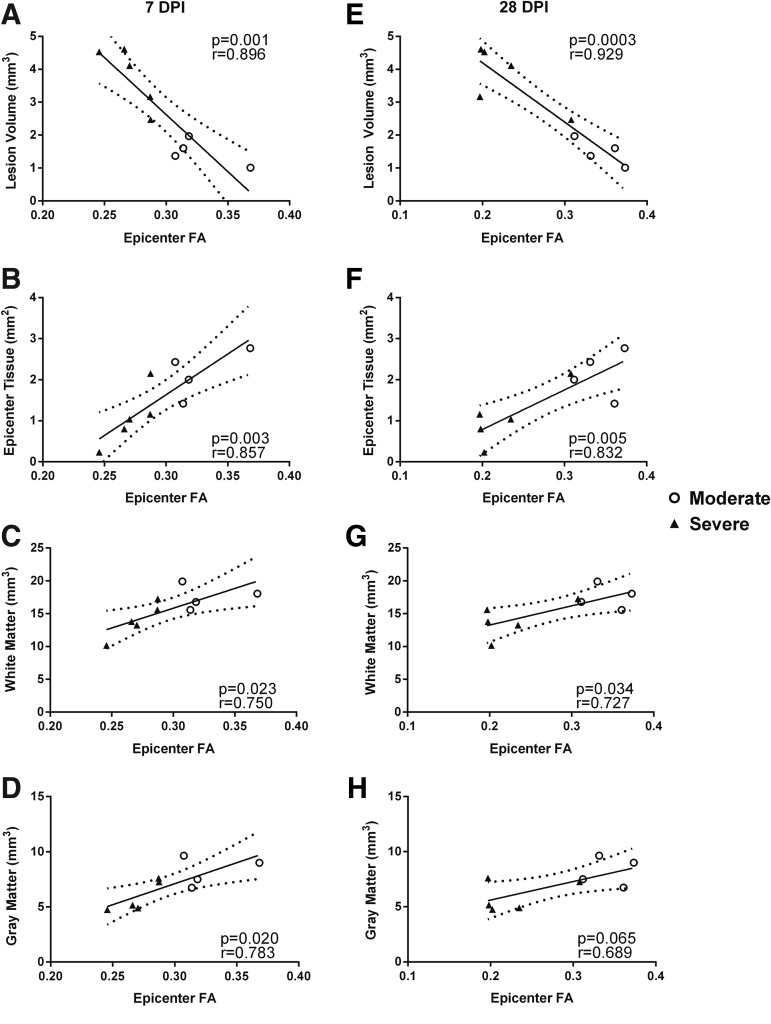
The current study demonstrates the feasibility of using serial magnetic resonance imaging (MRI) and diffusion tensor imaging (DTI) in vivo to quantify temporally spinal cord injury (SCI) pathology in adult female Sprague-Dawley rats that were scanned prior to a moderate or severe upper lumbar contusion SCI. Injured rats were behaviorally tested for hind limb locomotion (Basso, Beattie, Bresnahan [BBB] scores) weekly for 4 weeks and scanned immediately after each session, ending with terminal gait analyses prior to euthanasia. As a measure of tissue integrity, fractional anisotropy (FA) values were significantly lower throughout the spinal cord in both injury cohorts at all time-points examined versus pre-injury. Moreover, FA values were significantly lower following severe versus moderate SCI at all time-points, and FA values at the injury epicenters at all time-points were significantly correlated with both spared white and gray matter volumes, as well as lesion volumes. Critically, quantified FA values at subacute (24 h) and all subsequent time-points were highly predictive of terminal behavior, reflected in significant correlations with both weekly BBB scores and terminal gait parameters. Critically, the finding that clinically relevant subacute (24 h) FA values accurately predict long-term functional recovery may obviate long-term studies to assess the efficacy of therapeutics tested experimentally or clinically. In summary, this study demonstrates a reproducible serial MRI procedure to predict the long-term impact of contusion SCI on both behavior and histopathology using subacute DTI metrics obtained in vivo to accurately predict multiple terminal outcome measures, which can be particularly valuable when comparing experimental interventions.

Keywords: BBB; anisotropy; contusion; gait analysis; magnetic resonance imaging (MRI); neuroimaging; white matter.


Figures

<b>FIG. 1.</b>
FIG. 1.
Fractional anisotropy (FA; A and B) and complementary proton density (PD; C and D) images for a single rat captured pre-injury (A, C) and at 28 days post-injury (B,D) at the same L1/L2 spinal level, with associated spinal masks (blue). The spinal cord masks (blue) are applied after image acquisition to specifically analyze only spinal tissue and not surrounding tissues. Lighter color for FA is indicative of more anisotropic flow, whereas brighter color in the PD is indicative of higher proton concentration. Scale bars = 500 μm. Color image is available online at www.liebertpub.com/neu
<b>FIG. 2.</b>
FIG. 2.
Loss and recovery of hind limb function following moderate and severe contusion spinal cord injury (SCI). Graphic representation of the mean behavioral (Basso, Beattie, Bresnahan [BBB]) scores pre-injury (PI) and at 2, 7, 14, 21, and 28 days post-injury (DPI). At 2 DPI, rats with moderate SCI had only partial paralysis with prominent hind limb movements, compared with complete paralysis seen in rats with severe SCI. Rats with moderate SCI further showed significantly improved recovery of hind limb locomotion over time, compared with severe SCI. Symbols represent group means ± standard error of the mean, n = 4–5/group. *p < 0.005, compared with severe SCI.
<b>FIG. 3.</b>
FIG. 3.
Terminal gait analyses at 28 days following moderate or severe contusion spinal cord injury (SCI). Comparisons of Coordinated Pattern Index (CPI), Regularity Index (RI) and Plantar Stepping Index (PSI). Rats in the severe SCI group showed significantly lower % CPI, % RI and % PSI at 28 DPI, compared with moderate SCI. Bars represent group means ± standard error of the mean, n = 4-5/group. *p < 0.05, compared with moderate SCI.
<b>FIG. 4.</b>
FIG. 4.
Photomicrographs of representative proton density images 28 days after moderate and severe spinal cord injury (SCI; A, B) along with corresponding maps of T2 relaxation times in vivo (C, D) and histological (eriochrome cyanine–stained) sections in situ (E, F). Note that dashed arrows indicate regions with little tissue density while solid arrows indicate high intensity regions indicative of fluid filled lesion cavities. Scale bars = 500 μm. Color image is available online at www.liebertpub.com/neu
<b>FIG. 5.</b>
FIG. 5.
Graphical representation of in-vivo magnetic resonance imaging–derived cross-sectional subvolumes throughout the spinal cord at 28 days post-contusion spinal cord injury (SCI), compared with pre-injury volume. Compared with pre-injury volumes, severe SCI resulted in significantly decreased subvolumes extending from 2.8 mm rostral to 2.1 mm caudal to the injury epicenter, whereas moderate SCI resulted in significantly decreased subvolumes extending only from 0.7 mm rostral to 1.4 mm caudal to the injury epicenter. *p < 0.05 severe SCI, compared with pre-injury. #p < 0.05 moderate SCI, compared with pre-injury.
<b>FIG. 6.</b>
FIG. 6.
(A) Graphical illustration of total T2 lesion volumes comprising 8.8 mm of spinal cord analyzed for each rat in both injury cohorts beginning at 7 and continuing to 28 days post-injury (DPI). There were no significant group differences and no significant changes within groups over time. (B) Depiction of T2 lesion subvolumes throughout the cord for both injury cohorts at 28 DPI. Symbols represent group means ± standard error of the mean. PI, pre-injury; epi, epicenter.
<b>FIG. 7.</b>
FIG. 7.
(A) Lesion volume was significantly greater in the severe spinal cord injury (SCI) cohort. (B) Throughout the rostro-caudal extent of the injured spinal cords, differences in lesion subvolumes were greatest at the injury epicenters (Epi) and significantly higher in the moderate SCI cohort, compared with the severe SCI cohort (C). Spared gray matter and white matter volumes throughout the injured spinal tissues were significantly higher after moderate, compared with severe SCI (D). Bars/symbols represent group means ± standard error of the mean, n = 4-5/group. *p < 0.05; **p < 0.01, compared with severe SCI.
<b>FIG. 8.</b>
FIG. 8.
Comparison of mean fractional anisotropy (FA) at the injury epicenter (L1/L2 spinal levels) in moderate versus severe spinal cord injury (SCI) prior to injury (PI) and at 7, 14, 21, and 28 days post-injury (DPI). Severe SCI significantly decreased FA, compared with moderate SCI at all time-points assessed, starting as early as 7 DPI. Symbols represent group means ± standard error of the mean. #p < 0.0001, compared with PI; *p < 0.05, **p < 0.005, ***p < 0.0001, compared with severe SCI.
<b>FIG. 9.</b>
FIG. 9.
Graphical representations of average cross-sectional fractional anisotropy (FA) values of nine evenly-spaced DTI slices (0.8 mm thick) centered at the injury epicenter. Compared with pre-injury FA values, both injury severity cohorts had significantly lower FA at all spinal levels, at all four time-points. At 7 days post-injury (DPI), there was an initial separation between moderate and severe SCI groups more prominent caudal to the injury epicenter. At 14, 21, and 28 DPI, FA values were significantly lower for all the adjacent slices in the severe SCI group, compared with the moderate SCI group, excluding the farthest rostrocaudal slices. Symbols represent group means ± standard error of the mean, n = 9 for pre-injury and n = 4-5/group for moderate and severe. #p < 0.05, compared with both moderate and severe SCI; *p < 0.05, compared with severe SCI.
<b>FIG. 10.</b>
FIG. 10.
Correlations between fractional anisotropy (FA) at the injury epicenters and behavioral metrics over days post-injury (DPI). At both 7 and 28 DPI, FA values were significantly correlated with terminal Basso, Beattie, Bresnahan (BBB) scores (A, B) and % Coordinated Pattern Index (CPI; C, D). Open circles represent rats with moderate SCI and black triangles represent those with severe SCI. Solid line represents line of best fit; dotted lines represent 95% confidence interval.
<b>FIG. 11.</b>
FIG. 11.
Correlation analyses of fractional anisotropy (FA) at the injury epicenters at 7 and 28 days post-injury (DPI) with various histological measurements. FA at 7 DPI was significantly correlated with terminal histology in terms of lesion volume (A), epicenter tissue sparing (B), white matter volume (C) and gray matter volume (D). FA at 28 DPI was also significantly correlated with each of these same metrics, except for gray matter volume (E-H). Open circles represent rats with moderate spinal cord injury (SCI) and black triangles represent those with severe SCI. Solid line represents line of best fit; dotted lines represent 95% confidence interval.

Similar articles

Cited by

References

    1. Kirshblum S.C., Waring W., Biering-Sorensen F., Burns S.P., Johansen M., Schmidt-Read M., Donovan W., Graves D., Jha A., Jones L., Mulcahey M.J., and Krassioukov A. (2011). Reference for the 2011 revision of the International Standards for Neurological Classification of Spinal Cord Injury. J. Spinal Cord Med. 34, 547–554 - PMC - PubMed
    1. Ditunno J.F., Little J.W., Tessler A., and Burns A.S. (2004). Spinal shock revisited: a four-phase model. Spinal Cord 42, 383–395 - PubMed
    1. Nishi R.A., Liu H., Chu Y., Hamamura M., Su M.Y., Nalcioglu O., and Anderson A.J. (2007). Behavioral, histological, and ex vivo magnetic resonance imaging assessment of graded contusion spinal cord injury in mice. J. Neurotrauma 24, 674–689 - PubMed
    1. Simard J.M., Popovich P.G., Tsymbalyuk O., Caridi J., Gullapalli R.P., Kilbourne M.J., and Gerzanich V. (2013). MRI evidence that glibenclamide reduces acute lesion expansion in a rat model of spinal cord injury. Spinal Cord 51, 823–827 - PMC - PubMed
    1. Spanevello M.D., Tajouri S.I., Mirciov C., Kurniawan N., Pearse M.J., Fabri L.J., Owczarek C.M., Hardy M.P., Bradford R.A., Ramunno M.L., Turnley A.M., Ruitenberg M.J., Boyd A.W., and Bartlett P.F. (2013). Acute delivery of EphA4-Fc improves functional recovery after contusive spinal cord injury in rats. J. Neurotrauma 30, 1023–1034 - PMC - PubMed

Publication types

MeSH terms