

Influences of Nutrition Supply and Pathways on the Degenerative Patterns in Human Intervertebral Disc
- PMID: 26650874
- PMCID: PMC4808448
- DOI: 10.1097/BRS.0000000000001292
Influences of Nutrition Supply and Pathways on the Degenerative Patterns in Human Intervertebral Disc
Abstract
Study design: Investigation of the effects of the impairment of different nutritional pathways on the intervertebral disc degeneration patterns in terms of spatial distributions of cell density, glycosaminoglycan content, and water content.
Objective: The aim of this study was to test the hypothesis that impairment of different nutritional pathways would result in different degenerative patterns in human discs.
Summary of background data: Impairment of nutritional pathways has been found to affect cell viability in the disc. However, details on how impairment of different nutritional pathways affects the disc degeneration patterns are unknown.
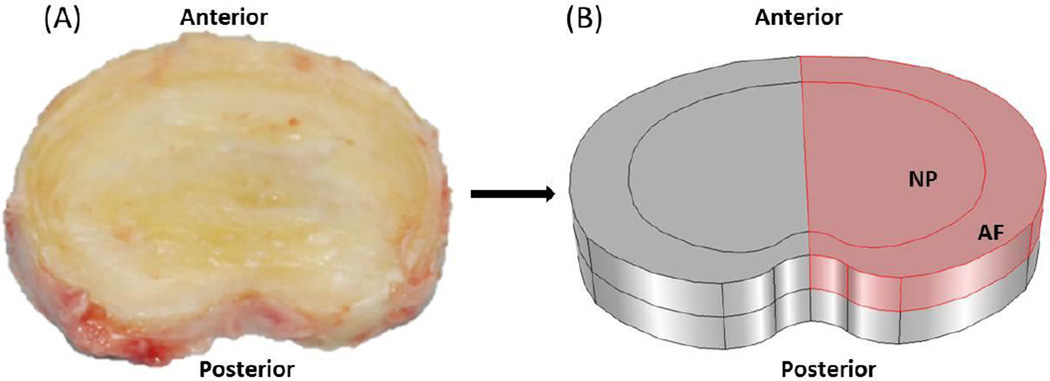
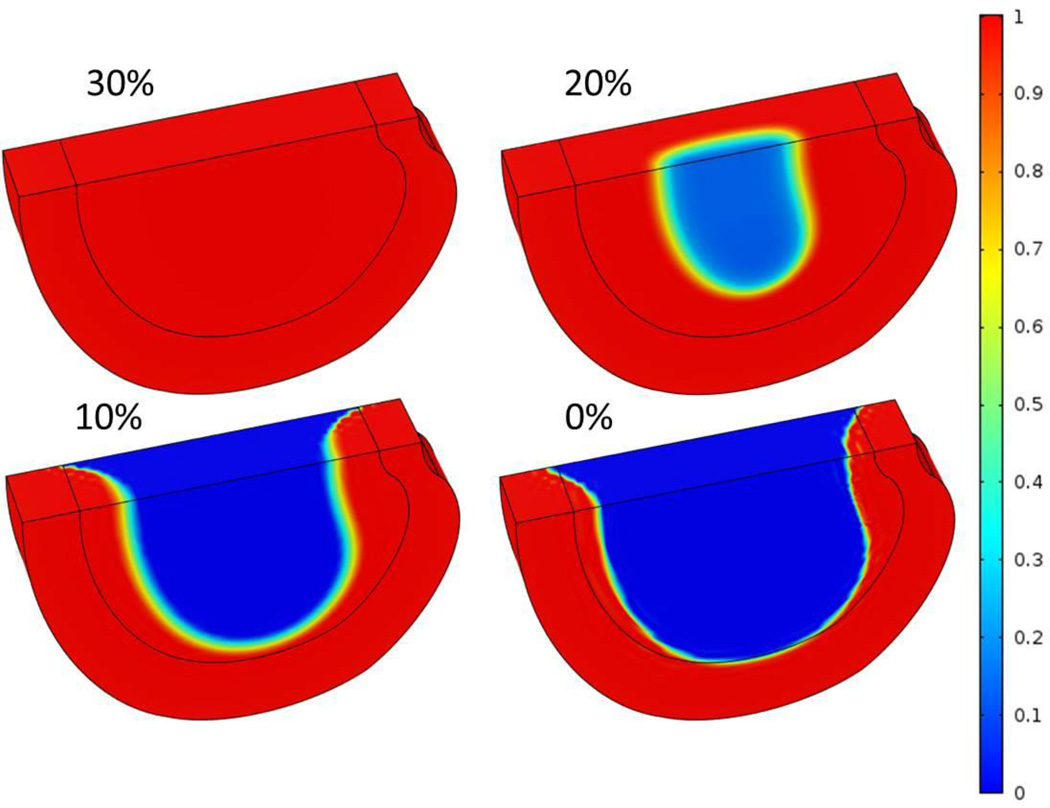
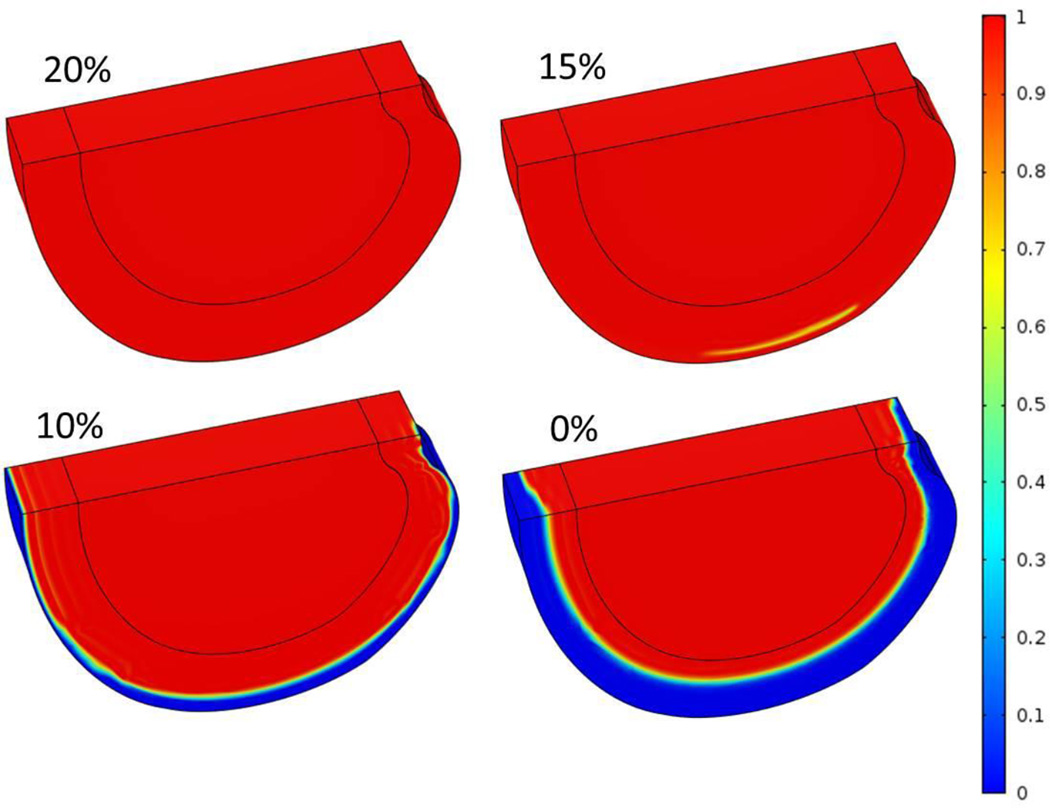
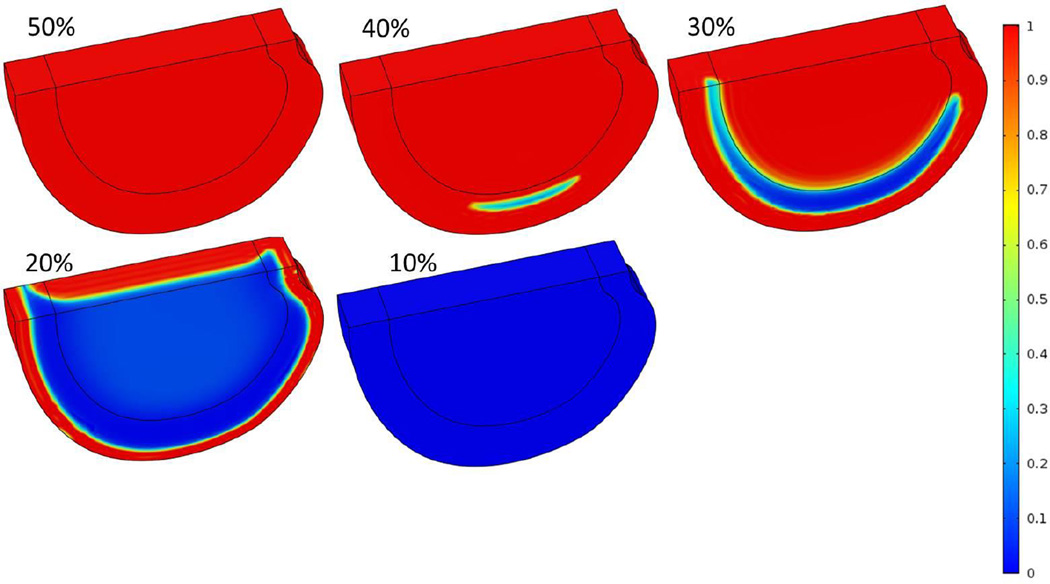
Methods: A 3D finite element model was used for this study. This finite element method was based on the cell-activity coupled mechano-electrochemical theory for cartilaginous tissues. Impairment of the nutritional pathways was simulated by lowering the nutrition level at the disc boundaries. Effects of the impartment of cartilaginous endplate-nucleus pulposus (CEP-NP) pathway only (Case 1), annulus fibrosus (AF) pathway only (Case 2), and both pathways (Case 3) on disc degeneration patterns were studied.
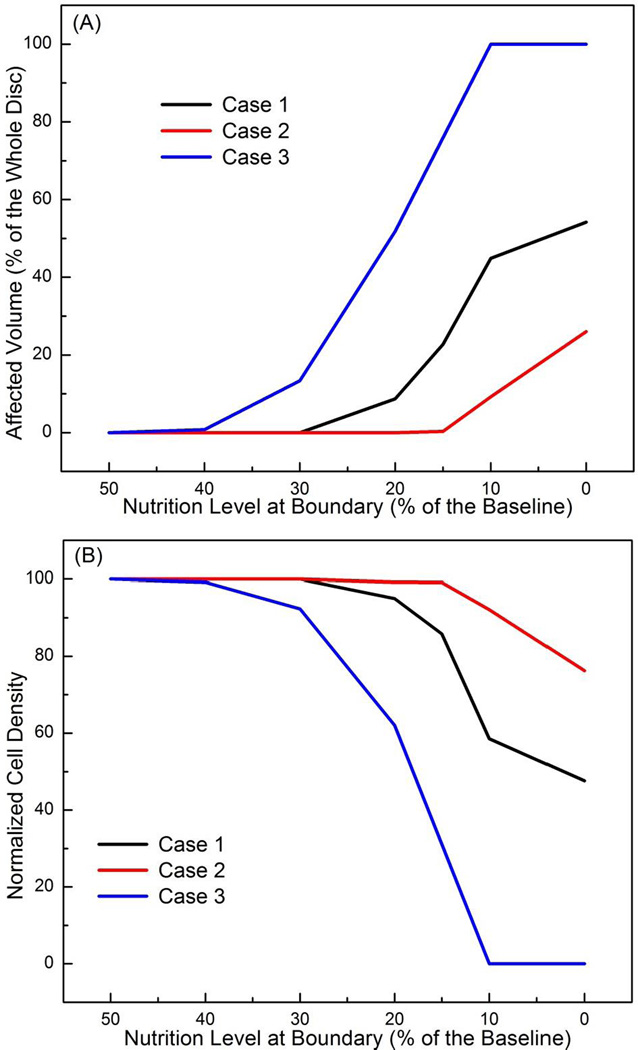
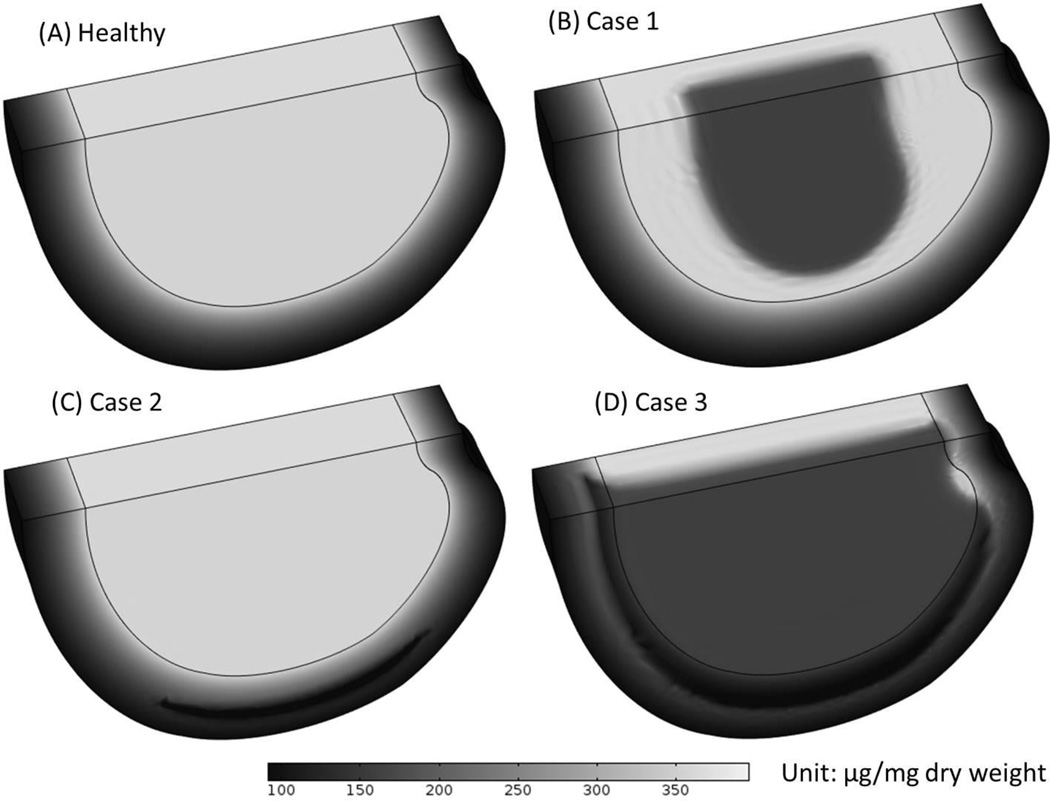
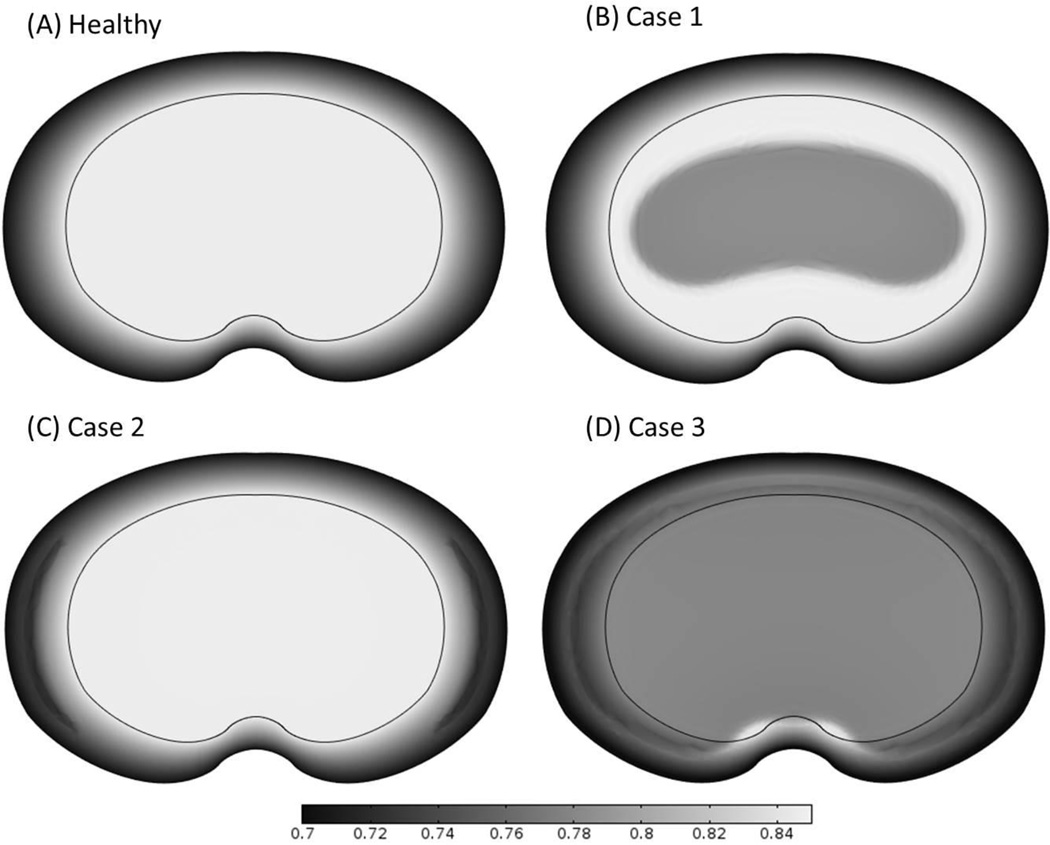
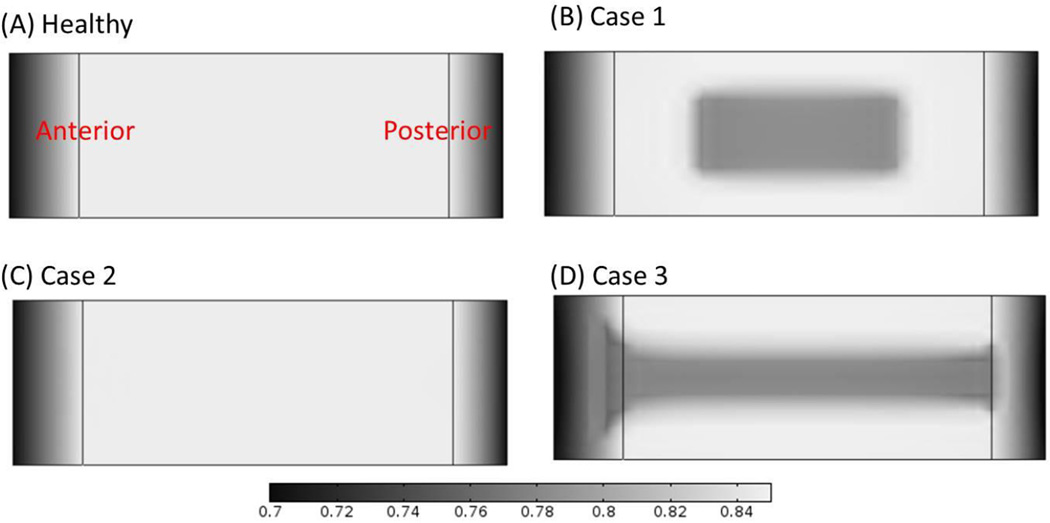
Results: The predicted critical levels of nutrition for Case 1, Case 2, and Case 3 were around 30%, 20%, and 50% of the reference values, respectively. Below this critical level, the disc degeneration would occur. Disc degeneration appeared mainly in the NP for Case 1, in the outer AF for Case 2, and in both the NP and inner to middle AF for Case 3. For Cases 1 and 3, the loss of water content was primarily located in the mid-axial plane, which is consistent with the horizontal gray band seen in some T2-weighted magnetic resonance imaging (MRI). For the disc geometry used in this study, it was predicted that there existed a high-intensity zone (for Case 3), as seen in some T2-weighted MRI images.
Conclusion: Impairment of different nutrition pathways results in different degenerative patterns.
Level of evidence: N/A.
Figures
References
-
- Luoma K, Riihimaki H, Luukkonen R, et al. Low back pain in relation to lumbar disc degeneration. Spine. 2000;25:487–492. - PubMed
-
- Urban JP, Smith S, Fairbank JC. Nutrition of the intervertebral disc. Spine. 2004;29:2700–2709. - PubMed
-
- Horner HA, Urban JPG. 2001 Volvo Award winner in basic science studies: Effect of nutrient supply on the viability of cells from the nucleus pulposus of the intervertebral disc. Spine (Phila Pa 1976) 2001;26:2543–2549. - PubMed
-
- Urban J, Holm S, Maroudas A. Diffusion of small solutes into the intervertebral disc: as in vivo study. Biorheology. 1978;15:203–221. - PubMed
-
- Nachemson A, Lewin T, Maroudas A, et al. In vitro diffusion of dye through the end-plates and the annulus fibrosus of human lumbar inter-vertebral discs. Acta orthop. Scandinav. 1970;41:8. - PubMed
Publication types
MeSH terms
Grants and funding
LinkOut - more resources
Full Text Sources
Other Literature Sources
Medical
Research Materials
Miscellaneous
