. 2016 Mar;22(3):221-49.
doi: 10.1089/ten.TEC.2015.0375. Epub 2016 Jan 21.

Analytic Models of Oxygen and Nutrient Diffusion, Metabolism Dynamics, and Architecture Optimization in Three-Dimensional Tissue Constructs with Applications and Insights in Cerebral Organoids

Affiliations

Analytic Models of Oxygen and Nutrient Diffusion, Metabolism Dynamics, and Architecture Optimization in Three-Dimensional Tissue Constructs with Applications and Insights in Cerebral Organoids

Richard J McMurtrey. Tissue Eng Part C Methods. 2016 Mar.

Abstract

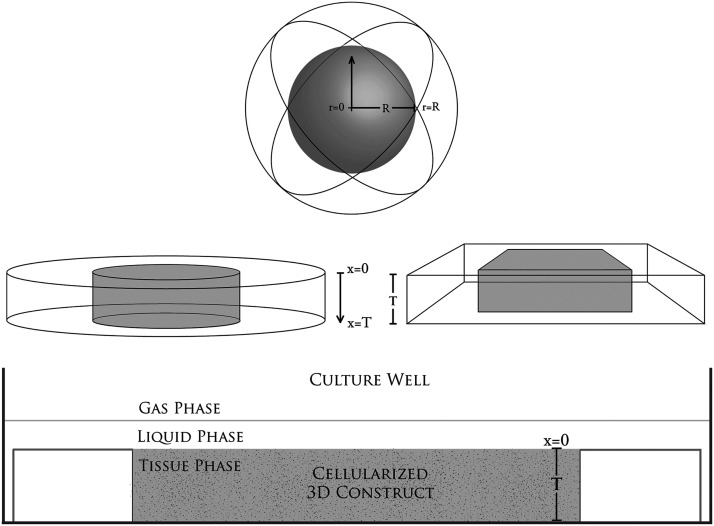
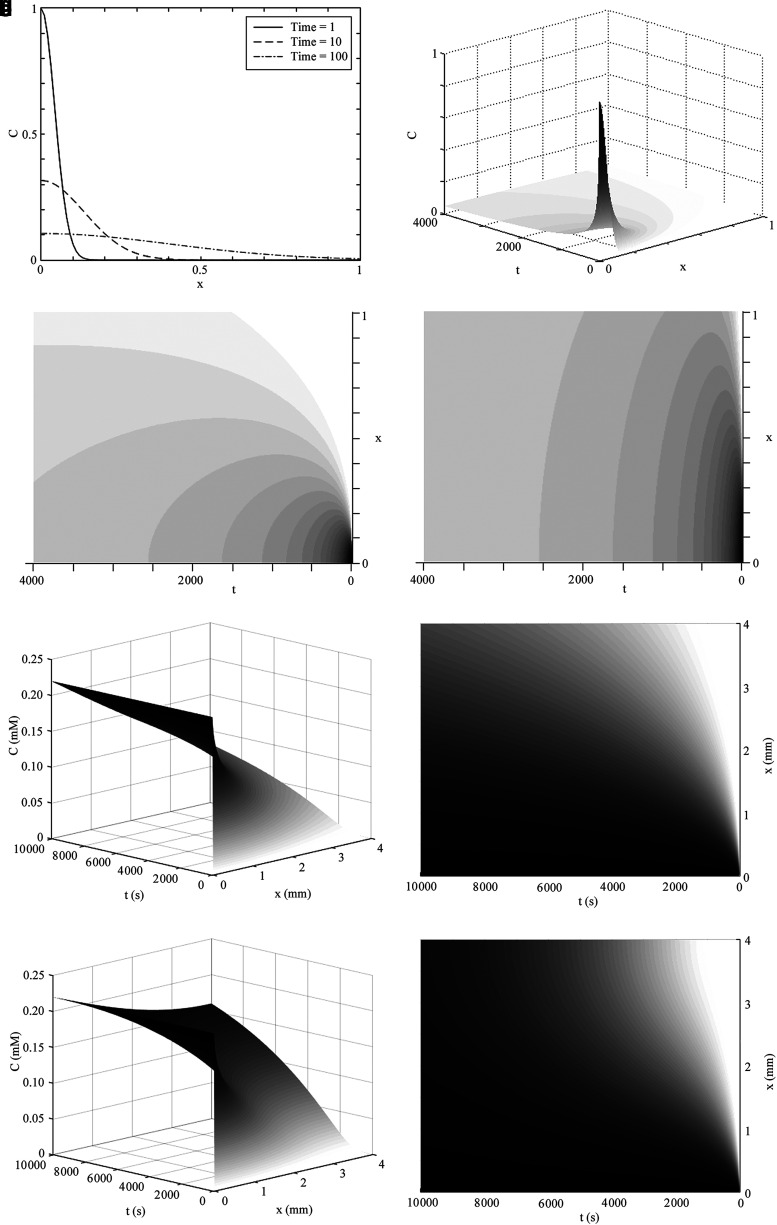
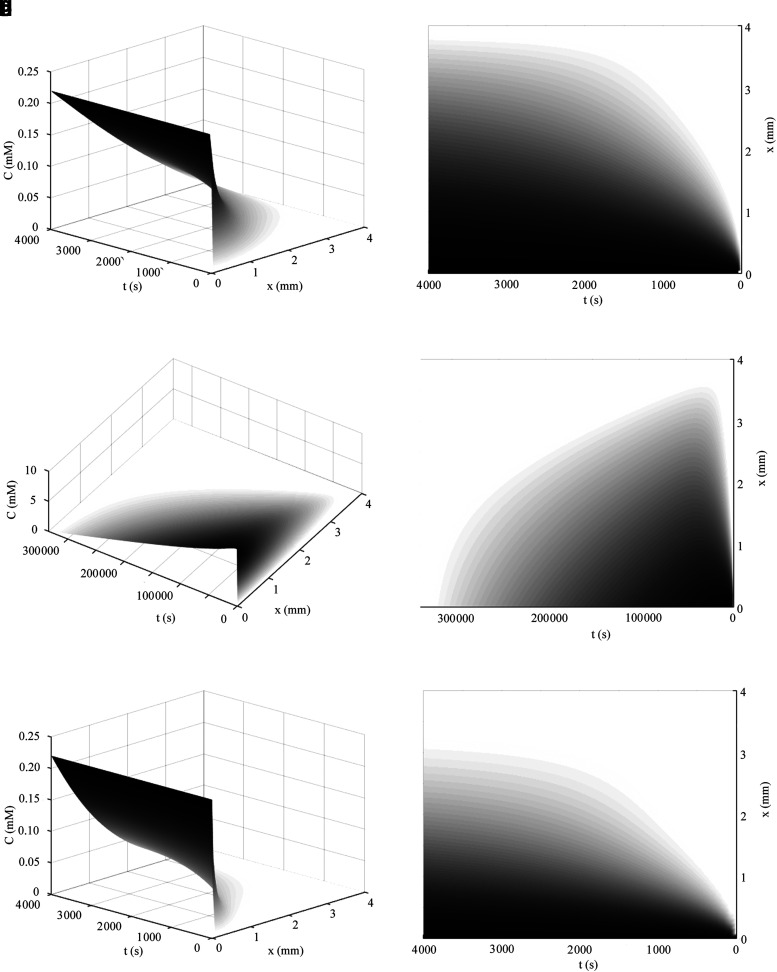
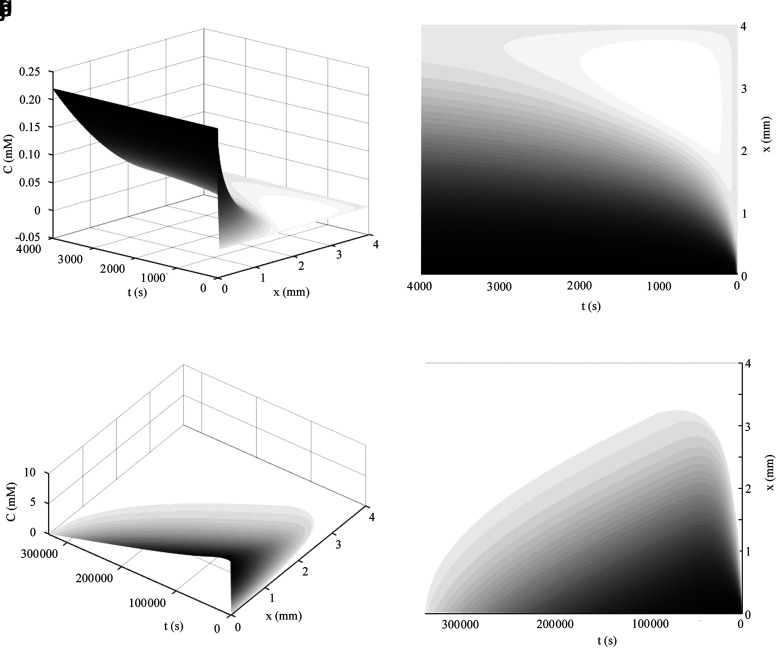
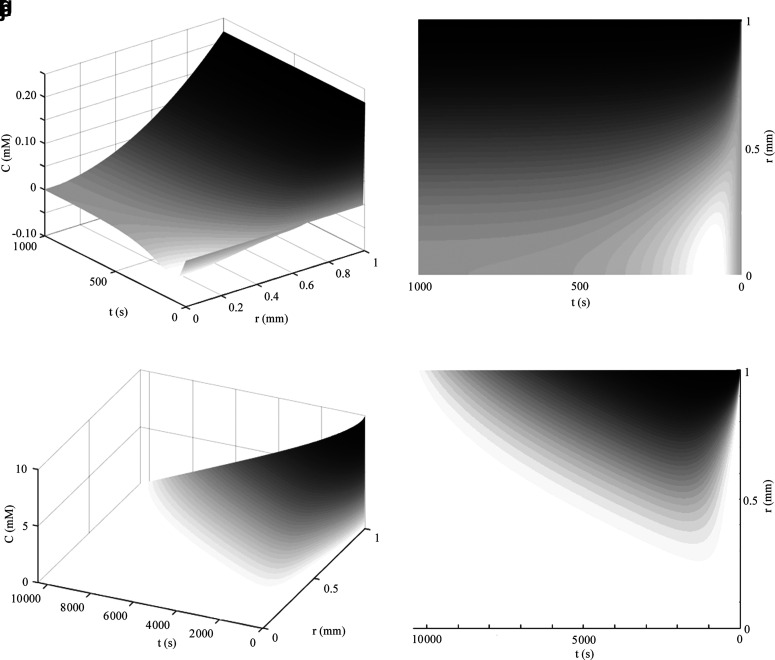
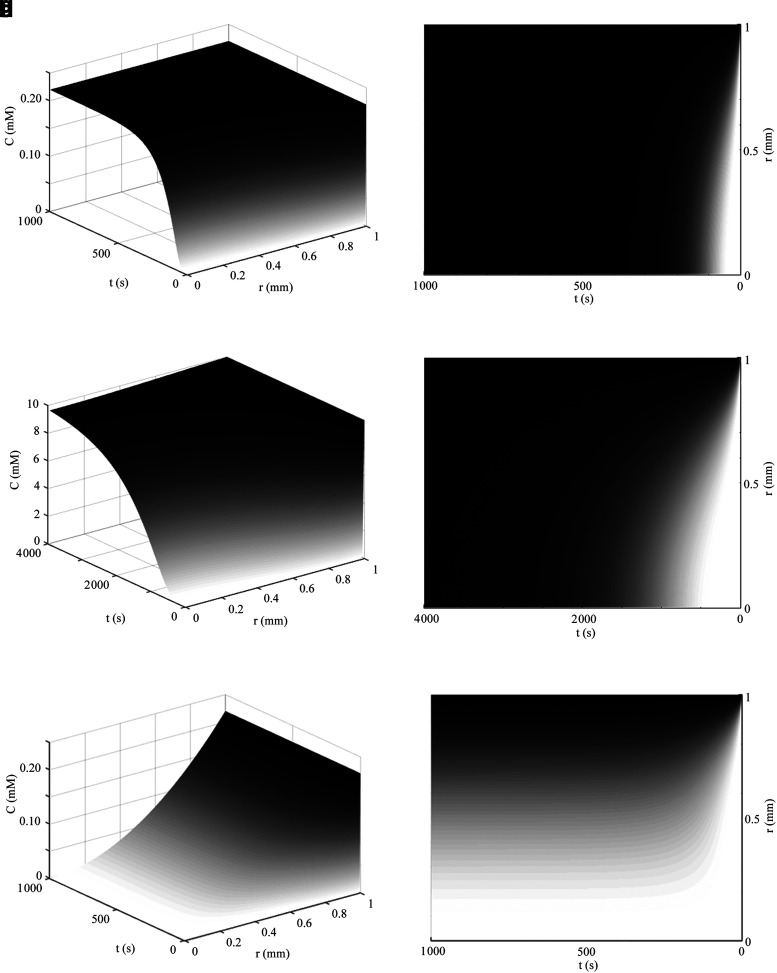
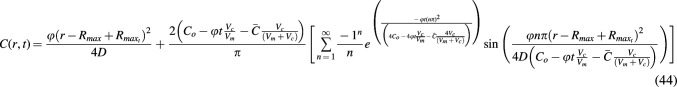
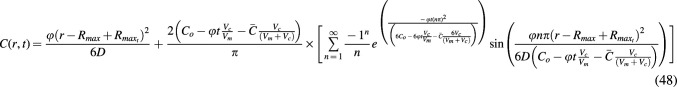
Diffusion models are important in tissue engineering as they enable an understanding of gas, nutrient, and signaling molecule delivery to cells in cell cultures and tissue constructs. As three-dimensional (3D) tissue constructs become larger, more intricate, and more clinically applicable, it will be essential to understand internal dynamics and signaling molecule concentrations throughout the tissue and whether cells are receiving appropriate nutrient delivery. Diffusion characteristics present a significant limitation in many engineered tissues, particularly for avascular tissues and for cells whose viability, differentiation, or function are affected by concentrations of oxygen and nutrients. This article seeks to provide novel analytic solutions for certain cases of steady-state and nonsteady-state diffusion and metabolism in basic 3D construct designs (planar, cylindrical, and spherical forms), solutions that would otherwise require mathematical approximations achieved through numerical methods. This model is applied to cerebral organoids, where it is shown that limitations in diffusion and organoid size can be partially overcome by localizing metabolically active cells to an outer layer in a sphere, a regionalization process that is known to occur through neuroglial precursor migration both in organoids and in early brain development. The given prototypical solutions include a review of metabolic information for many cell types and can be broadly applied to many forms of tissue constructs. This work enables researchers to model oxygen and nutrient delivery to cells, predict cell viability, study dynamics of mass transport in 3D tissue constructs, design constructs with improved diffusion capabilities, and accurately control molecular concentrations in tissue constructs that may be used in studying models of development and disease or for conditioning cells to enhance survival after insults like ischemia or implantation into the body, thereby providing a framework for better understanding and exploring the characteristics and behaviors of engineered tissue constructs.


Figures

FIG. 1.
FIG. 1.
Views of three-dimensional (3D) tissue constructs in a culture well. The thickness of the planar construct is T and the diameter of the sphere is 2R.
FIG. 2.
FIG. 2.
Comparison of metabolic steady-state profiles of oxygen for thickness (T) or radius (R) in mm in 1D, 2D, and 3D models, each with identical values for φ, D, and Co (with an inverted spatial axis for the radial cases for comparison).
FIG. 3.
FIG. 3.
Concentration profiles in a semi-infinite domain of constant diffusivity as a function of distance x (depth through hydrogel in mm) and time t (in seconds). Having assumed a finite amount of diffusant (like glucose in a culture well, where D = 10−10 m2/s, with Co set at unity) in an infinite domain, (a) shows the general case of how concentration changes as a function of distance in the semi-infinite domain, with time shown as sequential curves. (b) The general case of concentration of a finite nutrient diffusing in space and time, as described by Eq. 21, and as with all 3D graphs herein, depth is shown on the rightward axis and time on the leftward axis. The concentration intensity profile from (b) is shown as a contour plot in distance and time for either (c) D = 10−10 m2/s or (d) D = 10−9 m2/s, all other parameters being equal. Time is shown until 4000 s in (b–d). (e, f) The condition where, rather than finite diffusant, external Co remains constant (like ambient oxygen), as described in the semi-infinite domain of Eq. 18. (g, h) Diffusion and concentration profile in a 4-mm-thick finite construct with unlimited supply of oxygen as described in Eq. 22. (e–h) D = 10−9 m2/s, Co = 0.22 mM, and time is shown until 10,000 s.
FIG. 4.
FIG. 4.
(a, b) Concentration profiles for oxygen in culture media using the constrained solution for unlimited nutrient (Eq. 29) over a construct's spatial domain: Co = 0.22 mM, D = 10−9 m2/s, Tmax = 4 mm, and time shown from 0 to 4000 s. The view of all axes is shown in (a) and the concentration intensity profile in time and distance (horizontal and vertical axes, respectively) is shown in (b). In (c, d) the concentration profile of glucose from the solution in Eq. 36 is shown using Co = 10 mM, D = 10−10 m2/s, and formula image for Tmax = 4 mm, until total consumption at t = 3.33 × 105 s at x = 0 with a media volume five times that of the construct volume. Under these conditions, the ramp up in concentration due to diffusion occurs much more quickly than the consumption of nutrient. In (e), the transient ramp up in oxygen concentration within the construct is shown for the first 4000 s as it approaches parabolic quasi-steady state, as described by the solution in Eq. 37 using Co = 0.22 mM, D = 10−9 m2/s, formula image, and Tmax = 4 mm. The concentration profile of oxygen in the construct over time is shown in (f). The numerical solution with the same conditions as (e, f) is shown in (g, h), as explained in the text. The concentration profile of glucose in the construct from the metabolic solution in Eq. 38 is shown in (i, j) over the valid domain of x = 0 to Tmax and until total consumption at 3.3 × 105 s using Co = 10 mM, D = 10−10 m2/s, formula image, and Tmax = 4 mm, with a media volume five times that of the construct volume.
FIG. 4.
FIG. 4.
(a, b) Concentration profiles for oxygen in culture media using the constrained solution for unlimited nutrient (Eq. 29) over a construct's spatial domain: Co = 0.22 mM, D = 10−9 m2/s, Tmax = 4 mm, and time shown from 0 to 4000 s. The view of all axes is shown in (a) and the concentration intensity profile in time and distance (horizontal and vertical axes, respectively) is shown in (b). In (c, d) the concentration profile of glucose from the solution in Eq. 36 is shown using Co = 10 mM, D = 10−10 m2/s, and formula image for Tmax = 4 mm, until total consumption at t = 3.33 × 105 s at x = 0 with a media volume five times that of the construct volume. Under these conditions, the ramp up in concentration due to diffusion occurs much more quickly than the consumption of nutrient. In (e), the transient ramp up in oxygen concentration within the construct is shown for the first 4000 s as it approaches parabolic quasi-steady state, as described by the solution in Eq. 37 using Co = 0.22 mM, D = 10−9 m2/s, formula image, and Tmax = 4 mm. The concentration profile of oxygen in the construct over time is shown in (f). The numerical solution with the same conditions as (e, f) is shown in (g, h), as explained in the text. The concentration profile of glucose in the construct from the metabolic solution in Eq. 38 is shown in (i, j) over the valid domain of x = 0 to Tmax and until total consumption at 3.3 × 105 s using Co = 10 mM, D = 10−10 m2/s, formula image, and Tmax = 4 mm, with a media volume five times that of the construct volume.
FIG. 5.
FIG. 5.
(a–d) Cylindrical diffusion profiles from Eq. 40 along the radial axis through time assuming no metabolism. The Bessel function solutions are shown in a cylindrical construct of 1 mm radius for the case of unlimited oxygen diffusion (a, b) and glucose diffusion (c, d); parameters for oxygen were Co = 0.22 mM and D = 10−9 m2/s with time shown until 1000 s and for glucose were Co = 10 mM and D = 10−10 m2/s. Cylindrical diffusion profiles of oxygen diffusion in a construct with a maximized diameter of 2 mm from Eq. 43 are shown in (e, f); parameters were Co = 0.22 mM, formula image, and D = 10−9 m2/s. The numerical solution with the same conditions as (e, f) is shown in (g, h), as explained in the text. Cylindrical diffusion profiles of limited nutrient (glucose) consumed in a construct with a maximized diameter of 2 mm described by Eq. 44 over the valid domain of r = 0 to Rmax and until Co reaches zero in media are shown in (i, j) assuming the media volume is only five times more than the cylindrical construct volume, with standard glucose parameters of Co = 10 mM, formula image, and D = 10−10 m2/s.
FIG. 5.
FIG. 5.
(a–d) Cylindrical diffusion profiles from Eq. 40 along the radial axis through time assuming no metabolism. The Bessel function solutions are shown in a cylindrical construct of 1 mm radius for the case of unlimited oxygen diffusion (a, b) and glucose diffusion (c, d); parameters for oxygen were Co = 0.22 mM and D = 10−9 m2/s with time shown until 1000 s and for glucose were Co = 10 mM and D = 10−10 m2/s. Cylindrical diffusion profiles of oxygen diffusion in a construct with a maximized diameter of 2 mm from Eq. 43 are shown in (e, f); parameters were Co = 0.22 mM, formula image, and D = 10−9 m2/s. The numerical solution with the same conditions as (e, f) is shown in (g, h), as explained in the text. Cylindrical diffusion profiles of limited nutrient (glucose) consumed in a construct with a maximized diameter of 2 mm described by Eq. 44 over the valid domain of r = 0 to Rmax and until Co reaches zero in media are shown in (i, j) assuming the media volume is only five times more than the cylindrical construct volume, with standard glucose parameters of Co = 10 mM, formula image, and D = 10−10 m2/s.
FIG. 6.
FIG. 6.
(a–d) Concentration profile for spherical diffusion from Eq. 46 of oxygen (a, b) using R = 1 mm, Co = 0.22 mM, D = 10−9 m2/s, and assuming no metabolism to 1000 s and glucose (c, d) using R = 1 mm, Co = 10 mM, D = 10−10 m2/s to 4000 s. The left axis represents time and the right axis represents the radial distance into the sphere, where zero is the center of the sphere. Thus, if the right axis alone was rotated about its origin in all spatial directions, it would represent the dimensions of the entire sphere. In (e, f) concentration profiles are shown for unlimited nutrient (oxygen) from Eq. 47 for a 2 mm diameter metabolically maximized sphere (formula image) where nutrient is fully consumed by the center of the construct, while remaining constant at the surface of the sphere. The numerical solution with the same conditions as (e, f) is shown in (g, h), as explained in the text. In (i, j) concentration profiles of a 2 mm maximal diameter sphere with limited nutrient (glucose) and zero-order metabolism described by Eq. 48 over the valid domain of r = 0 to Rmax and until Co reaches zero in media using Co = 10 mM, D = 10−10 m2/s, formula image, and assuming the media volume is only five times greater than the spherical construct volume.
FIG. 6.
FIG. 6.
(a–d) Concentration profile for spherical diffusion from Eq. 46 of oxygen (a, b) using R = 1 mm, Co = 0.22 mM, D = 10−9 m2/s, and assuming no metabolism to 1000 s and glucose (c, d) using R = 1 mm, Co = 10 mM, D = 10−10 m2/s to 4000 s. The left axis represents time and the right axis represents the radial distance into the sphere, where zero is the center of the sphere. Thus, if the right axis alone was rotated about its origin in all spatial directions, it would represent the dimensions of the entire sphere. In (e, f) concentration profiles are shown for unlimited nutrient (oxygen) from Eq. 47 for a 2 mm diameter metabolically maximized sphere (formula image) where nutrient is fully consumed by the center of the construct, while remaining constant at the surface of the sphere. The numerical solution with the same conditions as (e, f) is shown in (g, h), as explained in the text. In (i, j) concentration profiles of a 2 mm maximal diameter sphere with limited nutrient (glucose) and zero-order metabolism described by Eq. 48 over the valid domain of r = 0 to Rmax and until Co reaches zero in media using Co = 10 mM, D = 10−10 m2/s, formula image, and assuming the media volume is only five times greater than the spherical construct volume.
FIG. 7.
FIG. 7.
Graph showing the average diameter of cerebral organoids over time (± standard deviation). Organoids were able to exceed the maximal diameter predicted by typical oxygen consumption rates in homogenously dense neural constructs, but a model of dual layer cell densities in a spherical construct demonstrates a way of achieving an enhanced maximal diameter. A model of diffusion-limited growth was also applied and fitted to the data, demonstrating that growth follows expected behavior of a diffusion-limited system.
FIG. 8.
FIG. 8.
Induced pluripotent stem cells were cultured and passaged on a feeder-independent matrigel surface (a). Organoids demonstrated a distinct early outer layer of neuroepithelium that exhibited various forms of architecture (day 20 shown), including broad neuroepithelium (arrowheads in b) or compact localized formations of expanded neuroepithelia resembling 3D rosettes (arrows in c). In (d–f), stained sections of a 40-day old organoid demonstrated a dense outer region with neural identity [(d) green = TUJ1 β-III-tubulin, (e) blue = Hoechst stain, (f) merged], which according to the presented model may serve to enhance organoid size and diffusion characteristics.
FIG. 9.
FIG. 9.
A multicompartment spherical model for cerebral organoids is shown (a). Curve A demonstrates the general concentration profile for any metabolized gas or nutrient and the maximal diameter of 1.4 mm (dashed line) for a homogenous distribution of cells, while curve B demonstrates the concentration profile and modified maximal radius when a percentage of cells shifts into a denser outer rim (zone 1), all other parameters remaining constant, thereby enabling an enhanced maximal diameter of 1.8 mm (solid border). The percentage of ambient nutrient concentration within the construct is also marked on the concentration profile curves. The maximal diameter is enhanced when more metabolically active cells localize densely into zone 1. Zone 2 may represent an intermediate region of progenitor cells, zone 3 may represent a region of multipotency preserved by hypoxic conditions, and zone 4 represents a potentially ischemic region. (b) A graph of Eq. 58 demonstrating how the maximal achievable radius of a spherical construct increases when a homogenously cellularized sphere is modified into a two-shell sphere with a higher percentage of the cells (Ω) placed into the outer shell beginning at point ϒ along the radius between 0 and Rmax.
None
None
None
None

References

    1. Ito K., and Suda T. Metabolic requirements for the maintenance of self-renewing stem cells. Nat Rev Mol Cell Biol 15, 243, 2014. - PMC - PubMed
    1. Suda T., Takubo K., and Semenza G.L. Metabolic regulation of hematopoietic stem cells in the hypoxic niche. Cell Stem Cell 9, 298, 2011. - PubMed
    1. Feil D., Lane M., Roberts C.T., Kelley R.L., Edwards L.J., Thompson J.G., and Kind K.L. Effect of culturing mouse embryos under different oxygen concentrations on subsequent fetal and placental development. J Physiol 572, 87, 2006. - PMC - PubMed
    1. Forristal C.E., Wright K.L., Hanley N.A., Oreffo R.O., and Houghton F.D. Hypoxia inducible factors regulate pluripotency and proliferation in human embryonic stem cells cultured at reduced oxygen tensions. Reproduction 139, 85, 2010. - PMC - PubMed
    1. Mazumdar J., O'Brien W.T., Johnson R.S., LaManna J.C., Chavez J.C., Klein P.S., and Simon M.C. O2 regulates stem cells through Wnt/β-catenin signalling. Nat Cell Biol 12, 1007, 2010. - PMC - PubMed