. 2016 Apr 15;193(8):898-909.
doi: 10.1164/rccm.201502-0407OC.

Bone Marrow-derived Cells Contribute to the Pathogenesis of Pulmonary Arterial Hypertension

Affiliations

Bone Marrow-derived Cells Contribute to the Pathogenesis of Pulmonary Arterial Hypertension

Ling Yan et al. Am J Respir Crit Care Med. .

Abstract

Rationale: Pulmonary arterial hypertension (PAH) is a progressive lung disease of the pulmonary microvasculature. Studies suggest that bone marrow (BM)-derived circulating cells may play an important role in its pathogenesis.

Objectives: We used a genetic model of PAH, the Bmpr2 mutant mouse, to study the role of BM-derived circulating cells in its pathogenesis.

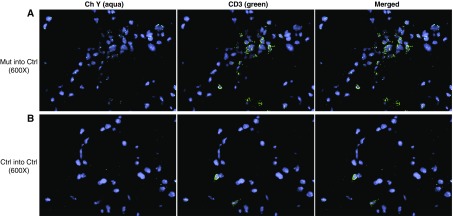
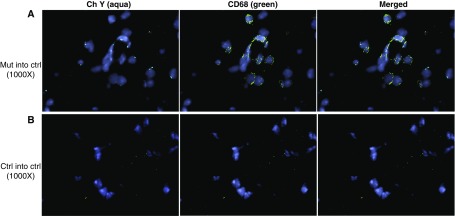
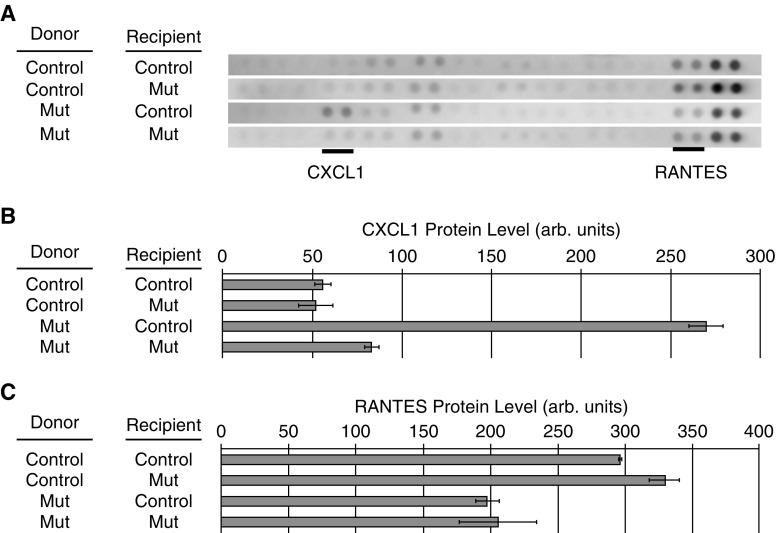
Methods: Recipient mice, either Bmpr2(R899X) mutant or controls, were lethally irradiated and transplanted with either control or Bmpr2(R899X) BM cells. Donor cells were traced in female recipient mice by Y chromosome painting. Molecular and function insights were provided by expression and cytokine arrays combined with flow cytometry, colony-forming assays, and competitive transplant assays.

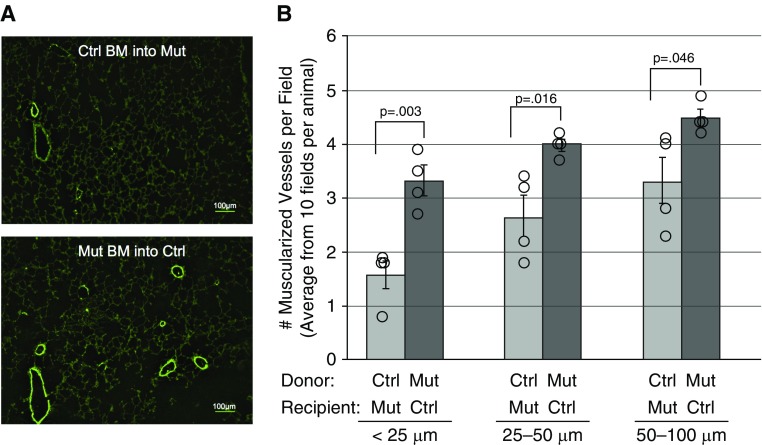
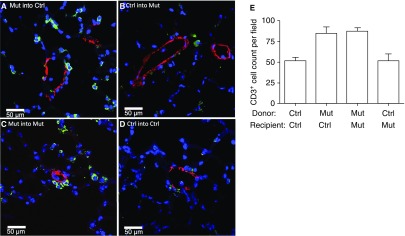
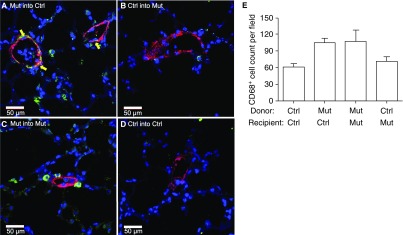
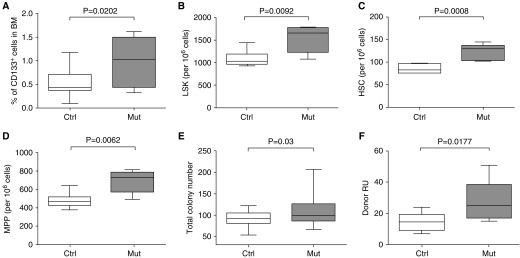
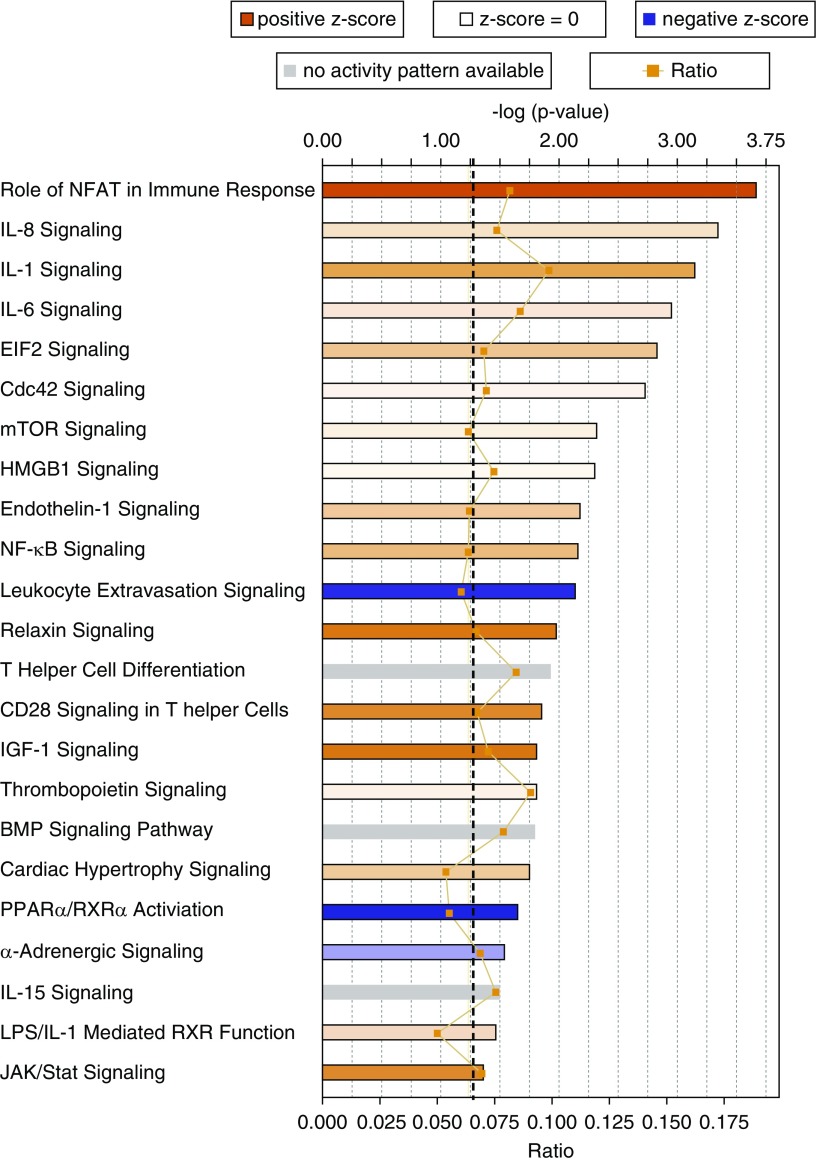
Measurements and main results: We found that mutant BM cells caused PAH with remodeling and inflammation when transplanted into control mice, whereas control BM cells had a protective effect against the development of disease, when transplanted into mutant mice. Donor BM-derived cells were present in the lungs of recipient mice. Functional and molecular analysis identified mutant BM cell dysfunction suggestive of a PAH phenotype soon after activation of the transgene and long before the development of lung pathology.

Conclusions: Our data show that BM cells played a key role in PAH pathogenesis and that the transplanted BM cells were able to drive the lung phenotype in a myeloablative transplant model. Furthermore, the specific cell types involved were derived from hematopoietic stem cells and exhibit dysfunction long before the development of lung pathology.

Keywords: Bmpr2; bone marrow cells; hematopoietic stem cells; pulmonary arterial hypertension; transplantation.


Figures

Figure 1.
Figure 1.
Control (Ctrl) recipient mice transplanted with mutant (Mut) bone marrow (BM) cells developed elevated right ventricular systolic pressure (RVSP), whereas Mut mice transplanted with control BM cells had lower RVSP. (A) Experimental design. (B) Lethally irradiated Ctrl mice developed elevated RVSP when transplanted with Mut BM cells (n = 12) compared with the Ctrl group of lethally irradiated Ctrl mice transplanted with Ctrl BM cells (n = 5) (compare the first and second boxplots). Lethally irradiated Mut mice transplanted with Ctrl BM cells showed moderation of RVSP (n = 7) compared with the Ctrl group of lethally irradiated Mut mice transplanted with Mut BM cells (n = 9) (compare the third and fourth boxplots). RVSP was measured 16 weeks after transplantation. Data are shown as box-and-whisker plots, with whiskers indicating Tukey whiskers. An α level of 0.05 was chosen, and P values less than 0.05 were considered statistically significant. All P values were two-tailed. Analyses were performed with Prism 5 for Mac OS X (GraphPad Software Inc., La Jolla, CA).
Figure 2.
Figure 2.
Control (Ctrl) recipient mice transplanted with mutant (Mut) bone marrow (BM) cells had higher muscularization compared with Mut mice transplanted with Ctrl BM cells. (A) Lung sections of recipient mice were stained with anti–smooth muscle actin antibody (fluorescein isothiocyanate conjugated) and visualized by immunofluorescence 16 weeks after transplantation. (B) Three different-sized vessels were counted from 10 microscope fields. Data are presented as means ± SEM and were analyzed by Student's t test. P values less than 0.05 were considered statistically significant. Analyses were performed with Prism 5 for Mac OS X (GraphPad Software Inc., La Jolla, CA).
Figure 3.
Figure 3.
Lungs of recipient mice transplanted with mutant (Mut) bone marrow (BM) cells had increased numbers of T cells (CD3+) compared with lungs of Mut mice transplanted with control (Ctrl) BM cells. Lungs of recipient mice were analyzed 16 weeks after transplantation by costaining with CD3–fluorescein isothiocyanate (green) and α-smooth muscle actin–tetramethylrhodamine (red) antibodies. Nuclei were visualized with 4′,6-diamidino-2-phenylindole (blue). (A) Mut BM transplanted into Ctrl recipient mice. (B) Ctrl BM transplanted into Mut recipient mice. (C) Control group; Mut BM cells transplanted into Mut recipient mice. (D) Control group; Ctrl BM cells transplanted into Ctrl recipient mice. Representative pictures are shown. (E) Average number of CD3+ cells by cell counting from 10 random fields at a magnification of ×10.
Figure 4.
Figure 4.
Lungs of recipient mice transplanted with mutant (Mut) bone marrow (BM) cells had increased numbers of macrophages (CD68+) compared with lungs of Mut mice transplanted with control (Ctrl) BM cells. Lungs of recipient mice were analyzed 16 weeks after transplantation by costaining with CD68–fluorescein isothiocyanate (green) and α-smooth muscle actin–tetramethylrhodamine (red) antibodies. Nuclei were visualized with 4′,6-diamidino-2- (blue). (A) Mut BM transplanted into Ctrl recipient mice. (B) Ctrl BM transplanted into Mut recipient mice. (C) Control group; Mut BM cells transplanted into Mut recipient mice. (D) Control group; Ctrl BM cells transplanted into Ctrl recipient mice. Note that CD68+ cells appeared to be imbedded within the vessel wall. Representative pictures are shown. Yellow arrows indicate the likely presence of CD68+ cells in the vessel wall. (E) Average number of CD68+ cells by cell counting from 10 random fields at a magnification of ×10.
Figure 5.
Figure 5.
Recipient mice contain donor-derived CD3+ cells. Lungs of female recipient mice transplanted with male bone marrow (BM) cells were analyzed 16 weeks after transplantation. To visualize the Y chromosome (Ch Y) in donor male BM cells, fluorescence in situ hybridization was combined with immunohistochemistry. Lung sections were painted with Y probe (aqua) and then costained with CD3–fluorescein isothiocyanate (T cells, green). Nuclei were visualized with 4′,6-diamidino-2-phenylindole (blue). Representative pictures are shown at an original magnification of ×600. (A) Mutant (Mut) BM transplanted into control (Ctrl) recipient mice. (B) Control group; Ctrl BM transplanted into Ctrl recipient mice.
Figure 6.
Figure 6.
Recipient mice contain donor-derived CD68+ cells. Lungs of female recipient mice transplanted with male bone marrow (BM) cells were analyzed 16 weeks after transplantation. To visualize the Y chromosome (Ch Y) in donor male BM cells, fluorescence in situ hybridization was combined with immunohistochemistry. Lung sections were painted with Y probe (aqua) and then costained with CD68–fluorescein isothiocyanate (macrophages, green). Nuclei were visualized with 4′,6-diamidino-2-phenylindole (blue). Representative pictures are shown at an original magnification of ×1,000. (A) Mutant (Mut) BM transplanted into control (Ctrl) recipient mice. (B) Control group; Ctrl BM transplanted into Ctrl recipient mice.
Figure 7.
Figure 7.
Altered chemokine levels in the lungs of recipient mice. Protein extracts from lung tissue of three recipient mice from each transplant group were pooled and applied to R&D Systems mouse cytokine array panels. The four analysis groups were as follows: control (Ctrl) bone marrow (BM) transplanted into Ctrl recipient mice, Ctrl BM transplanted into mutant (Mut) recipient mice, Mut BM cells transplanted into Ctrl recipient mice, and Mut BM cells transplanted in Mut recipient mice. (A) Each pair of dots represents an independent cytokine antibody. Forty cytokines were analyzed per array. The strips containing CXCL1 and RANTES (regulated upon activation, normal T-cell expressed and secreted) are shown, and the spots representing CXCL1 and RANTES are underlined. (B) Normalized densitometry of CXCL1 in each group. (C) Normalized densitometry of RANTES in each group. arb. = arbitrary; CXCL1 = chemokine (C-X-C motif) ligand 1 (melanoma growth–stimulating activity α).
Figure 8.
Figure 8.
Hematopoietic stem cell (HSC) and progenitor cell functions were altered in the mutant (Mut) mice with pulmonary arterial hypertension. Flow cytometric analysis of cell populations was done in the bone marrow (BM) of Mut and control (Ctrl) mice. (A) CD133+ progenitor cells, (B) LinSca-1+c-kit+ (LSK) cells, (C) HSCs (LSK/CD48CD150+), and (D) multipotent progenitors (MPPs) (LSK/CD34+Flt3high). (E) BM cells from Mut mice produced more colonies in methylcellulose colony-forming assays than BM cells from Ctrl mice. (F) Mut BM cells have higher donor reconstitution units (RU) in long-term competitive transplantation assays than control BM cells. Data are shown as box-and-whisker plots, with whiskers indicating Tukey whiskers. An α level of 0.05 was chosen, and P values less than 0.05 were considered statistically significant. All P values were two-tailed. Analyses were performed with Prism 5 for Mac OS X (GraphPad Software Inc., La Jolla, CA).
Figure 9.
Figure 9.
Canonical pathways significantly overrepresented in the gene expression data. The most statistically significant canonical pathways in the differential expression data (comparing mutant bone marrow cells with control bone marrow cells) are shown. Orange–red is indicative of pathway activation; blue is indicative of pathway repression. Color strength shows the degree of activation and repression. The orange line shows the ratio of genes found in each pathway over the total number of genes known to be in that pathway. The dashed black line represents the threshold line and corresponds to a P value of 0.05. The significance of the association between the dataset and the pathway was measured in two ways: (1) a ratio of the number of molecules from the dataset that map to the pathway divided by the total number of molecules that map to the canonical pathways (indicated by the orange line and boxes), and (2) Fisher’s exact test was used to calculate a P value determining the probability that the association between the genes in the observed values and the canonical pathway is explained by chance alone. BMP = bone morphogenetic protein; EIF2 = eukaryotic initiation factor 2; HMGB1 = high-mobility group box 1; IGF = insulin-like growth factor; JAK = Janus kinase; mTOR = mammalian target of rapamycin; NFAT = nuclear factor of activated T cells; NF-κB = nuclear factor-κB; PPARα/RXRα = peroxisome proliferator–activated receptor-α/retinoid X receptor-α.
Figure 10.
Figure 10.
Ingenuity pathway analysis regulator effects analyses of expression data predict activation of inflammatory cell functions in mutant bone marrow cells shortly after mutant transgene activation. The Regulator Effects algorithm connects upstream regulators to downstream cellular functions to explain how the activation or inhibition of an upstream regulator affects the downstream target molecule expression and the impact of the molecular expression on functions and diseases. The regulators are colored by their predicted activation state: red (down-regulated), green (up-regulated), orange (predicted activation), and blue (predicted inhibition). The intensity of color indicates the degree of activation or repression. Darker colors indicate higher absolute z-scores. Fisher’s exact test with a cutoff P value less than 0.01 was used determine the probability that the association between upstream regulator in expression data and the downstream cell function is explained by chance alone. The lines connecting the nodes are orange when leading to activation of the downstream node, blue or dark gray when leading to its inhibition, and yellow if the findings underlying the relationship are inconsistent with the state of the downstream node. Pointed arrowheads indicate that the downstream node is expected to be activated, whereas blunt arrowheads indicate that the downstream node is expected to be inhibited. Dashed lines indicate virtual relationships composed of the net effect of the paths between the root regulator and the target. *Multiple identifiers in the expression data set for this gene.

Comment in

Similar articles

Cited by

References

    1. Hayashida K, Fujita J, Miyake Y, Kawada H, Ando K, Ogawa S, Fukuda K. Bone marrow–derived cells contribute to pulmonary vascular remodeling in hypoxia-induced pulmonary hypertension. Chest. 2005;127:1793–1798. - PubMed
    1. Abe R, Donnelly SC, Peng T, Bucala R, Metz CN. Peripheral blood fibrocytes: differentiation pathway and migration to wound sites. J Immunol. 2001;166:7556–7562. - PubMed
    1. Angelini DJ, Su Q, Kolosova IA, Fan C, Skinner JT, Yamaji-Kegan K, Collector M, Sharkis SJ, Johns RA. Hypoxia-induced mitogenic factor (HIMF/FIZZ1/RELMα) recruits bone marrow–derived cells to the murine pulmonary vasculature. PLoS One. 2010;5:e11251. - PMC - PubMed
    1. Spees JL, Whitney MJ, Sullivan DE, Lasky JA, Laboy M, Ylostalo J, Prockop DJ. Bone marrow progenitor cells contribute to repair and remodeling of the lung and heart in a rat model of progressive pulmonary hypertension. FASEB J. 2008;22:1226–1236. - PubMed
    1. Frid MG, Brunetti JA, Burke DL, Carpenter TC, Davie NJ, Reeves JT, Roedersheimer MT, van Rooijen N, Stenmark KR. Hypoxia-induced pulmonary vascular remodeling requires recruitment of circulating mesenchymal precursors of a monocyte/macrophage lineage. Am J Pathol. 2006;168:659–669. - PMC - PubMed

Publication types