. 2015 Dec 7;35(5):584-599.
doi: 10.1016/j.devcel.2015.11.010.

Role for Lipid Droplet Biogenesis and Microlipophagy in Adaptation to Lipid Imbalance in Yeast

Affiliations

Role for Lipid Droplet Biogenesis and Microlipophagy in Adaptation to Lipid Imbalance in Yeast

Jason D Vevea et al. Dev Cell. .

Abstract

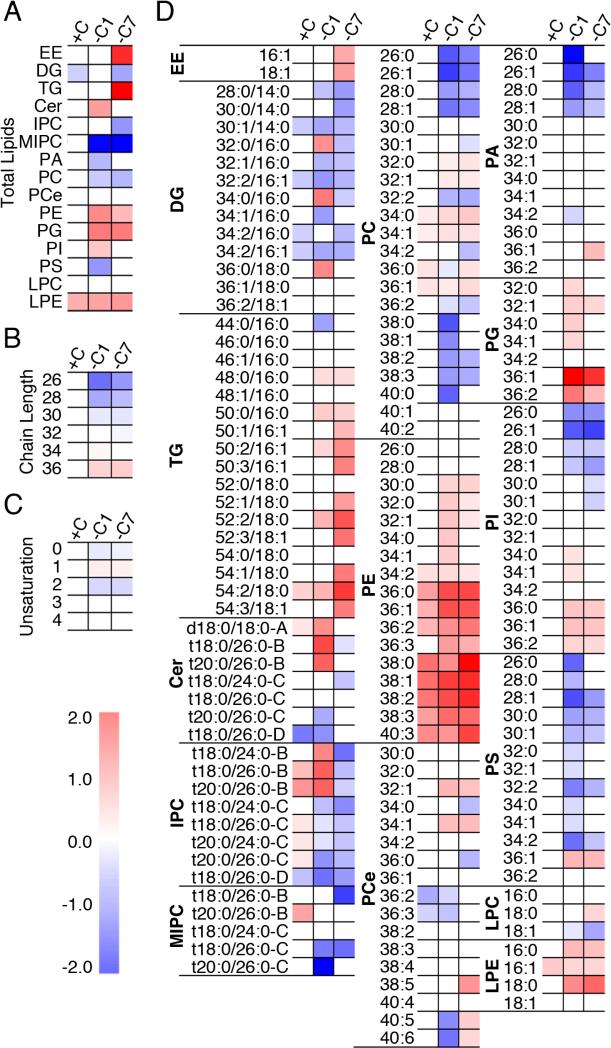
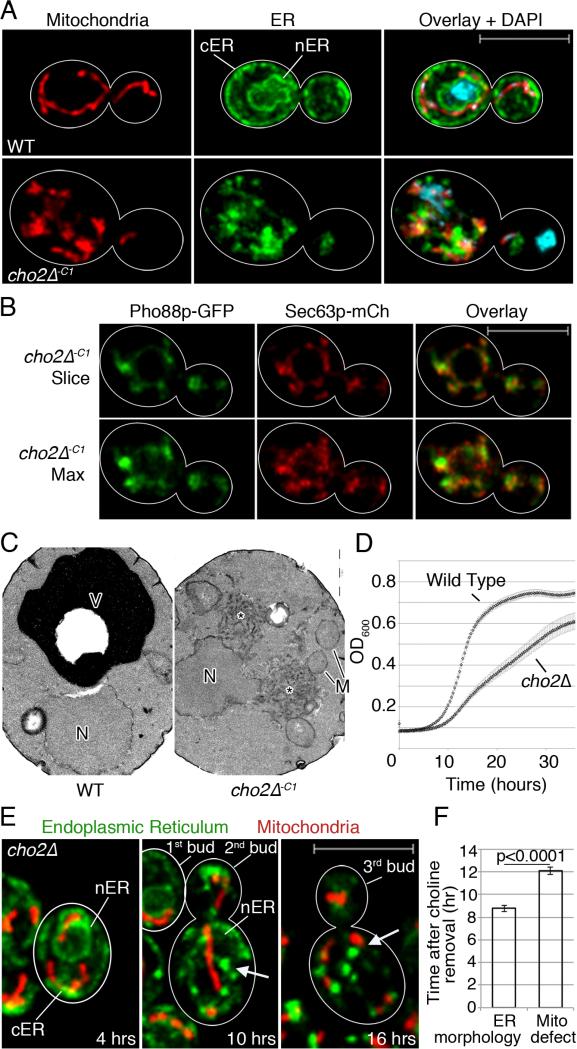
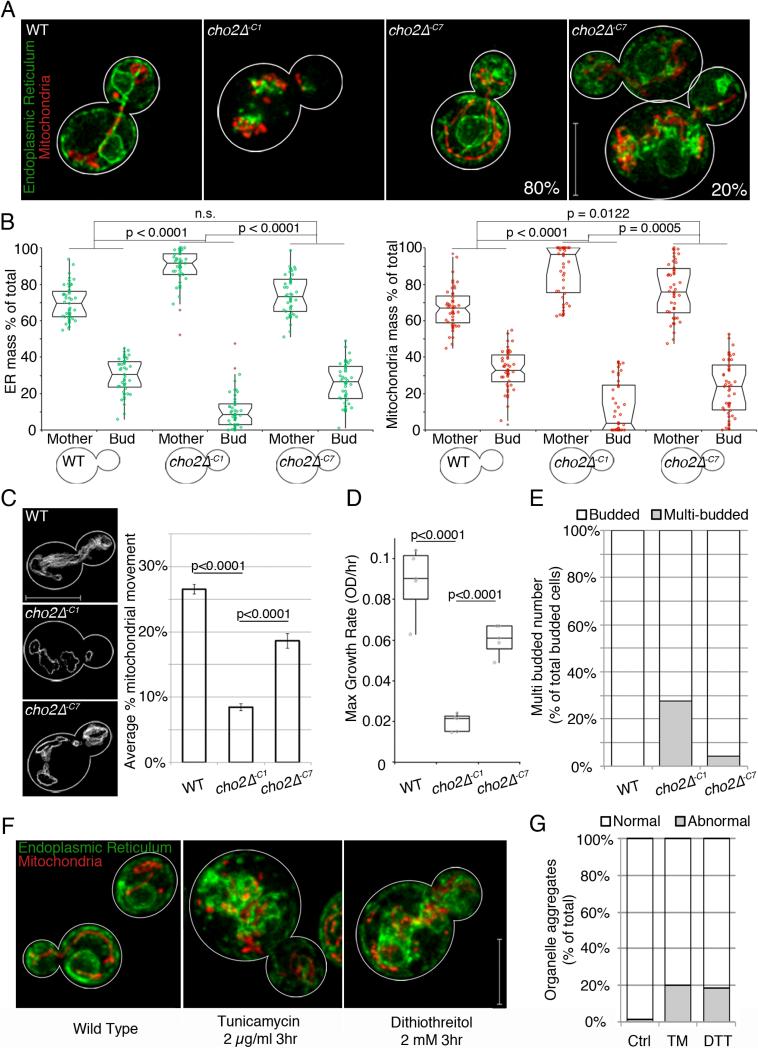
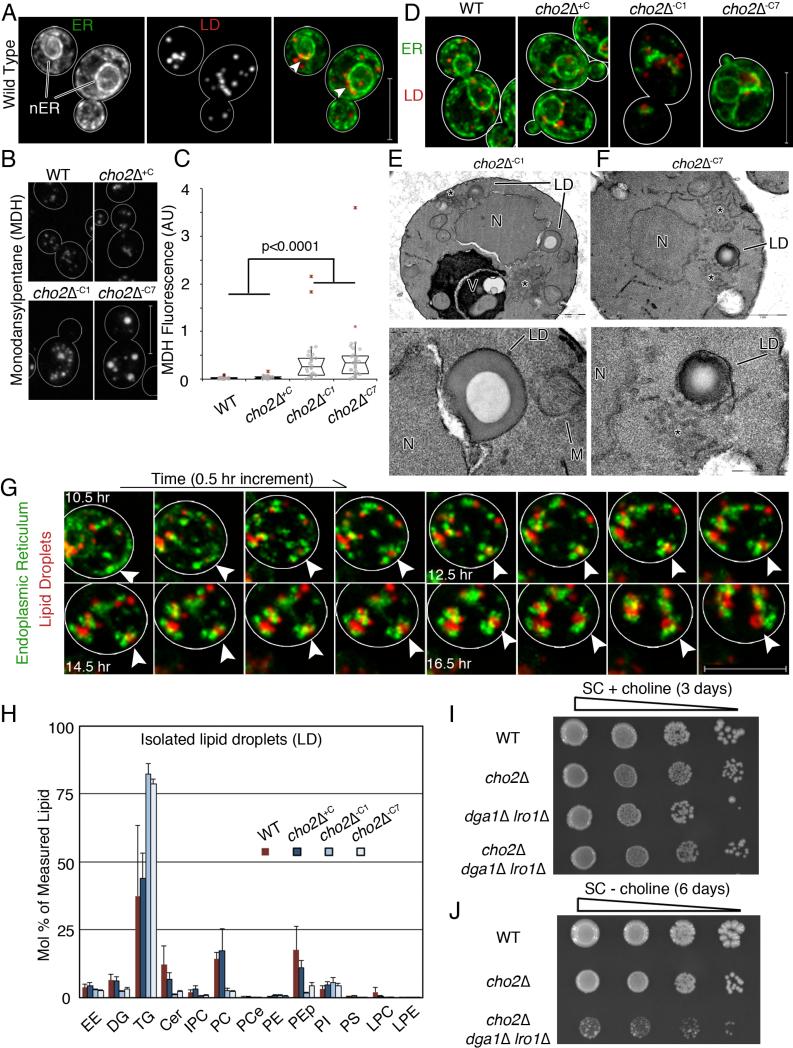
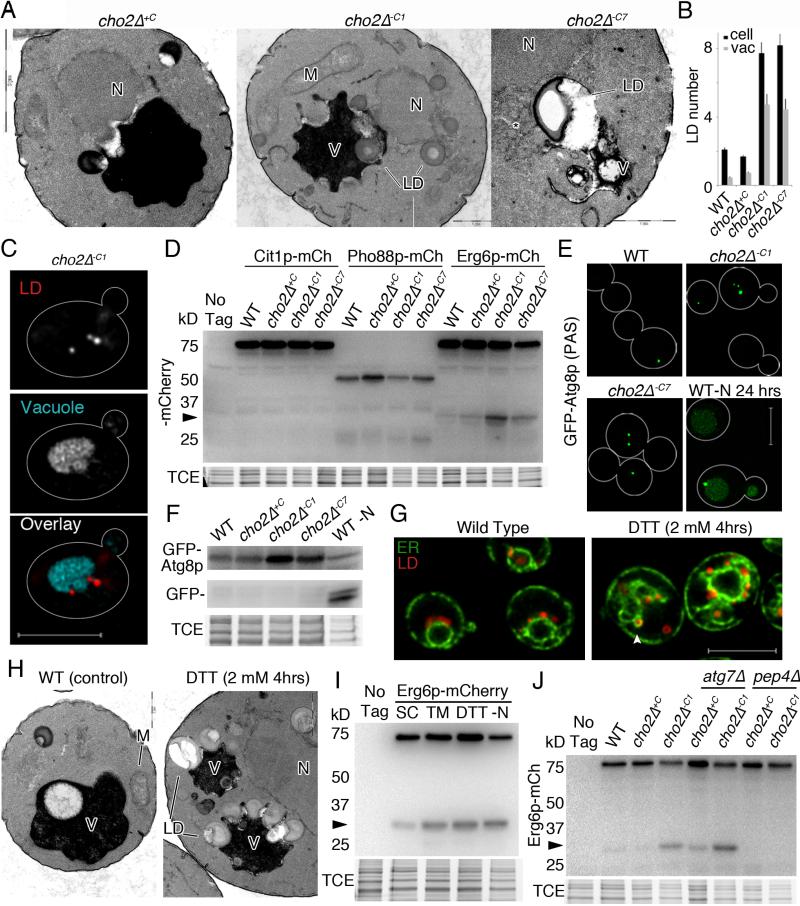
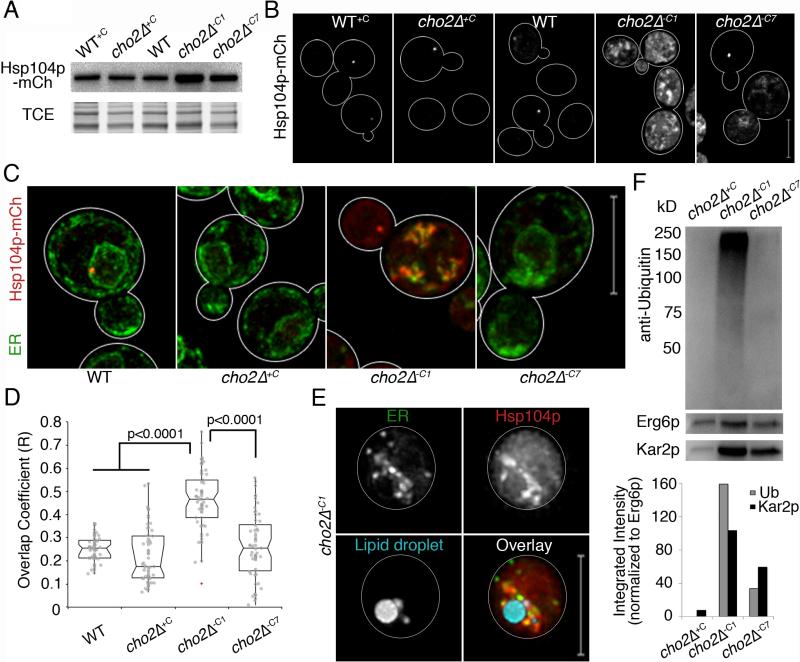
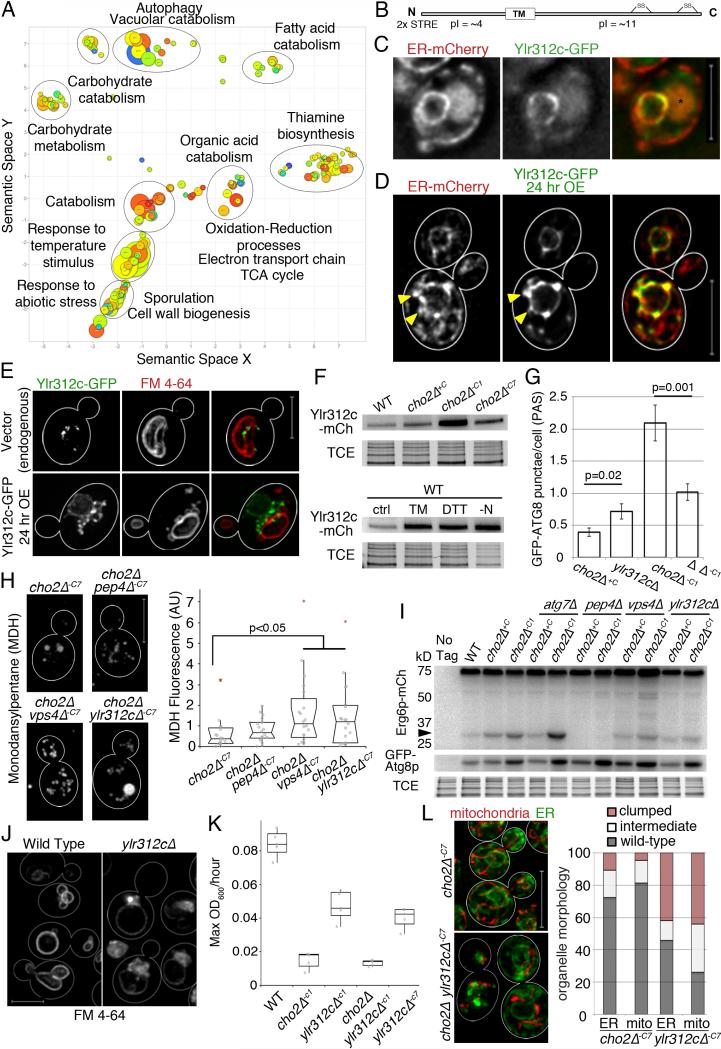
The immediate responses to inhibition of phosphatidylcholine (PC) biosynthesis in yeast are altered phospholipid levels, slow growth, and defects in the morphology and localization of ER and mitochondria. With chronic lipid imbalance, yeast adapt. Lipid droplet (LD) biogenesis and conversion of phospholipids to triacylglycerol are required for restoring some phospholipids to near-wild-type levels. We confirmed that the unfolded protein response is activated by this lipid stress and find that Hsp104p is recruited to ER aggregates. We also find that LDs form at ER aggregates, contain polyubiquitinated proteins and an ER chaperone, and are degraded in the vacuole by a process resembling microautophagy. This process, microlipophagy, is required for restoration of organelle morphology and cell growth during adaptation to lipid stress. Microlipophagy does not require ATG7 but does requires ESCRT components and a newly identified class E VPS protein that localizes to ER and is upregulated by lipid imbalance.


Figures

Fig. 1
Fig. 1. Phospholipids and neutral lipids change in response to PC biosynthetic defects
The lipidome of mid-log phase yeast. Heat maps show significant changes using two-way ANOVA followed by post hoc Dunnett's test in (a) lipid subclasses, (b) total fatty acyl/alkyl chain length, (c) unsaturation in phospholipids and DG, and (d) individual lipid species. The color scale indicates log2-transformed fold change of cho2Δ cells vs. WT cells in each condition. See also Figure S1.
Fig. 2
Fig. 2. Lipid imbalance triggers mitochondria and ER morphology defects
(a) Maximum projections of of WT and cho2Δ cells expressing Cit1p-mCherry and Pho88p-GFP Cell outlines in white. Bar: 5 μm. (b) A single optical section (top) or maximum projection (bottom) of Pho88p-GFP and Sec63p-mCh in cho2Δc1 cells. (c) TEMs of WT and cho2Δ-c1 cells, N: nucleus. M: mitochondrion. V: vacuole. Asterisk marks abnormal membrane aggregates. Bar: 1 μm. (d) Growth of WT and cho2Δ cells. (e) Time-lapse images of cho2Δ cells perfused with choline-free media. Arrows point to abnormal ER aggregates. Bar: 5 μm (f) Mean time to organelle aggregation after choline removal +/− SEM. P-values calculated using Student's t-test. One representative trial from 3 independent trials. n>10 for each trial. See also Figure S2.
Fig. 3
Fig. 3. Yeast cells adapt to the lipid stress associated with decreased PC biosynthesis
(a) Maximum projections of WT and cho2Δ cells expressing Cit1p-mCherry, Pho88p-GFP. (b) Mitochondrial and ER distribution between mother cells and buds, expressed as percentage of total integrated fluorescence intensity, plotted in a notched dot box plot. n>40 for each condition. P-values from Kruskal-Wallace test with Bonferroni correction. (c) Representative traces of total mitochondrial motility (grey). Mean mitochondrial movement +/− SEM. P-values from Student's t-test, n>20 for each condition. (d) Box dot plots of maximum growth rates of indicated strains. P-values from Kruskal-Wallace test with Bonferroni correction, quintuplicate replicates for each condition. (e) Percentage of multi-budded cells (grey) as a function of total budded cells (white) in each condition, n>50 for each condition. (f) Maximum projections of mitochondria and ER after 3 hr DMSO, TM or DTT treatment. (g) Mitochondrial and ER morphology defects (grey) expressed as percentage of cells containing aggregated organelles, n>60 for each condition. For all quantitation, 1 representative trial is shown from 3 independent trials. Scale bars: 5 μm. See also Figure S3.
Fig 4
Fig 4. Lipid droplet biogenesis occurs at ER aggregates and is required for adaptation to lipid imbalance
(a) Maximum projections of cells expressing Pho88p-GFP and Erg6p-mCherry. Arrow heads point to areas near the nucleus where LDs accumulate. Bar: 5 μm (b) Representative images of MDH-stained LDs. Bar: 5 μm. (c) Notched dot box plot of cellular MDH fluorescence. P-values from Kruskal-Wallace test with Bonferroni correction. 1 of 3 representative trials is shown, n>25 cells for each condition. (d) Representative images of ER and LDs during lipid imbalance. Bar: 5μm. (e-f) TEM of a cho2Δ cell, N: nucleus. LD: lipid droplet. V: Vacuole. LDs have a characteristic “donut” staining pattern. Asterisk marks abnormal membrane aggregates. Bottom panels show enlarged views of LDs in the respective top panels. Bar: 1 μm (d-e top), 200 nm (d bottom), 500 nm (e bottom). (g) Representative time-lapse frames of ER and LDs in a cho2Δ cell after transfer to choline-free medium. Arrow heads point to the same spot in all images. Bar: 5 μm. (h) Lipids analyzed as in Fig. 1 are represented as mean +/− SEM. (i) Dot assay of serially diluted (1:10) strains on SC + choline media. (j) Dot assay of serially diluted (1:10) strains grown to mid-log phase in choline-containing media and plated on choline-free SC media. See also Figure S4.
Fig. 5
Fig. 5. Stress-induced LDs are degraded in the vacuole in a process that resembles microautophagy
(a) TEM of cho2Δ cells showing interactions of LDs and vacuoles. N: nucleus. LD: lipid droplet. M: mitochondria. V: vacuole. Bars, from left to right: 2 μm, 1 μm, and 1 μm . (b) Quantitation of LD abundance in cho2Δ cells visualized by TEM. Mean +/− SEM. (c) Representative image of cho2Δ cells expressing Erg6p-mCh and stained with FM-464. Images are single slices from deconvolved wide-field z-series. Bar: 5 μm. (d) Representative western blot of cells expressing organelle-targeted mCherry reporters of autophagy. Arrow points to protease-resistant/free mCherry. (e) Maximum projections of GFP-Atg8p. Bar: 5 μm. (f) Representative western blots of GFP-Atg8p, with TCE as a load control. (g) Representative central slices of cells expressing Pho88p-GFP and Erg6p-mCherry. Arrowhead points to area near nucleus showing enlarged LDs. (h) TEM of untreated and DTT-treated cells. Labels are defined in (a). Bar: 500 nm. (i-j) Representative western blots showing vacuolar degradation of Erg6p-mCh to free mCherry (arrow). TCE: load control. All experiments (except TEM): 1 representative trial is shown from 3 independent trials. See also Figure S5.
Fig. 6
Fig. 6. Chaperone proteins are recruited to ER aggregates and LD fractions are enriched in ubiquitinated proteins
(a) Western blot of Hsp104p-mCh. TCE: load control. (b) Maximum projections of Hsp104-mCh. (c) Representative images of Pho88p-GFP and Hsp104-mCh. (d) Notched dot box plots of colocalization between ER and protein aggregate fluorescence in (c) using Manders’ overlap coefficient (R). P-values from Kruskal-Wallace test with Bonferroni correction. n>50 for each condition. (e) Representative images of cells as in (c) with LDs labeled with MDH. Bar: 5 μm. (f) Upper panel: Representative western blot of ubiquitinated proteins in LDs isolated as in Fig. 4h. LDs isolated from cho2Δ+C cells were used as controls. Erg6p-mCh was used as a loading control. Blots were also probed for Kar2p as an internal ER chaperone. Lower panel: Quantitation of ubiquitin and Kar2p levels normalized to Erg6p levels. 1 representative trial is shown from 3 independent trials fpr all experiments. All scale bars: 5 μm. See also Figure S6.
Fig. 7
Fig. 7. Stress-induced microautophagy is regulated by the ESCRT complex and a previously uncharacterized protein
(a) Revigo plot of up-regulated GO terms from RNAseq data identifying differentially expressed mRNAs between WT cells and cho2ΔC1 cells. (b) Ylr312p predicted domains and properties. (c) Representative images of cells expressing Pho88p-mCh and genomic Ylr312p-GFP. Asterisk marks vacuole autofluorescence. Images are single slices from deconvolved wide-field z-series. (d) Representative images of cells expressing genomic Pho88p-mCh and a GAL construct containing Ylr312p-GFP, induced for 24 hr (24 hr OE). Maximum projections are shown of 2 adjacent slices from deconvolved wide-field z-series. Arrowheads point to Ylr312c-containing nER projections. (e) Representative images of Ylr312c-GFP expressed from the endogenous locus, and OE Ylr312p-GFP. Vacuole visualized with FM4-64. Maximum projections of deconvolved wide-field z-series are shown. (f) Representative Ylr312c-mCh western blot. TCE: load control. (g) Quantification of GFP-Atg8p puncta (PAS and autophagosomes) per cell. Mean +/− SEM. P-values from Student's t-test, n>30 for each condition. (h) Representative images of MDH stained LDs. Quantitation of MDH fluorescence as for Fig. 4c. (i) Analysis of microlipophagy was carried out as for Fig. 5j. (j) Maximum projections of cells stained with FM4-64. (k) Maximum growth rates were calculated as for Fig. 2d. (l) Left: Mitochondria and ER imaged as for Fig. 3a. Right: Quantitation of defects in organelle morphology and distribution. 1 representative trial is shown from 3 independent trials for all experiments. Scale bars: 5 μm. See also Figure S7.

References

    1. Ashok A, Hegde RS. Selective processing and metabolism of disease-causing mutant prion proteins. PLoS Pathog. 2009;5:e1000479. - PMC - PubMed
    1. Babour A, Bicknell A.a., Tourtellotte J, Niwa M. A surveillance pathway monitors the fitness of the endoplasmic reticulum to control its inheritance. Cell. 2010;142:256–269. - PMC - PubMed
    1. Bernales S, McDonald KL, Walter P. Autophagy counterbalances endoplasmic reticulum expansion during the unfolded protein response. PLoS biology. 2006;4:e423–e423. - PMC - PubMed
    1. Brodsky JL. Cleaning up: ER-associated degradation to the rescue. Cell. 2012;151:1163–1167. - PMC - PubMed
    1. Carman GM, Henry S.a. Phospholipid biosynthesis in the yeast Saccharomyces cerevisiae and interrelationship with other metabolic processes. Progress in lipid research. 1999;38:361–399. - PubMed

Publication types

MeSH terms

Substances

LinkOut - more resources