

Genetic modification of human mesenchymal stem cells helps to reduce adiposity and improve glucose tolerance in an obese diabetic mouse model
- PMID: 26652025
- PMCID: PMC4674936
- DOI: 10.1186/s13287-015-0224-9
Genetic modification of human mesenchymal stem cells helps to reduce adiposity and improve glucose tolerance in an obese diabetic mouse model
Abstract
Introduction: Human mesenchymal stem cells (MSCs) are multipotent cells that can differentiate into fat, muscle, bone and cartilage cells. Exposure of subcutaneous abdominal adipose tissue derived AD-MSCs to high glucose (HG) leads to superoxide accumulation and up-regulation of inflammatory molecules. Our aim was to inquire how HG exposure affects MSCs differentiation and whether the mechanism is reversible.
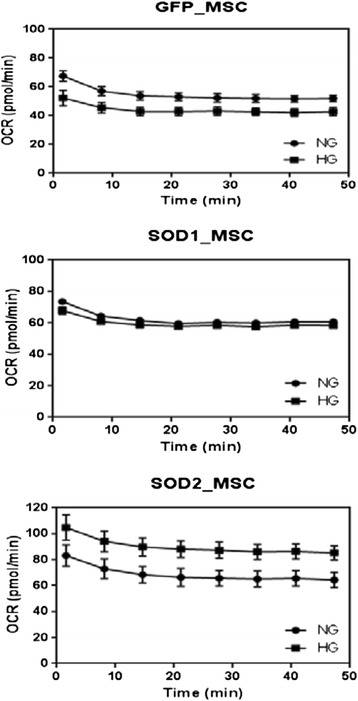
Methods: We exposed human adipose tissue derived MSCs to HG (25 mM) and compared it to normal glucose (NG, 5.5 mM) exposed cells at 7, 10 and 14 days. We examined mitochondrial superoxide accumulation (Mitosox-Red), cellular oxygen consumption rate (OCR, Seahorse) and gene expression.
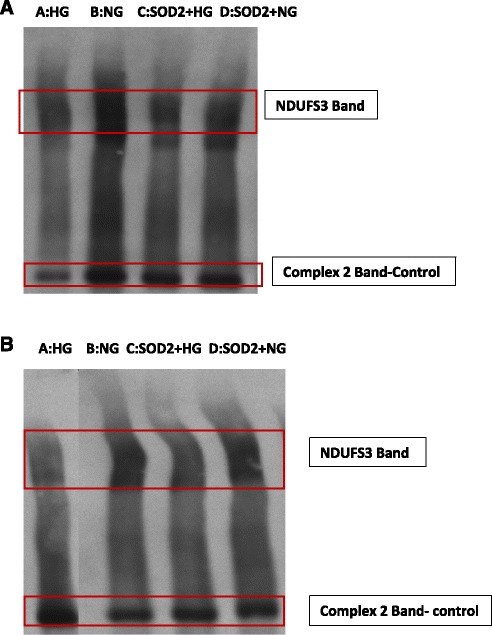
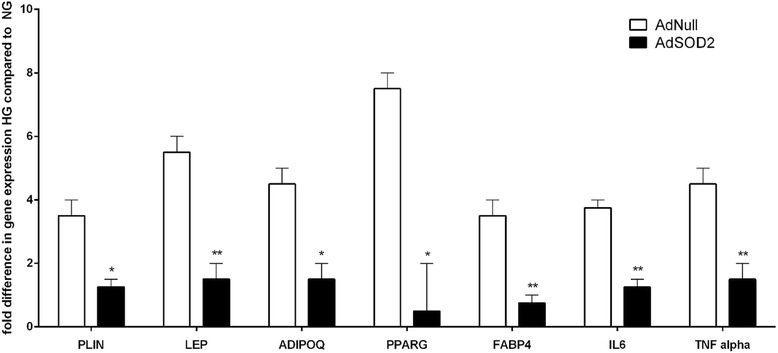
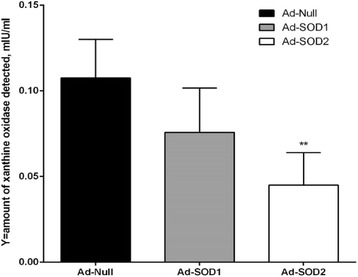
Results: HG increased reactive superoxide (ROS) accumulation noted by day 7 both in cytosol and mitochondria. The OCR between the NG and HG exposed groups however did not change until 10 days at which point OCR of HG exposed cells were reduced significantly. We noted that HG exposure upregulated mRNA expression of adipogenic (PPARG, FABP-4, CREBP alpha and beta), inflammatory (IL-6 and TNF alpha) and antioxidant (SOD2 and Catalase) genes. Next, we used AdSOD2 to upregulate SOD2 prior to HG exposure and thereby noted reduction in superoxide generation. SOD2 upregulation helped reduce mRNA over-expression of PPARG, FABP-4, IL-6 and TNFα. In a series of separate experiments, we delivered the eGFP and SOD2 upregulated MSCs (5 days post ex-vivo transduction) and saline intra-peritoneally (IP) to obese diabetic (db/db) mice. We confirmed homing-in of eGFP labeled MSCs, delivered IP, to different inflamed fat pockets, particularly omental fat. Mice receiving SOD2-MSCs showed progressive reduction in body weight and improved glucose tolerance (GTT) at 4 weeks, post MSCs transplantation compared to the GFP-MSC group (control).
Conclusions: High glucose evokes superoxide generation, OCR reduction and adipogenic differentiation. Mitochondrial superoxide dismutase upregulation quenches excess superoxide and reduces adipocyte inflammation. Delivery of superoxide dismutase (SOD2) using MSCs as a gene delivery vehicle reduces inflammation and improves glucose tolerance in vivo. Suppression of superoxide production and adipocyte inflammation using mitochondrial superoxide dismutase may be a novel and safe therapeutic tool to combat hyperglycemia mediated effects.
Figures


Similar articles
-
Antioxidant-upregulated mesenchymal stem cells reduce inflammation and improve fatty liver disease in diet-induced obesity.Stem Cell Res Ther. 2019 Sep 2;10(1):280. doi: 10.1186/s13287-019-1393-8. Stem Cell Res Ther. 2019. PMID: 31477174 Free PMC article.
-
Bone marrow-derived mesenchymal stem cells ameliorate chronic high glucose-induced β-cell injury through modulation of autophagy.Cell Death Dis. 2015 Sep 17;6(9):e1885. doi: 10.1038/cddis.2015.230. Cell Death Dis. 2015. PMID: 26379190 Free PMC article.
-
Trichostatin A modulates intracellular reactive oxygen species through SOD2 and FOXO1 in human bone marrow-mesenchymal stem cells.Cell Biochem Funct. 2015 Jan;33(1):37-43. doi: 10.1002/cbf.3084. Epub 2014 Dec 16. Cell Biochem Funct. 2015. PMID: 25515622
-
Effects of Oxidative Stress on Mesenchymal Stem Cell Biology.Oxid Med Cell Longev. 2016;2016:2989076. doi: 10.1155/2016/2989076. Epub 2016 Jun 16. Oxid Med Cell Longev. 2016. PMID: 27413419 Free PMC article. Review.
-
Reactive Oxygen Species, Superoxide Dimutases, and PTEN-p53-AKT-MDM2 Signaling Loop Network in Mesenchymal Stem/Stromal Cells Regulation.Cells. 2018 May 1;7(5):36. doi: 10.3390/cells7050036. Cells. 2018. PMID: 29723979 Free PMC article. Review.
Cited by
-
Impact of exogenous hydrogen peroxide on osteogenic differentiation of broiler chicken compact bones derived mesenchymal stem cells.Front Physiol. 2023 Jan 26;14:1124355. doi: 10.3389/fphys.2023.1124355. eCollection 2023. Front Physiol. 2023. PMID: 36776980 Free PMC article.
-
Preconditioning influences mesenchymal stem cell properties in vitro and in vivo.J Cell Mol Med. 2018 Mar;22(3):1428-1442. doi: 10.1111/jcmm.13492. Epub 2018 Feb 1. J Cell Mol Med. 2018. PMID: 29392844 Free PMC article. Review.
-
Targeting G-quadruplex motifs interferes with differentiation of adipose-derived mesenchymal stem cells.Stem Cell Res Ther. 2023 Apr 19;14(1):98. doi: 10.1186/s13287-023-03320-9. Stem Cell Res Ther. 2023. PMID: 37076894 Free PMC article.
-
Improved therapeutics of modified mesenchymal stem cells: an update.J Transl Med. 2020 Jan 30;18(1):42. doi: 10.1186/s12967-020-02234-x. J Transl Med. 2020. PMID: 32000804 Free PMC article. Review.
-
Combination of Antioxidant Enzyme Overexpression and N-Acetylcysteine Treatment Enhances the Survival of Bone Marrow Mesenchymal Stromal Cells in Ischemic Limb in Mice With Type 2 Diabetes.J Am Heart Assoc. 2021 Oct 5;10(19):e023491. doi: 10.1161/JAHA.121.023491. Epub 2021 Sep 25. J Am Heart Assoc. 2021. PMID: 34569277 Free PMC article.
References
MeSH terms
Substances
LinkOut - more resources
Full Text Sources
Other Literature Sources
Medical
Research Materials
Miscellaneous
