. 2015 Dec 10:6:244.
doi: 10.1186/s13287-015-0231-x.

Human adult stem cells derived from adipose tissue and bone marrow attenuate enteric neuropathy in the guinea-pig model of acute colitis

Affiliations

Human adult stem cells derived from adipose tissue and bone marrow attenuate enteric neuropathy in the guinea-pig model of acute colitis

Rhian Stavely et al. Stem Cell Res Ther. .

Abstract

Introduction: Mesenchymal stem cells (MSCs) have been identified as a viable treatment for inflammatory bowel disease (IBD). MSCs derived from bone marrow (BM-MSCs) have predominated in experimental models whereas the majority of clinical trials have used MSCs derived from adipose tissue (AT-MSCs), thus there is little consensus on the optimal tissue source. The therapeutic efficacies of these MSCs are yet to be compared in context of the underlying dysfunction of the enteric nervous system innervating the gastrointestinal tract concomitant with IBD. This study aims to characterise the in vitro properties of MSCs and compare their in vivo therapeutic potential for the treatment of enteric neuropathy associated with intestinal inflammation.

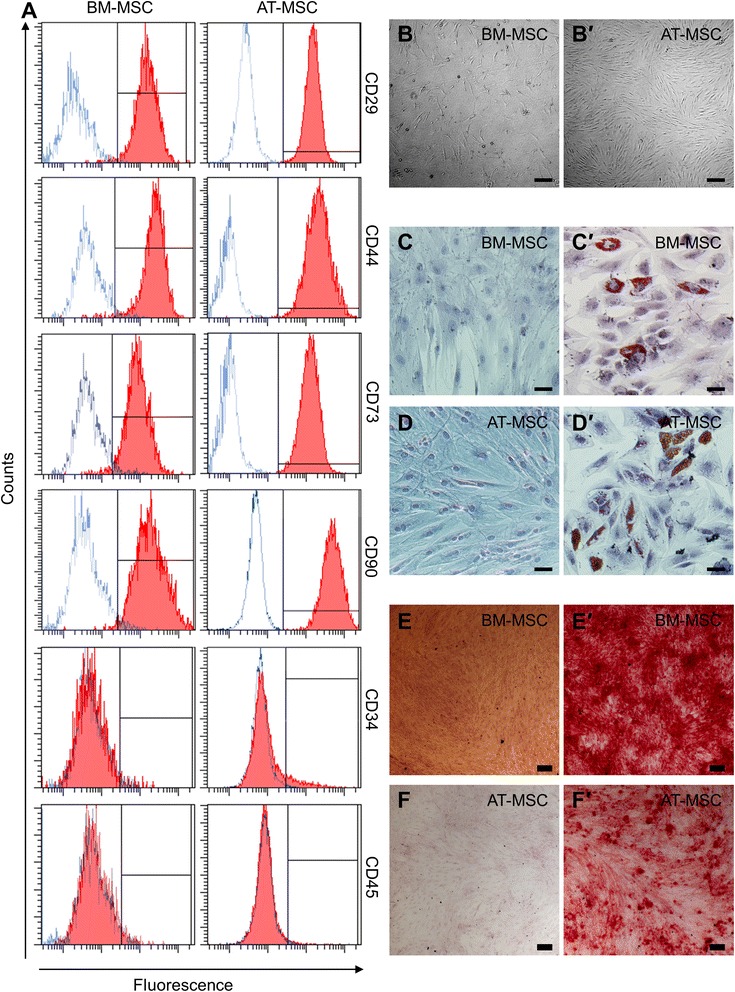
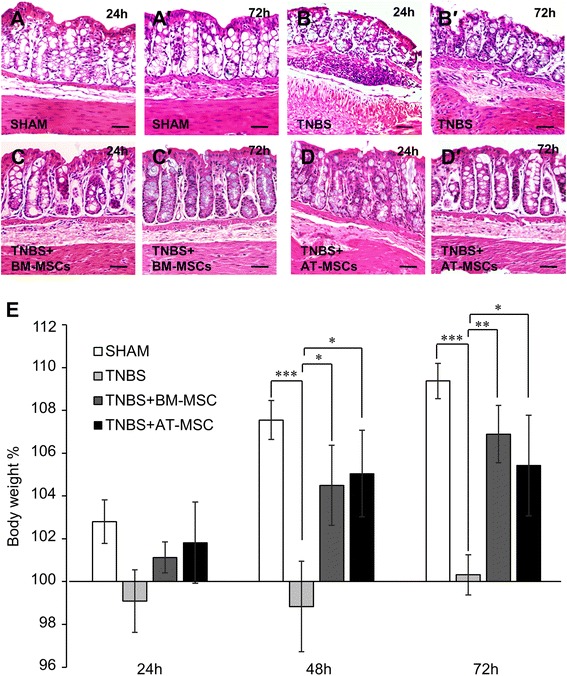
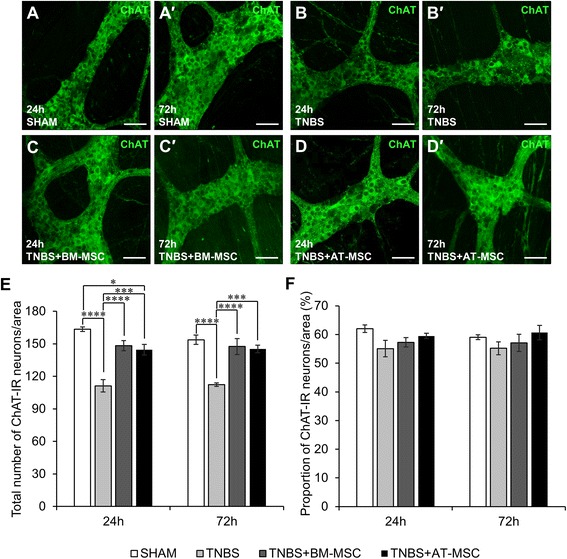
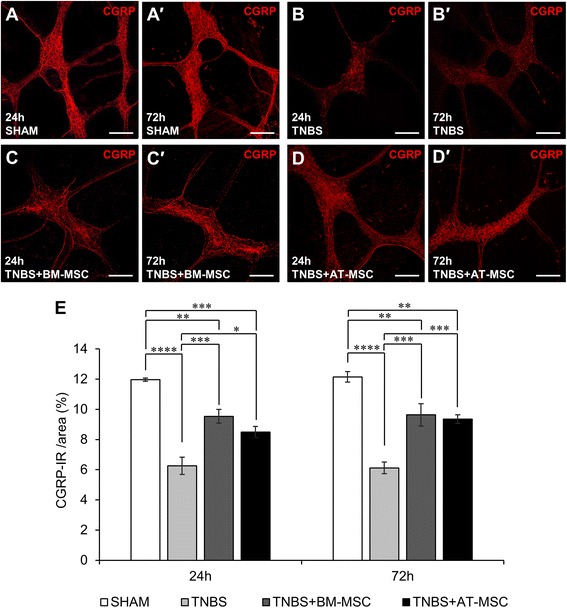
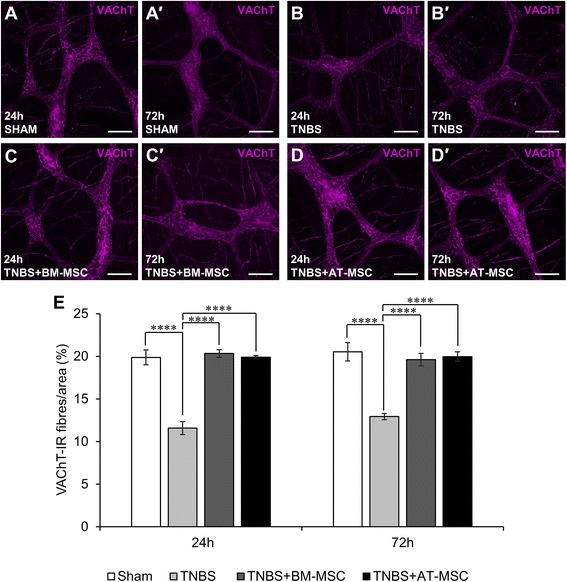
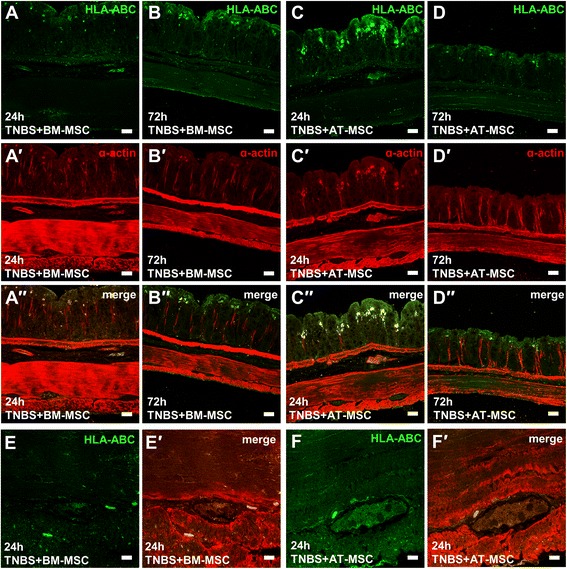
Methods: BM-MSCs and AT-MSCs were validated and characterised in vitro. In in vivo experiments, guinea-pigs received either 2,4,6-trinitrobenzene-sulfonate acid (TNBS) for the induction of colitis or sham treatment by enema. MSCs were administered at a dose of 1x10(6) cells via enema 3 hours after the induction of colitis. Colon tissues were collected 24 and 72 hours after TNBS administration to assess the level of inflammation and damage to the ENS. MSC migration to the myenteric plexus in vivo was elucidated by immunohistochemistry and in vitro using a modified Boyden chamber assay.

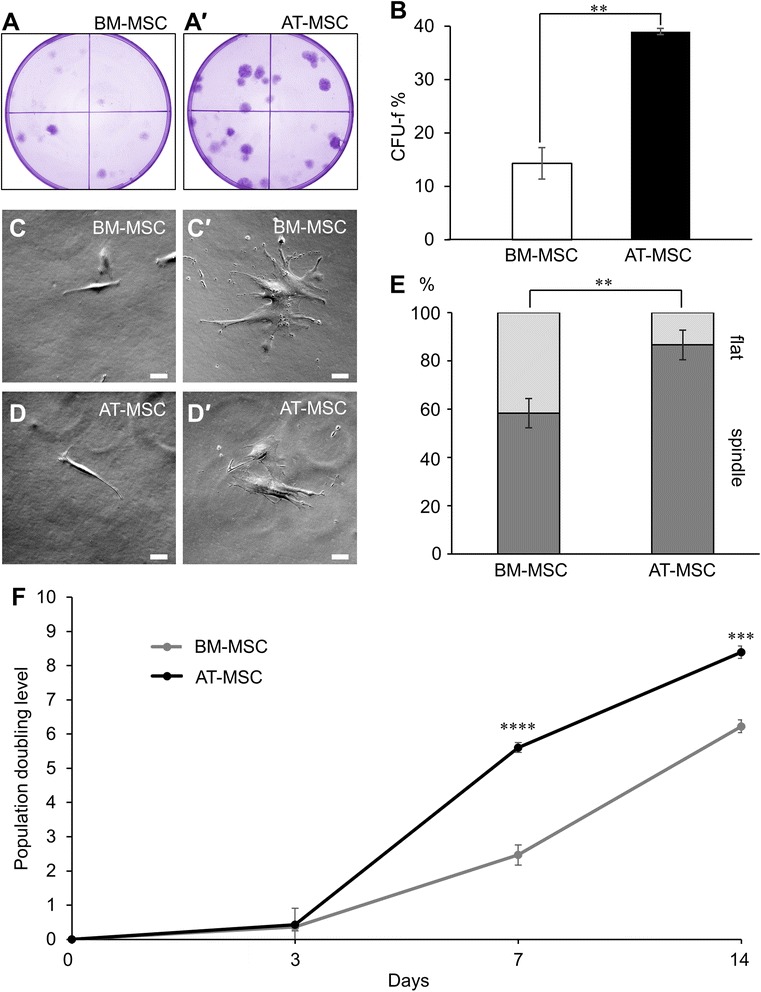
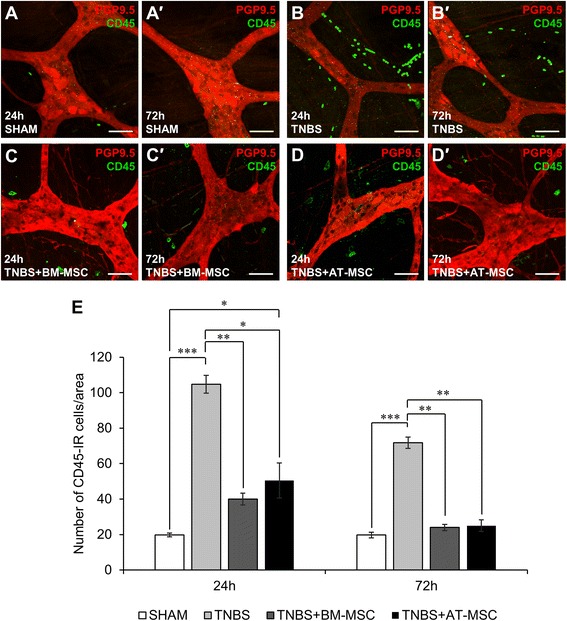
Results: Cells exhibited multipotency and a typical surface immunophenotype for validation as bona fide MSCs. In vitro characterisation revealed distinct differences in growth kinetics, clonogenicity and cell morphology between MSC types. In vivo, BM-MSCs were comparatively more effective than AT-MSCs in attenuating leukocyte infiltration and neuronal loss in the myenteric plexus. MSCs from both sources equally ameliorated body weight loss, gross morphological damage to the colon, changes in the neurochemical coding of neuronal subpopulations and the reduction in density of extrinsic and intrinsic nerve fibres innervating the colon. MSCs from both sources migrated to the myenteric plexus in in vivo colitis and in an in vitro assay.

Conclusions: These data from in vitro experiments suggest that AT-MSCs are ideal for cellular expansion. However, BM-MSCs were more therapeutic in the treatment of enteric neuropathy and plexitis. These characteristics should be considered when deciding on the MSC tissue source.


Figures

Fig. 1
Fig. 1
Phenotypic and functional validation of BM-MSCs and AT-MSCs. a BM-MSCs and AT-MSCs analysed for cell surface antigen expression of known positive (CD29, CD44, CD73, and CD90) and negative (CD34 and CD45) MSC markers. Red closed histograms represent MSCs labelled with antibodies against the surface antigen indicated on the right hand side of each row. Blue open histograms show isotype controls. BM-MSCs b and AT-MSCs b′ adhered to plastic with a perceptible appearance typical of MSCs in culture. Scale bar = 200 μm. BM-MSCs and AT-MSCs cultured without c-d and with c′-d′ adipogenesis differentiation medium for 14 days and stained with Oil red O. Scale bar = 50 μm. BM-MSCs and AT-MSCs cultured without e-f and with e′-f′ osteogenesis differentiation medium for 21 days and stained with Alizarin red S. Scale bar = 200 μm. BM-MSCs bone marrow-derived mesenchymal stem cells, AT-BMCs adipose tissue-derived mesenchymal stem cells
Fig. 2
Fig. 2
In vitro clonogenicity, morphology, and growth kinetics of MSCs. Clonogenicity of BM-MSCs a and AT-MSCs a′ determined by a colony forming unit-fibroblast (CFU-f) assay (n = 3 independent cultures/group). b CFU-f counts quantified as a percentage of the total viable cells seeded. c-d′) Morphological subpopulations exhibited by BM-MSCs c-c′) and AT-MSCs d-d′ in culture. MSC morphology defined according to the presence of long thin spindles (‘spindle’: c-d or flat cells with atypical processes (‘flat’: c′-d′) (scale bar = 50 μm). e Quantitative analysis of MSC morphological types. Data expressed as a percentage of the total cell number in each population (n = 6 independent cultures/group). f) The population doubling level (PDL) of proliferating MSCs recorded at 3, 7 and 14 days after seeding (n = 3 independent cultures/group/time point). **p < 0.01, ***p < 0.001, ****p < 0.0001. MSCs mesenchymal stem cells, BM-MSCs bone marrow-derived mesenchymal stem cells, AT-MSCs adipose tissue-derived mesenchymal stem cells
Fig. 3
Fig. 3
Effects of MSC treatment on histological changes and body weight in colitis. Colonic structure assessed via haematoxylin and eosin staining of cross sections from tissues collected at 24 h a-d and 72 h a′-d′ post TNBS administration. Scale bar = 50 μm. e Body weight recorded at 24, 48 and 72 h after TNBS administration and expressed as the change from baseline measurements. *p < 0.05, **p < 0.01, ***p < 0.001, n = 4 animals/group/time point. MSC mesenchymal stem cell, TNBS 2,4,6-trinitrobenzene-sulfonate acid
Fig. 4
Fig. 4
Effects of MSCs on leukocyte infiltration to the myenteric plexus. a-d′ CD45-IR leukocytes (green) visualised on the level of myenteric neurons labelled with anti-PGP9.5 (red) by confocal microscopy in LMMP wholemounts prepared from colon collected at 24 a-d and 72 h a′-d′ post treatment. Scale bar = 50 μm. e CD45-IR leukocytes quantified in a 2 mm2 area of the myenteric plexus in the colon. *p < 0.05, **p < 0.01, ***p < 0.001, n = 4 animals/group/time point. MSCs mesenchymal stem cells, LMMP longitudinal muscle and myenteric plexus
Fig. 5
Fig. 5
Effects of BM-MSCs and AT-MSCs on the total number of myenteric neurons. a-d′ Neuronal cell bodies in the myenteric plexus were labelled with the pan neuronal marker anti-HuC/D antibody at 24 a-d and 72 h a′-d′ post treatment. Scale bar = 50 μm. e The total number of neuronal bodies were quantified within a 2 mm2 area of the myenteric plexus. *p < 0.05, **p < 0.01, ***p < 0.001, ****p < 0.0001, n = 4 animals/group/time point. BM-MSCs bone marrow-derived mesenchymal stem cells, AT-MSCs adipose tissue-derived mesenchymal stem cells
Fig. 6
Fig. 6
Effects of BM-MSCs and AT-MSCs on nitrergic myenteric neurons. a-d′ Nitrergic (nNOS-IR) neurons were visualised in the myenteric plexus at 24 a-d and 72 h a′-d′. Scale bar = 50 μm. The total number of nNOS-IR neurons e and the proportion of nNOS-IR neurons to the total number of HuC/D-IR neurons f were quantified within a 2 mm2 area of the myenteric plexus in the guinea-pig colon. *p < 0.05, **p < 0.01, ***p < 0.001, ****p < 0.0001, n = 4 animals/group/time point. BM-MSCs bone marrow-derived mesenchymal stem cells, AT-MSCs adipose tissue-derived mesenchymal stem cells
Fig. 7
Fig. 7
Effects of BM-MSCs and AT-MSCs on cholinergic myenteric neurons. a-d′ Cholinergic (ChAT-IR) neurons in the myenteric plexus at 24 a-d and 72 h a′-d′. Scale bar = 50 μm. The total number of ChAT-IR neurons e and the proportion of ChAT-IR neurons to the total number of HuC/D-IR neurons f were quantified within a 2 mm2 area of the myenteric plexus in the guinea-pig colon. *p < 0.05, ***p < 0.001, ****p < 0.0001, n = 4 animals/group/time point. BM-MSCs bone marrow-derived mesenchymal stem cells, AT-MSCs adipose tissue-derived mesenchymal stem cells, ChAT choline acetyltransferase, IR immunoreactive
Fig. 8
Fig. 8
Effects of BM-MSCs and AT-MSCs on CGRP-IR nerve fibres in the myenteric plexus. a-d′ CGRP-IR in the myenteric plexus at 24 h a-d and 72 h a′-d′. Scale bar = 100 μm. e Area percentage quantification of CGRP-IR within a 1 mm2 area of the myenteric plexus in the guinea-pig colon. *p < 0.05, **p < 0.01, ***p < 0.001, ****p < 0.0001, n = 3 animals/group/time point. BM-MSCs bone marrow-derived mesenchymal stem cells, AT-MSCs adipose tissue-derived mesenchymal stem cells, CGRP calcitonin gene-related peptide, IR immunoreactive
Fig. 9
Fig. 9
Effects of BM-MSCs and AT-MSCs on TH-IR nerve fibres in the myenteric plexus. a-d′ TH-IR nerve fibres in the myenteric plexus at 24 h a-d and 72 h a′-d′. Scale bar = 100 μm. e Area percentage quantification of TH-IR nerve fibres within a 1 mm2 area of the myenteric plexus in the guinea-pig colon. *p < 0.05, **p < 0.01, n = 3 animals/group/time point. BM-MSCs bone marrow-derived mesenchymal stem cells, AT-MSCs adipose tissue-derived mesenchymal stem cells, TH tyrosine hydroxylase, IR immunoreactive
Fig. 10
Fig. 10
Effects of BM-MSCs and AT-MSCs on VAChT-IR nerve fibres in the myenteric plexus. a-d′ VAChT-IR nerve fibres in the myenteric plexus at 24 h a-d and 72 h a′-d′. Scale bar = 100 μm. e Area percentage quantification of VAChT-IR nerve fibres within a 1 mm2 area of the myenteric plexus in the guinea-pig colon. ****p < 0.0001, n = 3 animals/group/time point. BM-MSCs bone marrow-derived mesenchymal stem cells, AT-MSCs adipose tissue-derived mesenchymal stem cells, VAChT vesicular acetylcholine transporter, IR immunoreactive
Fig. 11
Fig. 11
In vivo migration of BM-MSCs and AT-MSCs. a-d′′ Cross-sections of the guinea-pig colon after treatment with BM-MSCs a-b and AT-MSCs c-d labelled with anti-HLA a-d to detect human MSCs and anti-α-actin to visualise smooth muscle a′-d′. Scale bar = 50 μm. e′-f′ High magnification confocal images (x100) of myenteric ganglia from BM-MSC e-e′ and AT-MSC-treated guinea-pigs f-f′. Scale bar = 10 μm. BM-MSCs bone marrow-derived mesenchymal stem cells, AT-MSCs adipose tissue-derived mesenchymal stem cells, HLA human leukocyte antigen
Fig. 12
Fig. 12
In vitro migration of BM-MSCs and AT-MSCs. Quantification of MSC migration towards the conditioned media of cultured myenteric plexus (MP) cells pre-stimulated with LPS in a modified Boyden chamber assay. **p < 0.01, ***p < 0.001, ****p < 0.0001, n = 4 independent cultures/group. BM-MSCs bone marrow-derived mesenchymal stem cells, AT-MSCs adipose tissue-derived mesenchymal stem cells, LPS lipopolysaccharide

Similar articles

Cited by

References

    1. Wei X, Yang X, Han ZP, Qu FF, Shao L, Shi YF. Mesenchymal stem cells: a new trend for cell therapy. Acta Pharmacol Sin. 2013;34(6):747–54. doi: 10.1038/aps.2013.50. - DOI - PMC - PubMed
    1. Dominici M, Le Blanc K, Mueller I, Slaper-Cortenbach I, Marini F, Krause D, et al. Minimal criteria for defining multipotent mesenchymal stromal cells. The International Society for Cellular Therapy position statement. Cytotherapy. 2006;8(4):315–7. doi: 10.1080/14653240600855905. - DOI - PubMed
    1. Mosna F, Sensebe L, Krampera M. Human bone marrow and adipose tissue mesenchymal stem cells: a user's guide. Stem Cells Dev. 2010;19(10):1449–70. doi: 10.1089/scd.2010.0140. - DOI - PubMed
    1. Zuk PA, Zhu M, Ashjian P, De Ugarte DA, Huang JI, Mizuno H, et al. Human adipose tissue is a source of multipotent stem cells. Mol Biol Cell. 2002;13(12):4279–95. doi: 10.1091/mbc.E02-02-0105. - DOI - PMC - PubMed
    1. Chamberlain G, Fox J, Ashton B, Middleton J. Concise review: mesenchymal stem cells: their phenotype, differentiation capacity, immunological features, and potential for homing. Stem Cells. 2007;25(11):2739–49. doi: 10.1634/stemcells.2007-0197. - DOI - PubMed

Publication types

MeSH terms

LinkOut - more resources