. 2015 Dec 10:16:262.
doi: 10.1186/s13059-015-0814-y.

Understanding Brassicaceae evolution through ancestral genome reconstruction

Affiliations

Understanding Brassicaceae evolution through ancestral genome reconstruction

Florent Murat et al. Genome Biol. .

Erratum in

Abstract

Background: Brassicaceae is a family of green plants of high scientific and economic interest, including thale cress (Arabidopsis thaliana), cruciferous vegetables (cabbages) and rapeseed.

Results: We reconstruct an evolutionary framework of Brassicaceae composed of high-resolution ancestral karyotypes using the genomes of modern A. thaliana, Arabidopsis lyrata, Capsella rubella, Brassica rapa and Thellungiella parvula. The ancestral Brassicaceae karyotype (Brassicaceae lineages I and II) is composed of eight protochromosomes and 20,037 ordered and oriented protogenes. After speciation, it evolved into the ancestral Camelineae karyotype (eight protochromosomes and 22,085 ordered protogenes) and the proto-Calepineae karyotype (seven protochromosomes and 21,035 ordered protogenes) genomes.

Conclusions: The three inferred ancestral karyotype genomes are shown here to be powerful tools to unravel the reticulated evolutionary history of extant Brassicaceae genomes regarding the fate of ancestral genes and genomic compartments, particularly centromeres and evolutionary breakpoints. This new resource should accelerate research in comparative genomics and translational research by facilitating the transfer of genomic information from model systems to species of agronomic interest.


Figures
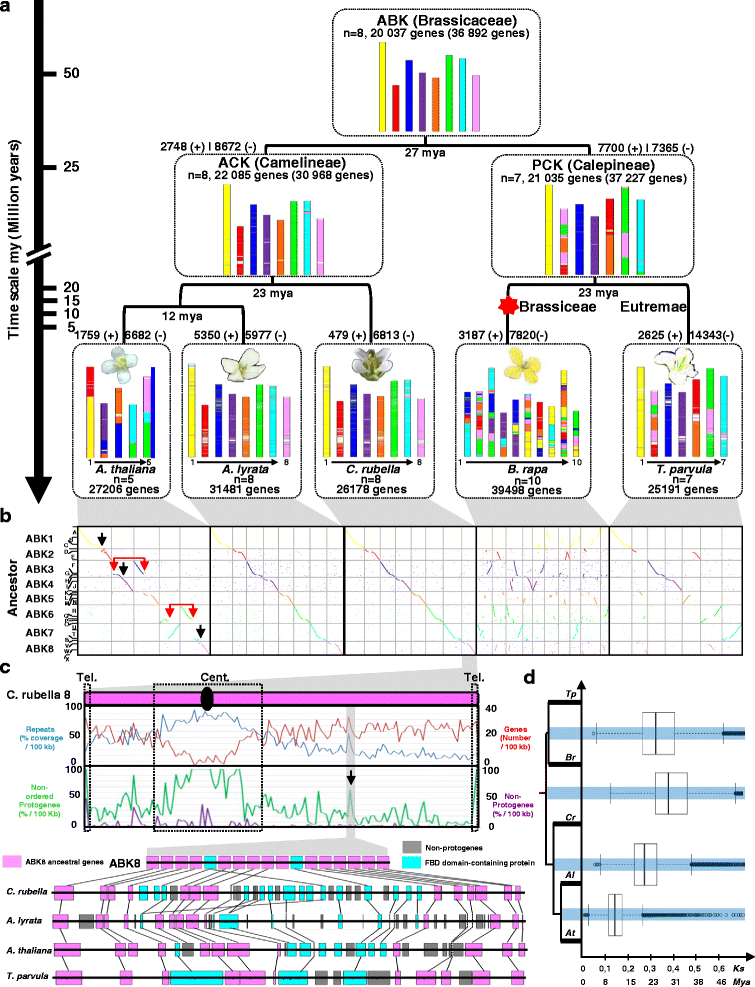
Fig. 1
Fig. 1
Brassicaceae ancestral genomes and evolutionary scenario. a The extant Brassicaceae genomes as a mosaic of colored blocks that illustrate the ABK1–8 protochromosomes. The number of chromosomes and genes in extant species and reconstructed ancestors (with the number of ordered protogenes followed by the total number of protogenes in parentheses) are given in the figure. The gene gain and loss characterized during Brassicaceae evolution are shown as “ + ” and “-”, respectively, on the tree branches associated with a time scale on the right expressed in millions of years (mya). The hexaploidization of B. rapa is illustrated with a red star . b Dot plot representation of the synteny between the ABK1–8 (color code and y axis) and the extant Brassicaceae (A. thaliana, A. lyrata, C. rubella, B. rapa and T. parvula; x axis). The 24 synteny blocks (A–X) according to the ABC system [6] are shown on the ABK1–8 (y axis) chromosomes. Black arrows and red arrows illustrate reciprocal translations leading to ancestral chromosome fusion with centromere loss (chromosome number reduction) or without centromere loss (no reduction in chromosome number), respectively. c Top: Densities (based on 100-kb physical windows) of annotated genes (red curve), repeats (blue curve), non-ordered protogenes (green curve) and non-protogenes (purple curve) for the extant C. rubella chromosome 8 (corresponding to ABK8, pink). Bottom: Microsynteny between A. thaliana, A. lyrata, C. rubella and T. parvula for a non-ordered protogene density peak highlighted with a vertical black arrow in (b). Conserved genes are linked with black connecting lines. Ancestral genes (on ABK protochromosome 8) retained in extant species are shown as pink boxes and non-ancestral genes as gray boxes and tandemly duplicated genes (i.e., FBD domain-containing protein) as light blue boxes. d Substitution rate (Ks) and dating in millions of years (Mya) (x-axis) of the speciation events (blue horizontal lines) between A. thaliana (At), A. lyrata (Al), C. rubella (Cr), B. rapa (Br) and T. parvula (Tp) (y axis) illustrated as dot boxes
Fig. 2
Fig. 2
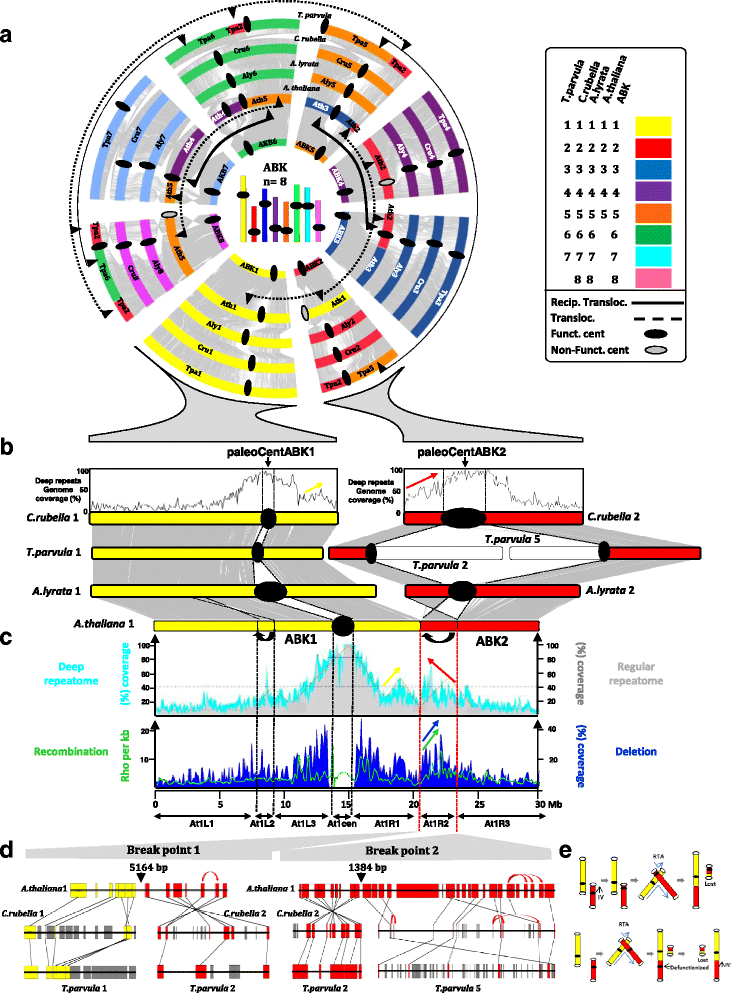
Distribution of repeats in the light of ancestral karyotype history. a Brassicaceae synteny. Schematic representation in circles of the A. thaliana, A. lyrata, C. rubella and T. parvula chromosomes according to a color code (illustrated on the right) highlighting the ancestral chromosome origins (ABK1–8, inner part of circle). Conserved genes between circles are linked with gray connecting lines. Functional and non-functional paleo-centromeres are illustrated as black ellipses and gray ellipses, respectively, on the chromosomes. Translocations and reciprocal translocations are illustrated as plain and dashed black double arrows, respectively. b Synteny between A. thaliana, A. lyrata, C. rubella and T. parvula regarding ABK1 (yellow) and ABK2 (red) protochromosomes where conserved genes are linked with gray connecting lines between extant chromosomes. The repeat density (deep/regular repeatome) is provided for C. rubella chromosomes 1 and 2 (top). c Deep repeatome (as percentage of TE coverage within 100-kb physical windows), regular repeatome (as percentage TE of coverage within 100-kb physical windows), recombination (Rho per kilobase), and deletion (as percentage of coverage within 100-kb physical windows) patterns on A. thaliana chromosome 1 (derived from the fusion of ABK1 and ABK 2, top) are shown as light blue, gray, green and dark blue curves, respectively. Colored arrows are as discussed in the text. d Microsynteny between A. thaliana, C. rubella and T. parvula at two inversion/translocation break points where conserved genes are linked with black connecting lines. Ancestral genes (from ABK1 and ABK2 protochromosomes) retained in extant species are shown as yellow boxes (deriving from ABK1) and red boxes (deriving from ABK2) and non-protogenes are shown as gray boxes. Local gene duplications are illustrated with red arrows. e Two scenarios of A. thaliana chromosome 1 evolution from ABK1 (yellow bars) and ABK2 (red bars). Empty circles and full circles correspond to telomeres and centromeres respectively; arrows indicate inversions and double arrows translocations
Fig. 3
Fig. 3
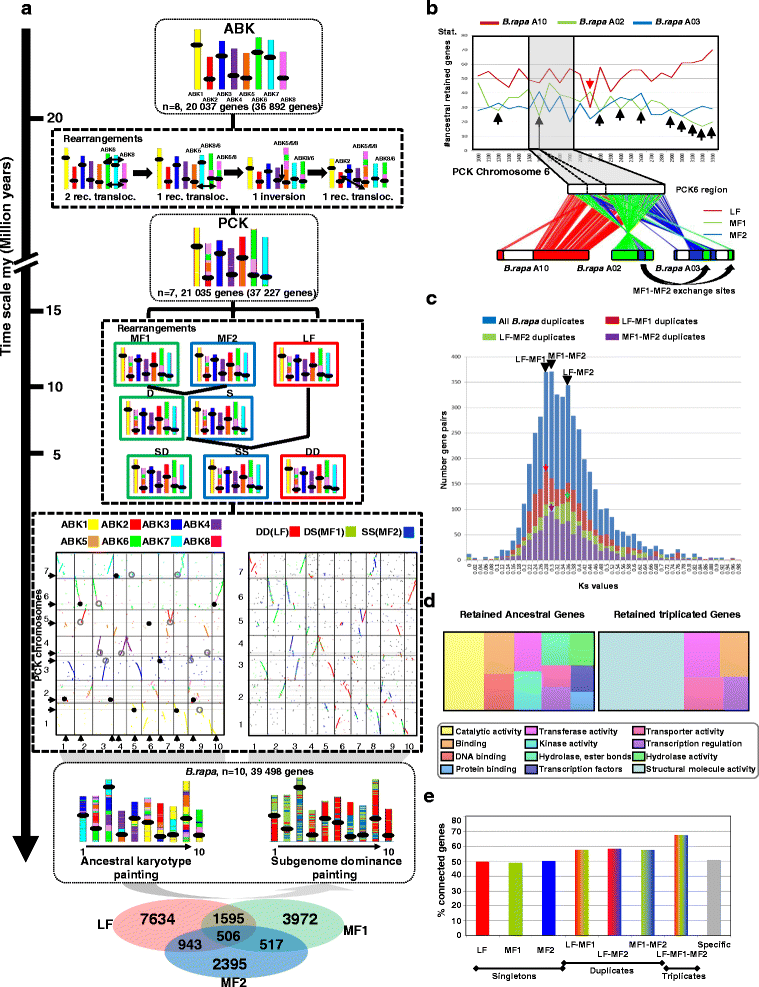
Impact of hexaploidization on the extant B. rapa genome architecture. a Evolution of the extant B. rapa chromosomes from the ABK1–8 (top) and PCK1–7 (center) protochromosomes. Evolutionary rearrangements in the course of the B. rapa paleohistory are detailed in dashed boxes according to a time scale on the right expressed in millions of years. Dot plots of the gene conservation between PCK (y-axis) and B. rapa (x-axis) are provided with a color code reflecting the ABK1–8 protochromosomes (left) and the LF–MF1–MF2 subgenomes (right), with black arrows indicating the modern centromere positions. Retained ancestral centromeres are illustrated as plain black dots whereas lost ancestral centromeres are shown as gray open circles. The extant B. rapa chromosomes (bottom) are illustrated as a mosaic of colored blocks reflecting the ancestral chromosomes (left) and the subgenomes (right) based on the number of ancestral genes retained as singletons, doublets or triplets (Venn diagram), thus defining the LF, MF1 and MF2 compartments. b The number of ancestral genes (from a PCK chromosome 6 region) within 100-gene windows on the post-hexaploidization extant chromosomes 10, 2, and 3 from B. rapa (top). The microsynteny locus between PCK6 and the extant post-hexaploidization relatives is highlighted in gray. The B. rapa chromosome 10 fragment appears entirely dominant (red) whereas B. rapa chromosomes 2 and 3 show exchanges of dominance/sensitivity (green and blue for MF1 and MF2, respectively). c Substitution rate (Ks, x- axis) distribution curves of gene pairs (number on the y-axis) for all detected pairs (blue), pairs located on LF–MF1 (red), LF–MF2 (green) and MF1–MF2 (purple) compartments. Ks distribution peaks are shown with colored arrows as described in the main text. d Gene ontology (GO) analysis of retained ancestral genes (left) and retained triplicated/duplicated genes (right). GO categories significantly enriched compared with the annotated B. rapa genes are illustrated with a color code at the bottom. e Gene connectivity characterization for singletons, retained pairs and retained triplicates in B. rapa. The color code reflects the nature of the considered genes (singletons, duplicates and triplicates) with regard to their physical location: LF (red), MF (green) and MF2 (blue). The grey bar (right) corresponds to the remaining specific genes from B. rapa not considered in the previous classes
Fig. 4
Fig. 4
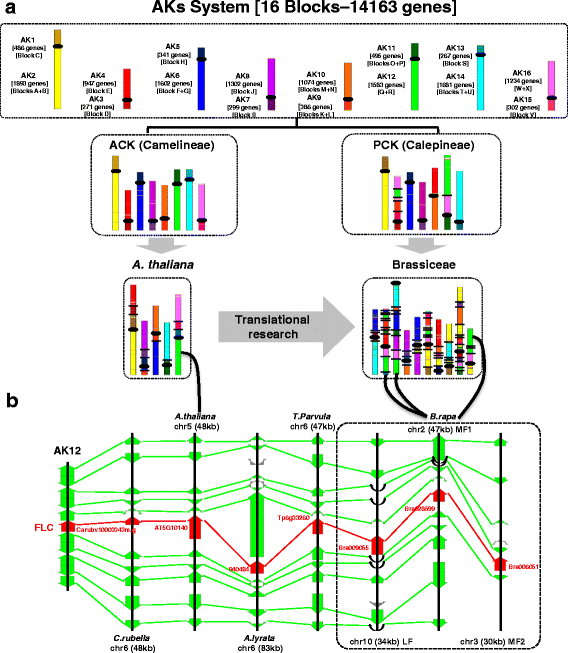
A new ancestral karyotype (AK) system for translational research in Brassicaceae. a Synteny between Camelineae (A. thaliana as extant representative) and Calepineae (B. rapa as extant representative) based on 24 ABC blocks (referred to as blocks A–X; adapted from Schranz et al. [6]) and 16 AK blocks (AK1–16 from the current analysis). The order, orientation and color-coding of the ABC and AK blocks are based on their position in ABK as illustrated in Fig. 1. b Microsynteny at the FLC locus between A. thaliana, C. rubella, A. lyrata, T. parvula and B. rapa based on the ancestral block AK12

Similar articles

Cited by

References

    1. Bailey CD, Koch MA, Mayer M, Mummenhoff K, O’Kane SL, Jr, Warwick SI, et al. Toward a global phylogeny of the Brassicaceae. Mol Biol Evol. 2006;23(11):2142–60. doi: 10.1093/molbev/msl087. - DOI - PubMed
    1. Warwick SI, Mummenhoff K, Sauder CA, Koch MA, Al-Shehbaz IA. Closing the gaps: phylogenetic relationships in the Brassicaceae based on DNA sequence data of nuclear ribosomal ITS region. Plant Systemat Evol. 2010;285:209–32. doi: 10.1007/s00606-010-0271-8. - DOI
    1. Koenig D, Weigel D. Beyond the thale: comparative genomics and genetics of Arabidopsis relatives. Nat Rev Genet. 2015;16(5):285–98. doi: 10.1038/nrg3883. - DOI - PubMed
    1. Initiative AG. Analysis of the genome sequence of the flowering plant Arabidopsis thaliana. Nature. 2000;408(6814):796–815. doi: 10.1038/35048692. - DOI - PubMed
    1. Parkin IA, Gulden SM, Sharpe AG, Lukens L, Trick M, Osborn TC, et al. Segmental structure of the Brassica napus genome based on comparative analysis with Arabidopsis thaliana. Genetics. 2005;171(2):765–81. doi: 10.1534/genetics.105.042093. - DOI - PMC - PubMed

Publication types

LinkOut - more resources