. 2015 Dec 11:4:e09003.
doi: 10.7554/eLife.09003.

A gene-expression screen identifies a non-toxic sumoylation inhibitor that mimics SUMO-less human LRH-1 in liver

Affiliations

A gene-expression screen identifies a non-toxic sumoylation inhibitor that mimics SUMO-less human LRH-1 in liver

Miyuki Suzawa et al. Elife. .

Abstract

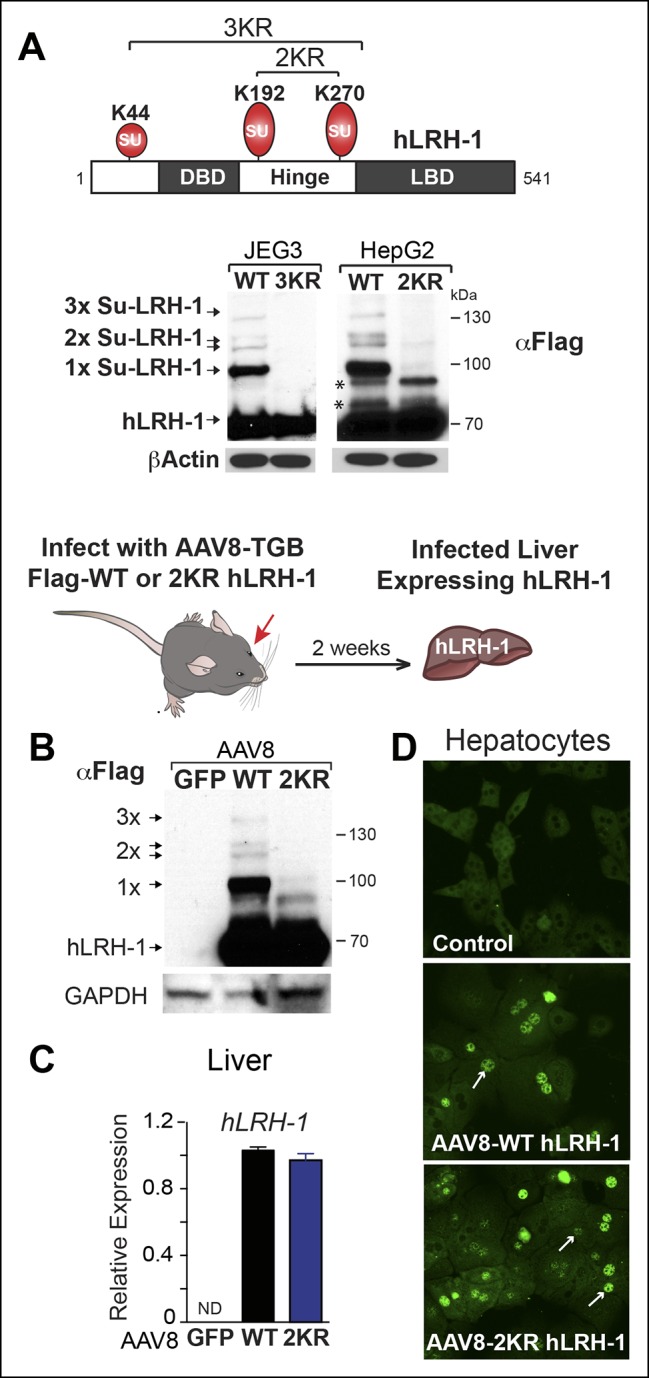
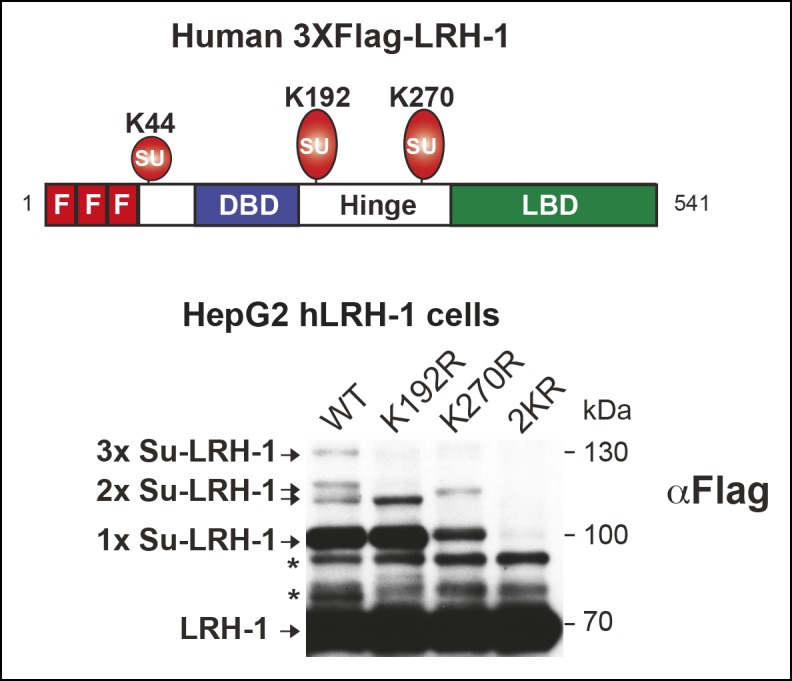
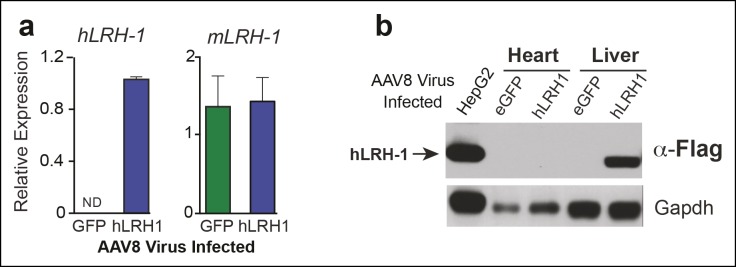
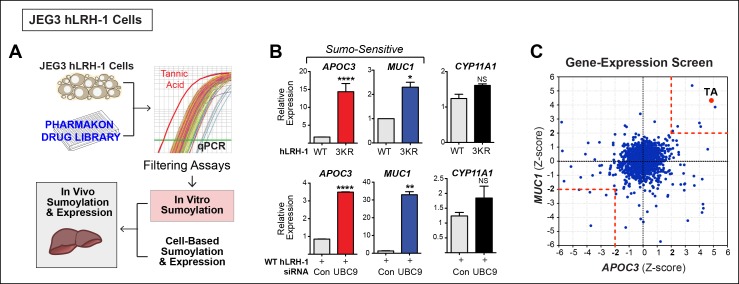
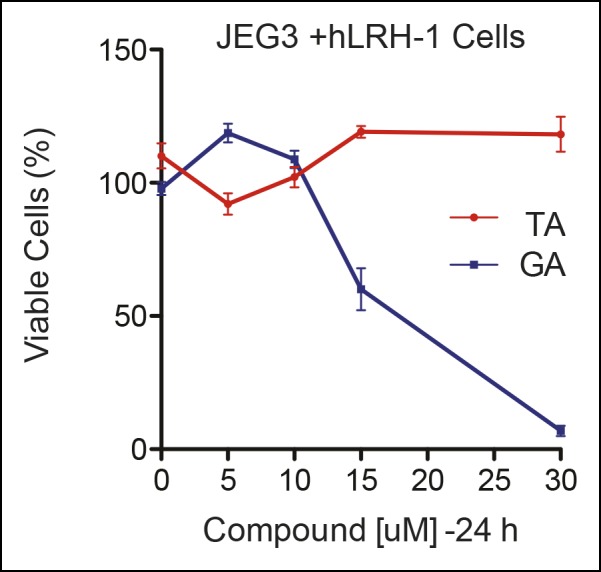
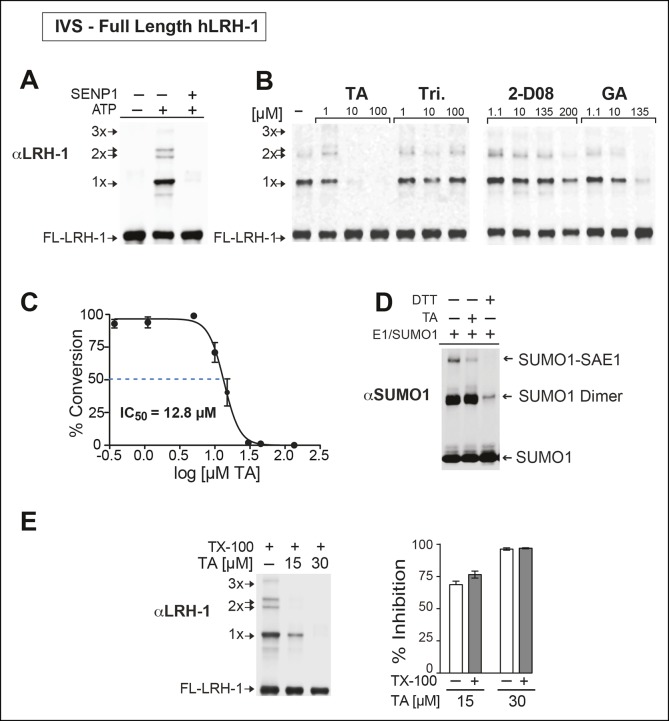
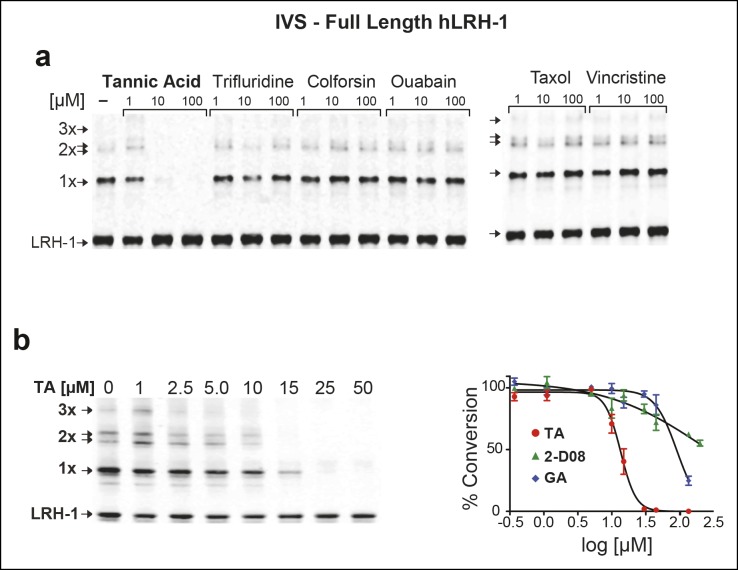
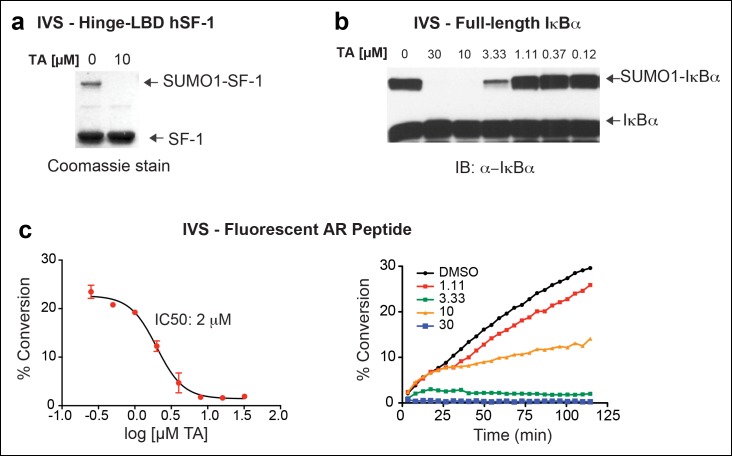
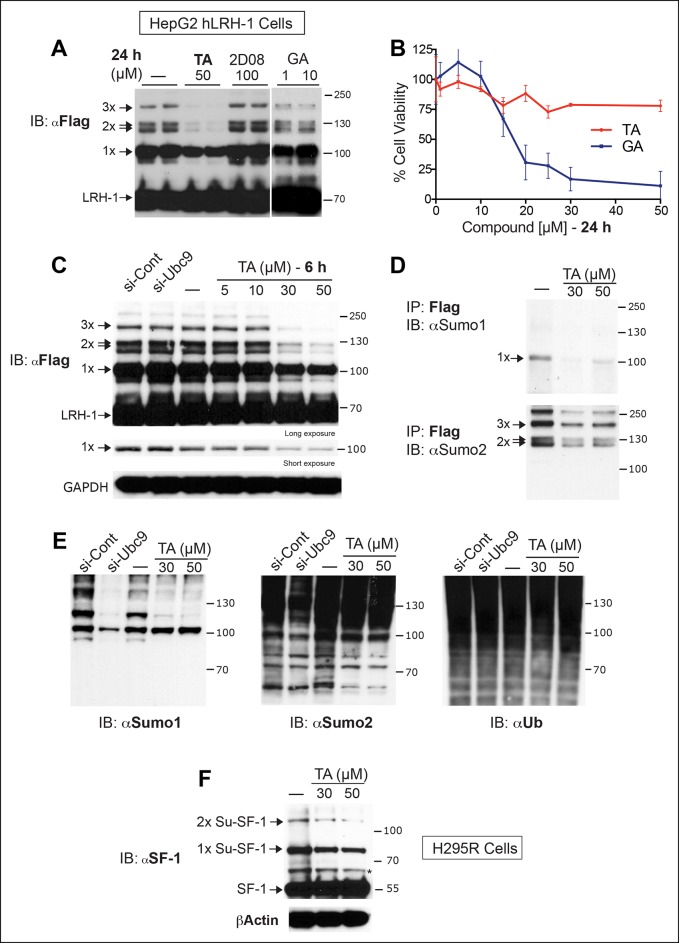
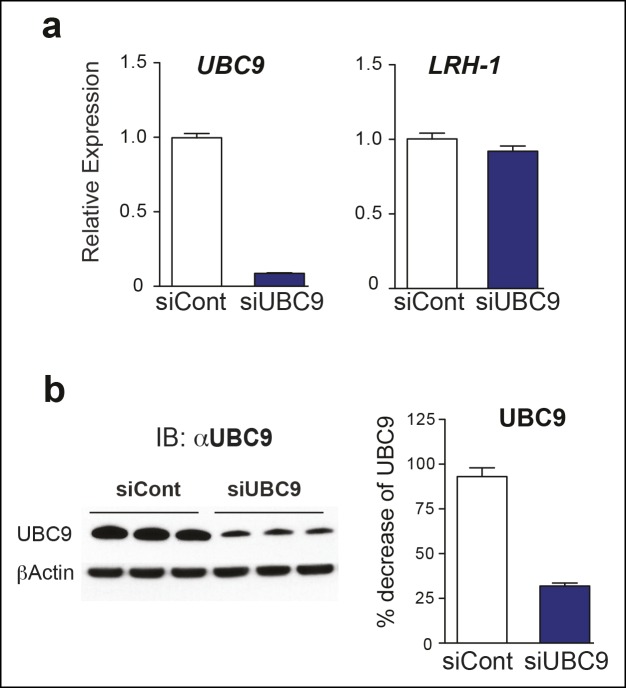
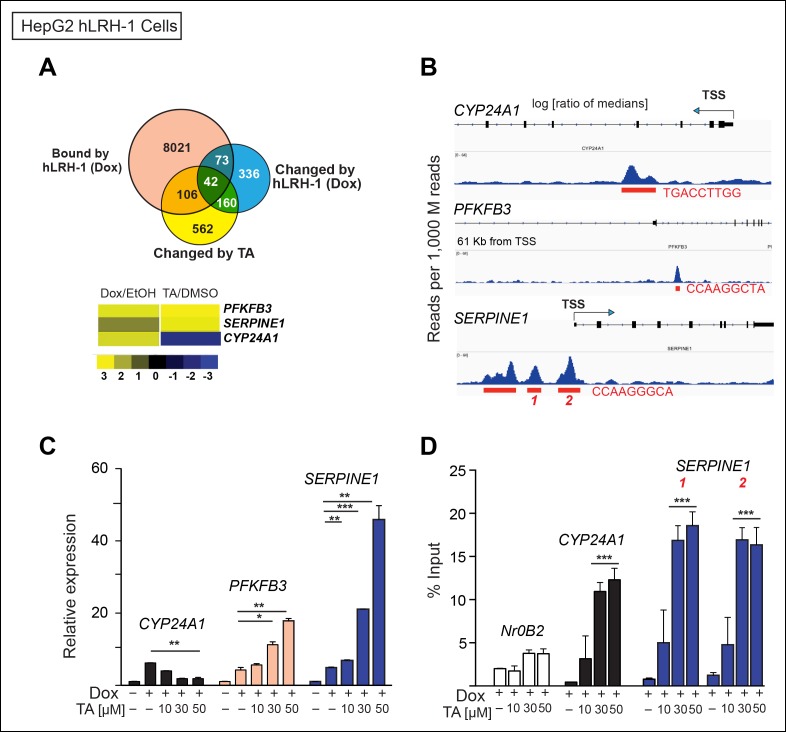
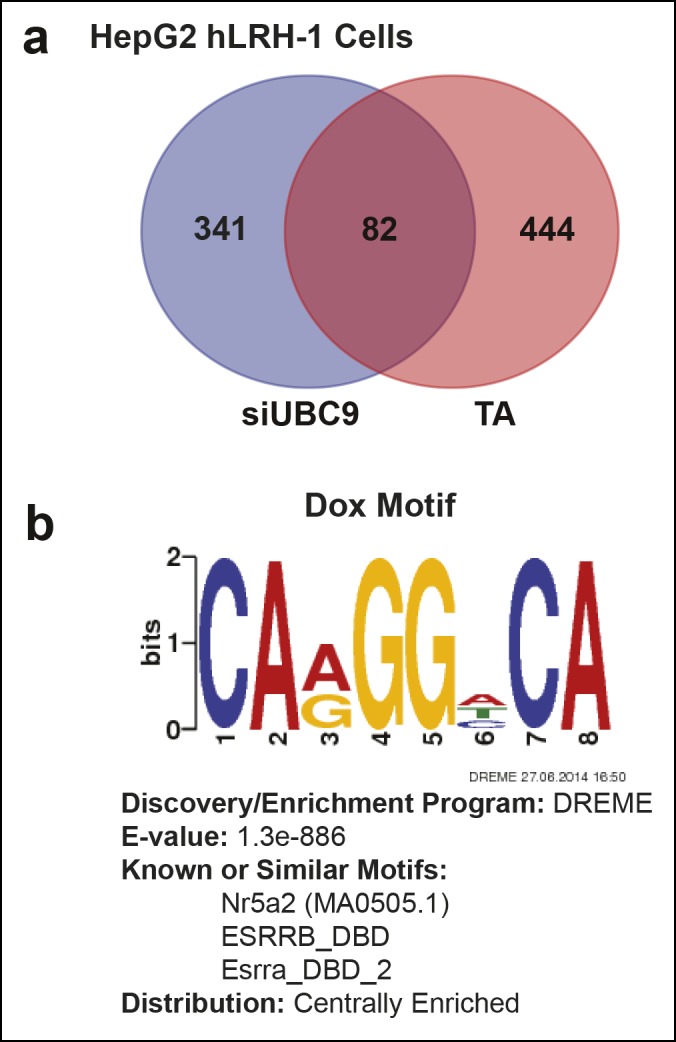
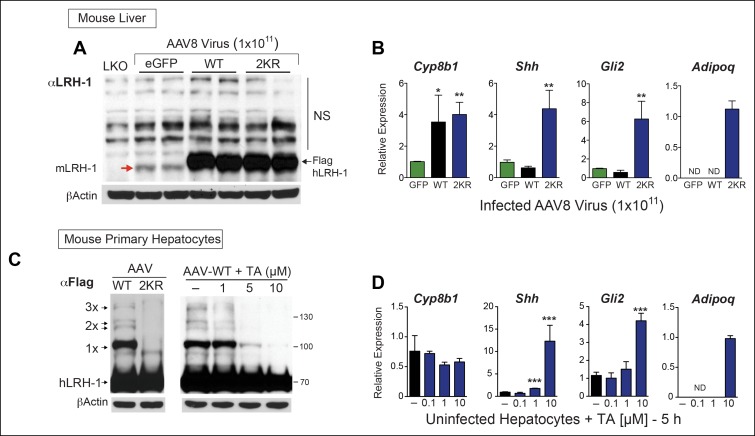
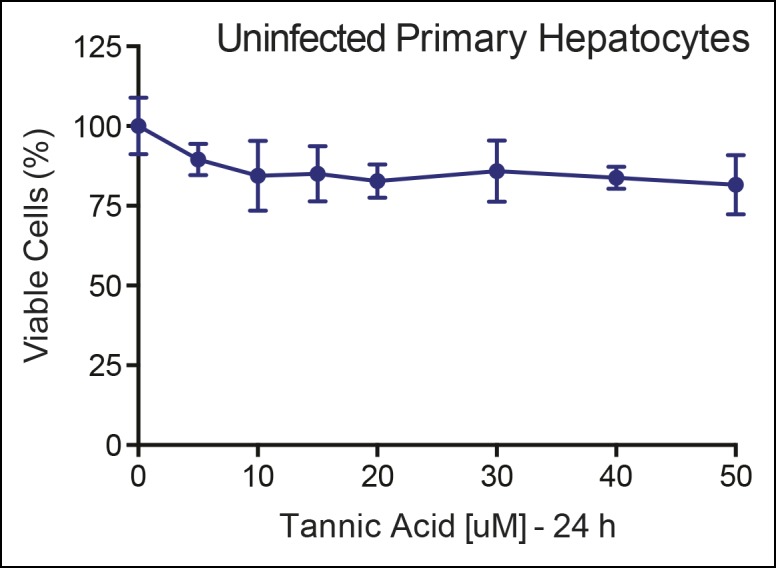
SUMO-modification of nuclear proteins has profound effects on gene expression. However, non-toxic chemical tools that modulate sumoylation in cells are lacking. Here, to identify small molecule sumoylation inhibitors we developed a cell-based screen that focused on the well-sumoylated substrate, human Liver Receptor Homolog-1 (hLRH-1, NR5A2). Our primary gene-expression screen assayed two SUMO-sensitive transcripts, APOC3 and MUC1, that are upregulated by SUMO-less hLRH-1 or by siUBC9 knockdown, respectively. A polyphenol, tannic acid (TA) emerged as a potent sumoylation inhibitor in vitro (IC50 = 12.8 µM) and in cells. TA also increased hLRH-1 occupancy on SUMO-sensitive transcripts. Most significantly, when tested in humanized mouse primary hepatocytes, TA inhibits hLRH-1 sumoylation and induces SUMO-sensitive genes, thereby recapitulating the effects of expressing SUMO-less hLRH-1 in mouse liver. Our findings underscore the benefits of phenotypic screening for targeting post-translational modifications, and illustrate the potential utility of TA for probing the cellular consequences of sumoylation.

Keywords: NASH; NR5As; cell biology; human; human biology; medicine; mouse; phenotypic screen; primary hepatocytes; sumoylation; tannic acid.


Conflict of interest statement

The authors declares that no competing interests exist.

Figures

Figure 1.
Figure 1.. Human LRH-1 is efficiently sumoylated in cells and in vivo.
(A) Schematic of hLRH-1 protein (NR5A2 isoform 1) showing the location of major sumoylation sites at K192 and K270, and the minor K44 site (top panel). WT and SUMO-less forms of hLRH-1 (3KR and 2KR) expressed in JEG3 and HepG2 cells are indicated as detected with anti-Flag antibody. Unsumoylated (hLRH-1) as well as sumoylated hLRH-1 species (1x, 2x, and 3x) are indicated in bottom panel by arrows. Additional bands observed in HepG2 cells that persist after mutating both K192 and K270 are indicated with asterisk (*). Strategy used to humanize mouse liver for expression of wild type or SUMO-less (2KR) hLRH-1. (B) Sumoylated hLRH-1 species detected by anti-Flag in harvested livers after first infecting with AAV8-vectors expressing eGFP, WT or 2KR. (C) Relative transcripts levels of hLRH-1 transcripts in mouse livers infected with recombinant AAV8-vectors expressing eGFP, wild-type hLRH-1 (WT) or SUMO-less hLRH-1 (2KR). (D) Staining for tagged-hLRH-1 as detected by immunofluorescence using anti-Flag (white arrows). Hepatocytes are prepared as described in ‘Materials and methods’ from harvested, perfused livers 2 weeks post retro-orbital viral-mediated infection. DOI: http://dx.doi.org/10.7554/eLife.09003.004
Figure 1—figure supplement 1.
Figure 1—figure supplement 1.. Mutating individual acceptor lysines in hLRH-1 establishes the importance of K192 and K270 in SUMO modification of hLRH-1.
Schematic of hLRH-1 with position of 3X-Flag epitope tag and three sumoylation sites in hLRH-1 (upper panel). Sumoylation pattern in HepG2 cells expressing WT or mutant forms (K192R, K270R, or 2KR) of Flag-Tagged hLRH-1. * = non-specific bands observed in all mutants forms of hLRH-1 in HepG2 cells (lower panel). DOI: http://dx.doi.org/10.7554/eLife.09003.005
Figure 1—figure supplement 2.
Figure 1—figure supplement 2.. Human LRH-1 transcripts and protein are expressed in liver after AAV8-TBG viral infection.
(A) Relative expression of hLRH-1 or endogenous mLrh-1 transcripts in mouse liver 14 days post-infection with either AAV8-eGFP (GFP) or AAV8 hLRH-1 (hLRH-1) at a vector genome titer of 1 x 10¹¹ (genome copies/ml or GC/ml). (B) Human LRH-1 detected by anti-Flag antibody in heart and liver tissue collected from mice expressing Flag-hLRH-1 (hLRH-1) or eGFP as described in ‘Materials and methods’. Human Flag-tagged LRH-1 protein expressed in HepG2 cells is indicated with arrow (far left lane) and loading controls for each sample (Gapdh). DOI: http://dx.doi.org/10.7554/eLife.09003.006
Figure 2.
Figure 2.. A Phenotypic screen identifies TA as a small-molecule sumoylation modulator.
(A) Schematic outline of the primary screen using JEG3 cells expressing wild-type hLRH-1 and downstream filtering steps to identify small molecules that modulate sumoylation. Individual amplification profiles for MUC1 transcripts are shown for each drug treatment using the Pharmakon 1600 library (upper right panel). Highlighted in red is the amplification curve of MUC1 obtained with TA, the top hit from the primary screen. (B) Relative levels of SUMO-sensitive transcripts APOC3, MUC1 and the SUMO-insensitive transcript CYP11A1 in JEG3 cells expressing wild-type hLRH-1 or SUMO-less hLRH-1 (3KR) (top panel). Relative levels of transcripts as above are shown after 72 hr siControl (Con) or siUBC9 (UBC9) treatment in JEG3 cells expressing hLRH-1. Results represent values obtained for triplicate samples. Statistical significance: ****p<0.0001, **p<0.01, *p<0.05. (C) Scatter plot from the primary screen showing normalized Z-scores for APOC3 and MUC1, calculated as described in ‘Materials and methods’. All compounds yielding Z-scores greater than +2 or less than -2 are shown within red dashed boxes. Positive Z-scores correspond to increased expression of transcripts relative to the control housekeeping gene, TBP. The Z-score obtained for TA is indicated as red dot. TA: Tannic acid. DOI: http://dx.doi.org/10.7554/eLife.09003.007
Figure 3.
Figure 3.. TA enhances SUMO-sensitive gene expression in cells.
(A) Relative expression of CYP11A1, APOC3, and MUC1 in JEG3 cells expressing wild-type (WT) hLRH-1 following 24 hr treatment with increasing TA. (B) Relative expression of CYP11A1, APOC3, and MUC1 in JEG3 cells transiently expressing WT or SUMO-less hLRH-1 (3KR) following 6 hr treatment with increasing concentrations of TA as indicated. Vehicle DMSO control is shown (-). (C) Levels of unsumoylated (hLRH-1) and sumoylated hLRH-1 species in JEG3 cells detected with anti-Flag following 5 hr treatment with increasing TA concentrations (1–50 µM). Shorter exposure of 1x-sumoylated hLRH-1 is shown in bottom panel (1×). Vehicle control (DMSO) is shown (-). (D) Levels of unsumoylated (hLRH-1) and sumoylated hLRH-1 species in JEG3 cells detected with anti-Flag after TA, trifluidine (Tri.), 2-D08, and ginkgolic acid (GA) treatment (30 µM each) following 5 hr treatment. Shorter exposure of unsumoylated hLRH-1 (hLRH-1) is shown in bottom panel. (E) Cell viability is shown for JEG3 cells expressing WT hLRH-1 following 5 hr treatment with increasing GA or TA. Statistical significance: ****p<0.0001, *p<0.05.TA: Tannic acid. DOI: http://dx.doi.org/10.7554/eLife.09003.009
Figure 3—figure supplement 1.
Figure 3—figure supplement 1.. Upregulation of APOC3 by TA in JEG3 cells depends on presence of hLRH-1.
Relative levels of endogenous APOC3 in JEG3 cell lines expressing either a control vector (iEV) or wild-type hLRH-1 (WT) after treatment with no (-) or increasing concentrations of TA for 6 hr. TA: Tannic acid. DOI: http://dx.doi.org/10.7554/eLife.09003.010
Figure 3—figure supplement 2.
Figure 3—figure supplement 2.. Significant cell toxicity in JEG3 wtLRH-1 cells after 24 hr treatment with GA but not TA.
Percent cell viability in JEG3 cells expressing wild-type hLRH-1 (JEG3 + hLRH-1) following 24 hr treatment with increasing concentrations of either TA (red) or GA (blue). GA: Ginkgolic acid; TA: Tannic acid. DOI: http://dx.doi.org/10.7554/eLife.09003.011
Figure 4.
Figure 4.. TA is a detergent-resistant inhibitor of substrate sumoylation in vitro.
(A) In vitro sumoylation (IVS) of recombinant full length (FL)-hLRH-1, without ATP, with ATP or with ATP and recombinant SENP1 added to IVS reactions as described in ‘Materials and methods’. (B) IVS assays with increasing tannic acid (TA), trifluidine (Tri.), 2-D08, and ginkgolic acid (GA). Sumoylated and unsumoylated FL-hLRH-1 are indicated with arrows as detected with anti-LRH-1 antibody. (C) IC50 of TA in FL-hLRH-1 IVS assay. Data are represented as mean ± SEM from at least three independent replicates. (D) Formation of E1 thioester with or without TA, in non-reducing conditions (-DTT). Effects of TA (10 µM) on formation of SUMO-E1 complex (SUMO-SAE1, top band) compared to reducing conditions without TA (-DTT, last lane). SUMO1 dimers are formed in non-reducing conditions (SUMO1 Dimer). E1 thioester formation assays are initiated by addition of freshly prepared ATP (10 mM) and described in ‘Materials and methods’. Anti-SUMO1 antibody was used to detect SUMO1 species. (E) Levels of sumoylated and unsumoylated FL-LRH-1 in IVS assay with TA (15 and 30 μM) and in the presence or absence of Triton X-100 in vitro (left panel). Bar graph of quantified data showing percent inhibition of hLRH-1 sumoylation by TA and with or without Triton X-100 (right panel). DOI: http://dx.doi.org/10.7554/eLife.09003.012
Figure 4—figure supplement 1.
Figure 4—figure supplement 1.. Effects of TA, other candidate hits, and published sumoylation inhibitors in an IVS assay of full-length hLRH1.
(A) Dose-dependent inhibition of full-length (FL)-hLRH-1 by TA compared to other top candidate hits from primary screen as assayed by IVS. IVS assay and immunoblotting conditions used to detect hLRH-1 species are described in Materials and Methods. Sumoylated hLRH-1 (1x, 2x, 3x) and unmodified LRH-1 (LRH-1) species are indicated by arrows. (B) IVS assays of FL-hLRH-1 were performed with increasing concentrations of TA are shown (left panel) and plotted as normalized values in graph (right panel). Effects of two other published sumoylation inhibitors, 2-D08 and GA are also shown in graph. IVS data was normalized to DMSO control for each compound, and then plotted as percent conversion per log10 [µM] concentration. Curve fitting of data is described in ‘Materials and methods’. GA: Ginkgolic acid; IVS: In vitro sumoylation; TA: Tannic acid. DOI: http://dx.doi.org/10.7554/eLife.09003.013
Figure 4—figure supplement 2.
Figure 4—figure supplement 2.. IVS of multiple substrates inhibited by TA.
(A) Coomassie staining of recombinant hinge-LBD mSF-1 protein (aa178-462) with DMSO (0) or with 10 µM TA. This protein fragment of mSF-1 contains only one of the two conserved sumoylation consensus sites at K194. Migration of SUMO1-SF-1 and unmodified SF-1 hinge-LBD (SF-1) are indicated by arrows. (B) IVS of full length IκBα without (0) or with increasing concentrations of TA, as indicated, with SUMO-IκBα and unmodified IκBα indicated by arrows. (C) Dose-dependent inhibition of IVS of fluorescently labeled AR peptide by TA with the IC50 provided. Data are plotted as percent conversion versus TA concentration (log10 [µM], left panel). Real-time sumoylation of AR peptide (% Conversion) are plotted at different concentrations of TA (right panel). IVS conditions and detection of AR peptide sumoylation by electrophoretic mobility shift assay are previously described in Kim et al., (2013). IVS: In vitro sumoylation; TA: Tannic acid. DOI: http://dx.doi.org/10.7554/eLife.09003.014
Figure 5.
Figure 5.. TA inhibits exogenous and endogenous NR5A sumoylation, as well as general sumoylation in cells.
(A) Levels of unsumoylated (LRH-1) and sumoylated hLRH-1 species in HepG2 cells detected with anti-Flag following TA, 2-D08, or GA at specified concentrations after 24 hr treatment. Vehicle control (DMSO) is shown (-). (B) Cell viability for HepG2 cells expressing wild-type hLRH-1 following 24 hr treatment with increasing concentrations of GA or TA. (C) Sumoylation of wild-type hLRH-1 expressed in HepG2 cells and detected with anti-Flag after siCont or siUBC9 knockdown for 72 hr (+), and with increasing TA (6 h). Shorter exposure of 1x-sumoylated hLRH-1 is shown in panel below (1x), as well as loading control (GAPDH). Vehicle control (DMSO) is shown (-). (D) Flag-tagged hLRH-1 protein immunoprecipitated by anti-Flag in HepG2 cells treated with vehicle or TA (30 or 50 μM) followed by immunoblot with either anti-SUMO1 (top panel) or anti-SUMO2 (bottom panel). Arrows indicated migration of 1x, 2x, and 3x sumoylated hLRH-1 species. (E) Levels of total sumoylated or ubiquitinated proteins in HepG2 cells following siControl and siUBC9 (72 hr) or TA treatment (6 hr), as detected by anti-SUMO1, -SUMO2, or -ubiquitin. (F) Effects of TA (6 hr) on endogenous SF-1 sumoylation in H295R cells and detected anti-SF-1 antibody. GA: Ginkgolic acid; TA: Tannic acid. DOI: http://dx.doi.org/10.7554/eLife.09003.015
Figure 5—figure supplement 1.
Figure 5—figure supplement 1.. UBC9 transcripts and protein levels following siUBC9 knockdown in HepG2 hLRH-1 cells.
(A) Relative expression of UBC9 (left panel) and hLRH-1 (right panel) in HepG2 cells following 72 hr exposure to siControl (siCont) or siUBC9 as described in ‘Materials and methods’. (B) Immunoblot of UBC9 protein following 72 hr exposure to siCont or siUBC9 with percentage decrease of UBC9 protein shown in bar graph (right panel). DOI: http://dx.doi.org/10.7554/eLife.09003.016
Figure 5—figure supplement 2.
Figure 5—figure supplement 2.. TA attenuates endogenous RanGap sumoylation.
Endogenous sumoylated (Su-RanGap 1x) and unmodified RanGap (RanGap) in HepG2 hLRH-1 cells after siCont, siUBC9, or after TA treatment (6 hr) with concentrations indicated. Note that the anti-RanGap rabbit monoclonal antibody from GeneTex recognizes both 1x Sumoylated RanGap and unmodified RanGap. DOI: http://dx.doi.org/10.7554/eLife.09003.017
Figure 6.
Figure 6.. TA increases expression and promotes hLRH-1 occupancy on target genes.
(A) Venn diagram representing the overlap between transcripts changed by induction of hLRH-1 (+Dox) (Blue) and hLRH-1+TA (+Dox, +TA 30 µM) (Yellow), as well as hLRH-1 binding sites identified by ChIP-Seq in HepG2 cells (+Dox, Orange). Heat map of top three genes from overlapping set of 42 genes: PFKFB3, SERPINE1 (PAI1), and CYP24A1 showing changes after induction of hLRH-1 (Dox/EtOH) and then after TA treatment (TA/DMSO). (B) ChIP-Seq binding profiles of the three hLRH-1 targets from panel A. Representative views for ChIP-Seq peaks called by MACS are shown along with genomic location and consensus sequence of putative hLRH-1 binding sites (red text). (C) Relative expression of three hLRH-1 targets in HepG2 cells from (A and B) before (-Dox) and after induction of hLRH-1 (+Dox) and following treatment with TA for 6 hr. (D) ChIP-qPCR results in HepG2 cells expressing hLRH-1 for regions identified in panel B, with vehicle control (-) and TA (6 hr). Statistical significance for panels C and D: ***p<0.001, **p<0.01, *p<0.05. DOI: http://dx.doi.org/10.7554/eLife.09003.018
Figure 6—figure supplement 1.
Figure 6—figure supplement 1.. Quantification of transcriptional changes in HepG2 cells after TA or siUBC9 treatment and in presence of hLRH-1.
(A) Venn diagram representing overlap between transcriptionally responsive genes by siUBC9 (Blue) or TA (Red); data analyses are described in ‘Materials and methods’. (B) Motif search of HepG2 WT hLRH-1 binding sites as described in ‘Materials and methods’ yields a consensus sequence with the frequency distribution quantified as bits and the E-value (probability). The 8 bp consensus site obtained after Motif search is shown after induction of WT hLRH-1 (+Dox). DOI: http://dx.doi.org/10.7554/eLife.09003.019
Figure 7.
Figure 7.. TA mimics SUMO-less hLRH-1 when expressed in humanized mouse primary hepatocytes.
(A) Relative expression of hLRH-1 in mouse livers 2 weeks post-infection with amount of vector indicated (GC/ml). Hepatic expression of endogenous mouse mLRH-1 (red arrow) in control C57BL/6 mice, in LKO mice (mLRH-1f/f;Alb-Cre), or in C57BL/6 mice 2 weeks post infection with recombinant AAV8-eGFP (eGFP), AAV8-WT-hLRH-1 (WT), or AAV8-2KR-hLRH-1 (2KR) (black arrow). Endogenous mLRH-1 and exogenous hLRH-1 are detected with an anti-LRH-1 antibody. Note that non-specific bands detected with the anti-LRH-1 antibody obscure sumoylated LRH-1 species. (B) Relative expression in mouse liver of the classic LRH-1 target, Cyp8b1 or SUMO-sensitive LRH-1 targets Adipoq and Shh (and its downstream target Gli2) following infection with either AAV8-eGFP, AAV8 hLRH-1 or a SUMO-less AAV8-2KR-hLRH-1. Each bar represents values obtained from three livers. Values below the threshold of detection (qPCR >40 cycles) are indicated as ND. (C) Sumoylation pattern of AAV8 hLRH-1 (WT) and AAV8-2KR hLRH-1 (2KR) in cultured mouse primary hepatocytes (left panel). Sumoylation of hLRH-1 in infected primary mouse hepatocytes treated with increasing TA for 5 hr (right panel). Sumoylated species and unsumoylated Flag-hLRH-1 are indicated by arrows and detected by anti-Flag antibody. (D) Relative expression of genes shown in Panel B measured in uninfected primary mouse hepatocytes treated for 5 hr with increasing concentrations of TA. Statistical significance for panels B and D: **p<0.01, *p<0.01. TA: Tannic acid. DOI: http://dx.doi.org/10.7554/eLife.09003.020
Figure 7—figure supplement 1.
Figure 7—figure supplement 1.. No cellular toxicity in primary hepatocytes by TA.
Cell viability (%) is shown for primary hepatocytes treated with increasing TA concentrations as indicated for 24 h. TA: Tannic acid. DOI: http://dx.doi.org/10.7554/eLife.09003.021

References

    1. Arany Z, Wagner BK, Ma Y, Chinsomboon J, Laznik D, Spiegelman BM. Gene expression-based screening identifies microtubule inhibitors as inducers of PGC-1 and oxidative phosphorylation. Proceedings of the National Academy of Sciences. 2008;105:4721–4726. doi: 10.1073/pnas.0800979105. - DOI - PMC - PubMed
    1. Asano T, Watanabe K, Kubota N, Gunji T, Omata M, Kadowaki T, Ohnishi S. Adiponectin knockout mice on high fat diet develop fibrosing steatohepatitis. Journal of Gastroenterology and Hepatology. 2009;24:1669–1676. doi: 10.1111/j.1440-1746.2009.06039.x. - DOI - PubMed
    1. Bellail AC, Olson JJ, Hao C. SUMO1 modification stabilizes CDK6 protein and drives the cell cycle and glioblastoma progression. Nature Communications. 2014;5 doi: 10.1038/ncomms5234. - DOI - PMC - PubMed
    1. Bertolotto C, Lesueur F, Giuliano S, Strub T, de Lichy M, et al. A SUMOylation-defective MITF germline mutation predisposes to melanoma and renal carcinoma. Nature. 2011;480:94–98. doi: 10.1038/nature10539. - DOI - PubMed
    1. Bogachek MV, Chen Y, Kulak MV, Woodfield GW, Cyr AR, Park JM, Spanheimer PM, Li Y, Li T, Weigel RJ. Sumoylation pathway is required to maintain the basal breast cancer subtype. Cancer Cell. 2014;25:748–761. doi: 10.1016/j.ccr.2014.04.008. - DOI - PMC - PubMed

Publication types