. 2015 Dec 10:3:61.
doi: 10.1186/s40168-015-0128-z.

Relative and contextual contribution of different sources to the composition and abundance of indoor air bacteria in residences

Affiliations

Relative and contextual contribution of different sources to the composition and abundance of indoor air bacteria in residences

Marzia Miletto et al. Microbiome. .

Abstract

Background: The study of the microbial communities in the built environment is of critical importance as humans spend the majority of their time indoors. While the microorganisms in living spaces, especially those in the air, can impact health and well-being, little is known of their identity and the processes that determine their assembly. We investigated the source-sink relationships of airborne bacteria in 29 homes in the San Francisco Bay Area. Samples taken in the sites expected to be source habitats for indoor air microbes were analyzed by 16S rRNA-based pyrosequencing and quantitative PCR. The community composition was related to the characteristics of the household collected at the time of sampling, including the number of residents and pets, activity levels, frequency of cooking and vacuum cleaning, extent of natural ventilation, and abundance and type of vegetation surrounding the building.

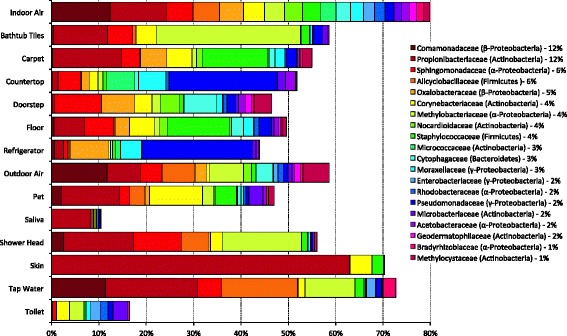
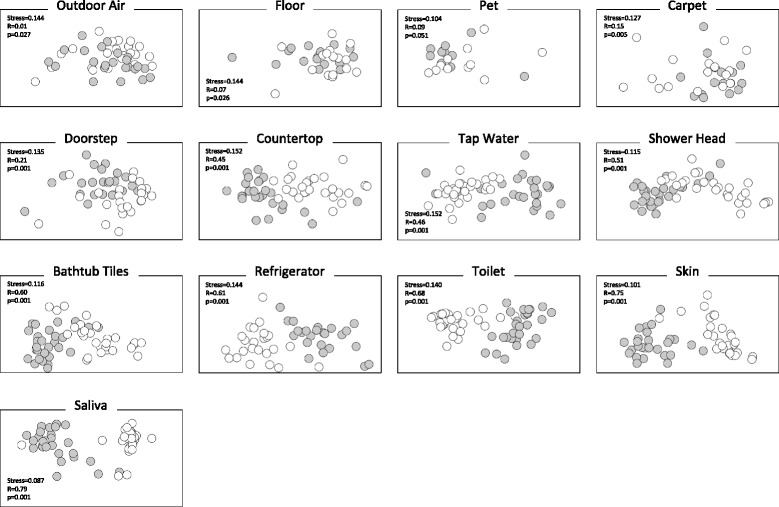
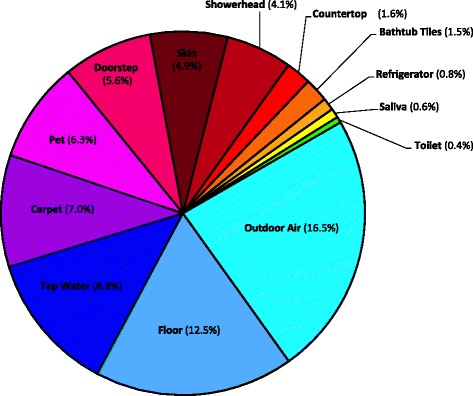
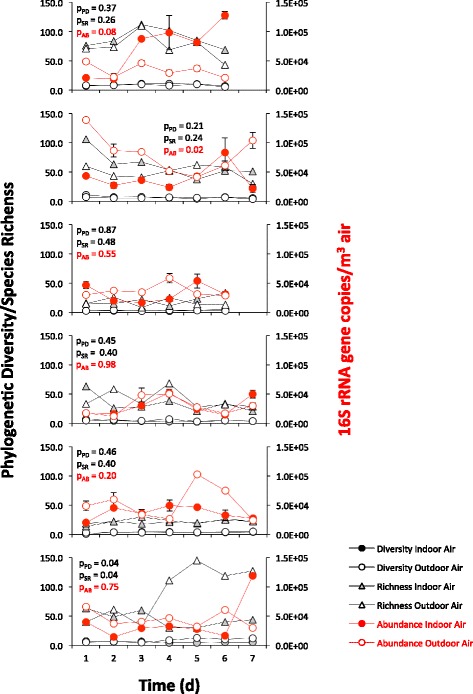
Results: Indoor air harbored a diverse bacterial community dominated by Diaphorobacter sp., Propionibacterium sp., Sphingomonas sp., and Alicyclobacillus sp. Source-sink analysis suggested that outdoor air was the primary source of indoor air microbes in most homes. Bacterial phylogenetic diversity and relative abundance in indoor air did not differ statistically from that in outdoor air. Moreover, the abundance of bacteria in outdoor air was positively correlated with that in indoor air, as would be expected if outdoor air was the main contributor to the bacterial community in indoor bioaerosols. The number of residents, presence of pets, and local tap water also influenced the diversity and size of indoor air microbes. The bacterial load in air increased with the number of residents, activity, and frequency of natural ventilation, and the proportion of bacteria putatively derived from skin increased with the number of residents. Vacuum cleaning increased the signature of pet- and floor-derived bacteria in indoor air, while the frequency of natural ventilation decreased the relative abundance of tap water-derived microorganisms in air.

Conclusions: Indoor air in residences harbors a diverse bacterial community originating from both outdoor and indoor sources and is strongly influenced by household characteristics.


Figures

Fig. 1
Fig. 1
Relative abundance of bacterial communities in indoor air compared to that in potential source environments. Bars correspond to the median percentage in the dataset. The percentage for each taxon in indoor air is noted adjacent to the taxon name. Only the 20 most abundant (ca. 80 % of the total sequences recovered) family-level taxa in indoor air are shown. A complete taxonomic breakdown by genera is available in Additional file 1: Table S1
Fig. 2
Fig. 2
Principal coordinates plot showing the overall variation in bacterial community composition in indoor air and sources. Indoor air bacterial communities in homes (large open circles) show various degrees of overlapping with outdoor-related source environments (closed circles), indoor-related source environments (crosses), and water-related source environments (open circles). Differences in the composition of the bacterial communities were quantified using the unweighted UniFrac distance metric and symbols closer together indicate samples with more similar bacterial communities
Fig. 3
Fig. 3
Pairwise unweighted UniFrac distance between indoor air and source environments visualized on a NMDS plot. Indoor air is represented by open circles, possible source environments by closed circles. Stress as well as ANOSIM R and p values are indicated (999 permutations). An R close to 0 indicates similarity between indoor air microbial communities and the sources; the opposite is true for R close to 1
Fig. 4
Fig. 4
Source environments for indoor air bacterial communities in homes. Sink predictions were determined using SourceTracker. Values represent median contributions across residences of different sources to indoor air. The “unknown source” (sink prediction value of 29.6 %) is not shown. Higher sink prediction values for a source environment indicate a higher proportion of its OTUs in indoor air. The complete set of source-sink predictions values is available in Additional file 4: Table S3
Fig. 5
Fig. 5
Sink prediction (SourceTracker) in indoor air and unweighted UniFrac phylogenetic distance (ANOSIM R) with indoor air for microbial communities in different source environments. Higher sink prediction values for a source environment indicate a higher proportion of its OTUs in indoor air. R values close to 0 indicate similarity between indoor air microbial communities and the sources; the opposite is true for R values close to 1. The statistical significance (p) of the correlation was determined using Spearman’s rank correlation coefficient (ρ)
Fig. 6
Fig. 6
Temporal dynamics of bacterial diversity, bacterial species richness, and bacterial abundance in indoor air and outdoor air. Bacterial diversity (Faith’s phylogenetic diversity) is indicated by black circles (indoors: closed markers; outdoors: open markers). Species richness is indicated by grey triangles (indoors: closed markers; outdoors: open markers). Bacterial abundance in indoor air (red closed circles) and outdoor air (red open circles) was quantified by counting the 16S rRNA gene copies in a cubic meter of air. The t test statistics was used to test the null hypothesis that there is no difference between the bacterial diversity (p PD), species richness (p SR), and abundance (p A) in indoor air compared to outdoor air (a p value ≥0.05 confirms the null hypothesis)
Fig. 7
Fig. 7
Correlation between the taxonomic distance or abundance and geographic distance for indoor air (a) and outdoor air (b) bacterial communities. The taxonomic distance was determined using unweighted UniFrac metrics. The distance in abundance data was determined using Bray-Curtis dissimilarity. The statistical significance was determined using the Mantel r statistics (999 permutations)
Fig. 8
Fig. 8
Relationship between the abundance of bacteria in outdoor air and the abundance of bacteria in indoor air (black markers) and the sink predictions for outdoor air (red markers). Bacterial abundance was estimated counting the 16S rRNA gene copy number in a cubic meter of air. The sink prediction for outdoor air was calculated using SourceTracker. The statistical significance (p) of the correlation was determined using Spearman’s rank correlation coefficient (ρ)

Similar articles

Cited by

References

    1. THMP Consortium Structure, function and diversity of the healthy human microbiome. Nature. 2012;486(7402):207–14. doi: 10.1038/nature11234. - DOI - PMC - PubMed
    1. Dannemiller KC, Gent JF, Leaderer BP, Peccia J. Influence of housing characteristics on bacterial and fungal communities in homes of asthmatic children. Indoor Air. 2015 - PMC - PubMed
    1. Berg G, Mahnert A, Moissl-Eichinger C. Beneficial effects of plant-associated microbes on indoor microbiomes and human health? Front Microbiol. 2014;5:15. - PMC - PubMed
    1. Song SJ, Lauber C, Costello EK, Lozupone CA, Humphrey G, Berg-Lyons D, et al. Cohabiting family members share microbiota with one another and with their dogs. Elife. 2013;2:e00458. - PMC - PubMed
    1. Holinger EP, Ross KA, Robertson CE, Stevens MJ, Harris JK, Pace NR. Molecular analysis of point-of-use municipal drinking water microbiology. Water Res. 2014;49:225–35. doi: 10.1016/j.watres.2013.11.027. - DOI - PubMed

Publication types

MeSH terms

Substances