Review
. 2016 Feb;4(2):174-86.
doi: 10.1016/S2213-8587(15)00419-2. Epub 2015 Dec 2.

Sweetening of the global diet, particularly beverages: patterns, trends, and policy responses

Affiliations
Review

Sweetening of the global diet, particularly beverages: patterns, trends, and policy responses

Barry M Popkin et al. Lancet Diabetes Endocrinol. 2016 Feb.

Abstract

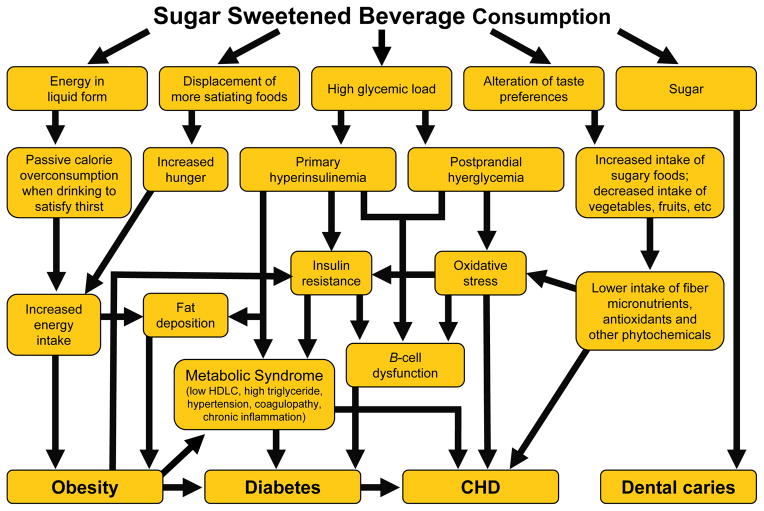
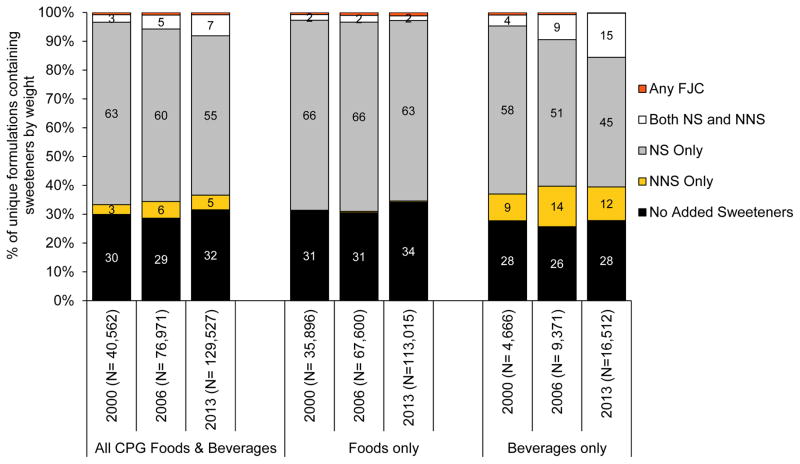
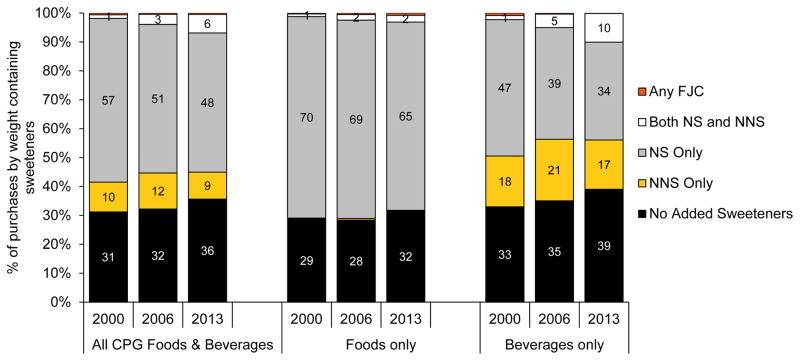
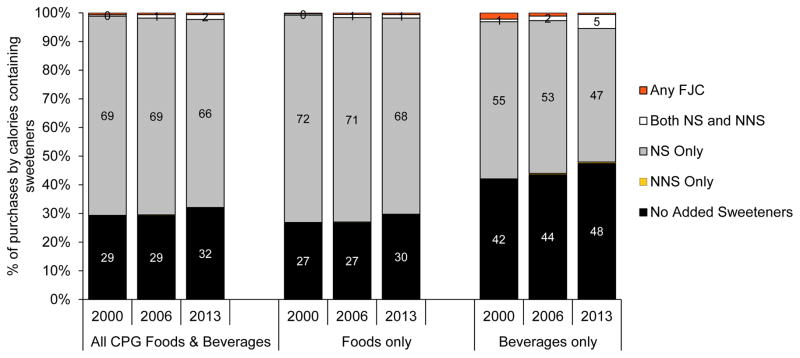
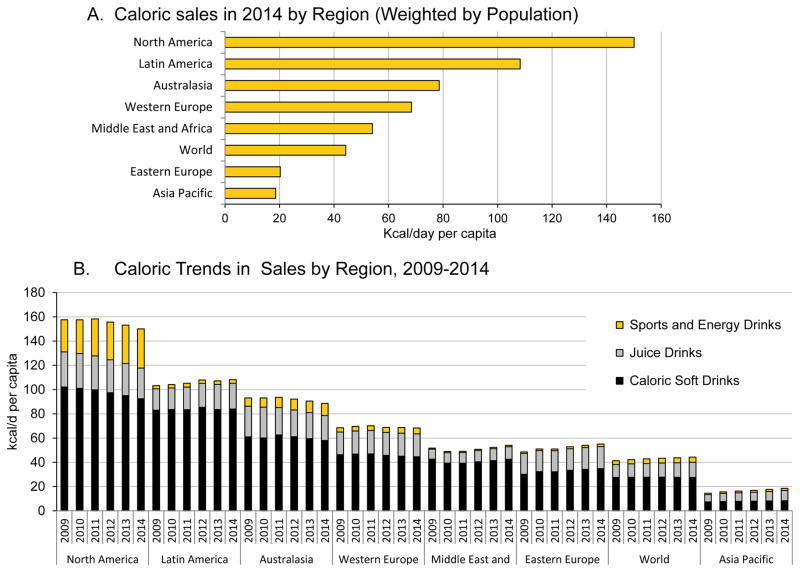
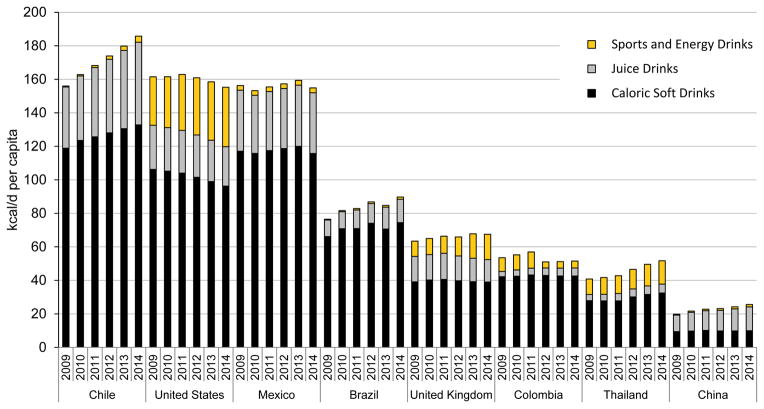
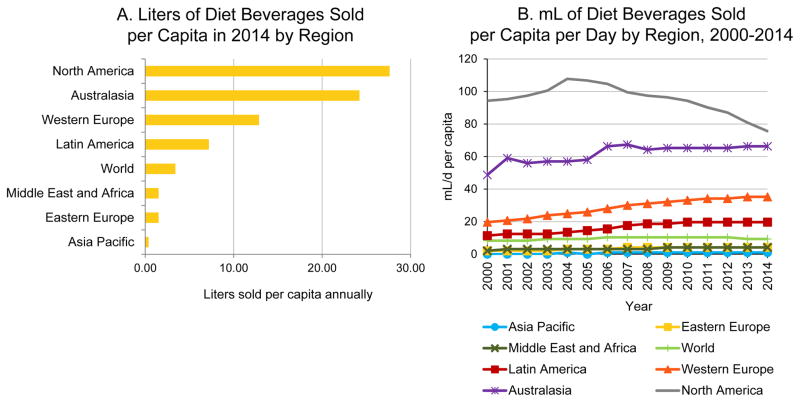
Evidence suggests that excessive intake of added sugars has adverse effects on cardiometabolic health, which is consistent with many reviews and consensus reports from WHO and other unbiased sources. 74% of products in the US food supply contain caloric or low-calorie sweeteners, or both. Of all packaged foods and beverages purchased by a nationally representative sample of US households in 2013, 68% (by proportion of calories) contain caloric sweeteners and 2% contain low-calorie sweeteners. We believe that in the absence of intervention, the rest of the world will move towards this pervasiveness of added sugars in the food supply. Our analysis of trends in sales of sugar-sweetened beverages around the world, in terms of calories sold per person per day and volume sold per person per day, shows that the four regions with the highest consumption are North America, Latin America, Australasia, and western Europe. The fastest absolute growth in sales of sugar-sweetened beverages by country in 2009-14 was seen in Chile. We believe that action is needed to tackle the high levels and continuing growth in sales of such beverages worldwide. Many governments have initiated actions to reduce consumption of sugar-sweetened beverages in the past few years, including taxation (eg, in Mexico); reduction of their availability in schools; restrictions on marketing of sugary foods to children; public awareness campaigns; and positive and negative front-of-pack labelling. In our opinion, evidence of the effectiveness of these actions shows that they are moving in the right direction, but governments should view them as a learning process and improve their design over time. A key challenge for policy makers and researchers is the absence of a consensus on the relation of beverages containing low-calorie sweeteners and fruit juices with cardiometabolic outcomes, since decisions about whether these are healthy substitutes for sugar-sweetened beverages are an integral part of policy design.


Conflict of interest statement

None of the authors have conflict of interests of any type with respect to this manuscript.

Figures

Figure 1
Figure 1
Pathways Linking Sugar-Sweetened Beverage Intake with Health Source: copyright, D. Ludwig & W Willett, Harvard SPH, 2009
Figure 2
Figure 2
The % of Uniquely Formulated Foods and Beverages in the US Food Supply Containing Sweeteners (Mutually Exclusive Categories) NS= Nutritive/Caloric Sweetener, NNS= Non-nutritive/non-caloric sweetener, FJC= Fruit Juice Concentrate (excluding lemon/lime and when reconstituted) (not for use or quotation)
Figure 3
Figure 3
% of Uniquely Formulated CPG Purchases by Weight in Grams Containing Sweeteners (Weighted to be Nationally Representative) NS= Nutritive/Caloric Sweetener, NNS= Non-nutritive/non-caloric sweetener, FJC= Fruit Juice Concentrate (excluding lemon/lime and when reconstituted) (not for use or quotation)
Figure 4
Figure 4
% of CPG Purchases by Calories Containing Sweeteners Weighted to be Nationally Representative (Excludes Low Calorie Sweeteners by Using Kcal) NS= Nutritive/Caloric Sweetener, NNS= Non-nutritive/non-caloric sweetener, FJC= Fruit Juice Concentrate (excluding lemon/lime and when reconstituted) (not for use or quotation)
Figure 5
Figure 5
Daily Calories Sold per Capita per Day from All Sugar-Sweetened Beverages Source: Euromonitor Passport International with country-specific kcal data added (not for use or quotation). Only caloric beverages included)
Figure 6
Figure 6
Calories Sold per Capita per Day from all Sugar-Sweetened Beverage by Country, 2009–2014 Source: Euromonitor Passport International with country-specific kcal data added (not for use or quotation). Only caloric beverages included
Figure 7
Figure 7
Diet beverages with only low calorie sweeteners
Figure 8
Figure 8
Countries with Taxes: Calories Sold per Capita per Day from Sugar-Sweetened Beverage by Country, 2009–2014 Source: Euromonitor Passport International with country-specific kcal data added (not for use or quotation). Only caloric beverages included

References

    1. Ng SW, Ni Mhurchu C, Jebb SA, Popkin BM. Patterns and trends of beverage consumption among children and adults in Great Britain, 1986–2009. British Journal of Nutrition. 2012;108(03):536–51. - PMC - PubMed
    1. Sanigorski AM, Bell AC, Swinburn BA. Association of key foods and beverages with obesity in Australian schoolchildren. Public Health Nutrition. 2007;10(2):152–7. - PubMed
    1. Bray GA, Popkin BM. Dietary sugar and body weight: have we reached a crisis in the epidemic of obesity and diabetes?: health be damned! Pour on the sugar. Diabetes Care. 2014;37(4):950–6. - PMC - PubMed
    1. Hu FB. Resolved: there is sufficient scientific evidence that decreasing sugar-sweetened beverage consumption will reduce the prevalence of obesity and obesity-related diseases. Obesity Reviews. 2013;14(8):606–19. - PMC - PubMed
    1. The Lancet D, amp, Endocrinology. Sugar intake: lowering the bar. The Lancet Diabetes & Endocrinology. 3(5):305. - PubMed

Publication types

Substances