. 2016 Feb 12;291(7):3569-80.
doi: 10.1074/jbc.M115.678995. Epub 2015 Dec 10.

Molecular Determinants of Kv1.3 Potassium Channels-induced Proliferation

Affiliations

Molecular Determinants of Kv1.3 Potassium Channels-induced Proliferation

Laura Jiménez-Pérez et al. J Biol Chem. .

Abstract

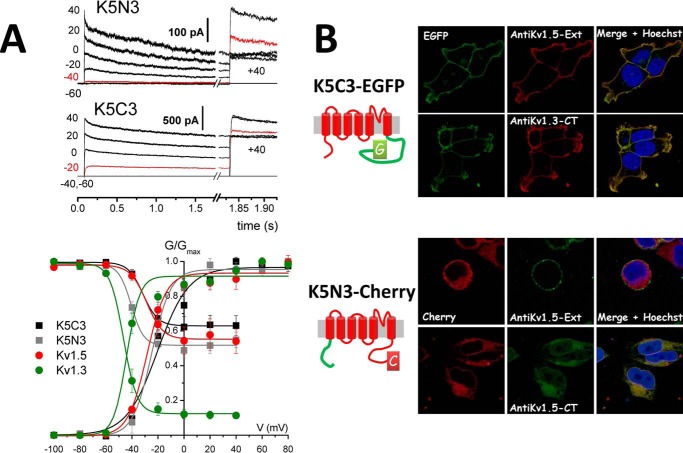
Changes in voltage-dependent potassium channels (Kv channels) associate to proliferation in many cell types, including transfected HEK293 cells. In this system Kv1.5 overexpression decreases proliferation, whereas Kv1.3 expression increases it independently of K(+) fluxes. To identify Kv1.3 domains involved in a proliferation-associated signaling mechanism(s), we constructed chimeric Kv1.3-Kv1.5 channels and point-mutant Kv1.3 channels, which were expressed as GFP- or cherry-fusion proteins. We studied their trafficking and functional expression, combining immunocytochemical and electrophysiological methods, and their impact on cell proliferation. We found that the C terminus is necessary for Kv1.3-induced proliferation. We distinguished two residues (Tyr-447 and Ser-459) whose mutation to alanine abolished proliferation. The insertion into Kv1.5 of a sequence comprising these two residues increased proliferation rate. Moreover, Kv1.3 voltage-dependent transitions from closed to open conformation induced MEK-ERK1/2-dependent Tyr-447 phosphorylation. We conclude that the mechanisms for Kv1.3-induced proliferation involve the accessibility of key docking sites at the C terminus. For one of these sites (Tyr-447) we demonstrated the contribution of MEK/ERK-dependent phosphorylation, which is regulated by voltage-induced conformational changes.

Keywords: Kv1.3; cell proliferation; electrophysiology; membrane potential; mutagenesis; potassium channel; structure-function; tyrosine phosphorylation; voltage-dependent conformation.


Figures

FIGURE 1.
FIGURE 1.
Functional expression of K5N3 and K5C3 chimeras. A, representative traces of K5N3 and K5C3 currents evoked by a steady-state inactivation protocol in transfected cells. A family of 1.8-s depolarizing pulses from −60 to +40 mV (as indicated in the y axis) was followed by a 200-ms depolarizing pulse to +40. The peak current amplitude in the prepulse was used to construct activation curves, whereas the amplitude of the pulse at +40 mV was plotted as a function of the voltage of the prepulse to create the inactivation curves. The trace elicited by the voltage closest to the inactivation V0.5 is depicted in red. The lower panel shows average, normalized conductance-voltage relationships and Boltzmann fits for activation and inactivation obtained from Kv1.3-, Kv1.5-, K5C3-, and K5N3-transfected cells. Data are represented as the mean ± S.E. of 7–11 cells. B, confocal images obtained in HEK293 cells transfected with vectors expressing K5C3-EGFP and K5N3-Cherry chimeric vectors. The left panels show the fluorescence of the fusion protein, the middle panels show the antibody labeling, and the right panels show the merged images with Hoechst to see nuclear staining (blue). Membrane expression was determined in nonpermeabilized cells with an extracellular anti-Kv1.5 antibody (shown in red for K5C3 and in green for K5N3). Subcellular expression was determined in permeabilized cells by using antibodies against the cytoplasmic C terminus (CT), an anti-Kv1.3-CT antibody (red) and an anti-Kv1.5-CT antibody (green), respectively. Constructs are depicted on the left schemes.
FIGURE 2.
FIGURE 2.
Dose-response curves for the effect of DPO on K5N3 and K5C3 currents. A, the plots show the current amplitude at the end of depolarizing pulses to +40 mV from a holding potential of −80 mV, applied every 10 s, from a HEK cell transfected with K5N3 (upper graph) or with K5C3 (lower graph). DPO was applied to the bath solution at the concentrations indicated (in μm) during the time marked. The insets show sample current traces at the different DPO concentrations. B, normalized dose-response curves obtained for the inhibitory effect of DPO on the current amplitude in both chimeric channels as well as in Kv1.5 (open circles). Each data point is the mean ± S.E. of 9–18 cells. The lines show the fit of the data from K5N3 and K5C3 channels to a Hill function (IC50 = 0.66 μm for K5C3 and 0.26 μm for K5N3).
FIGURE 3.
FIGURE 3.
Effects of K5N3 and K5C3 channels on HEK cell proliferation. A, proliferation rate of HEK cell transfected with GFP-expressing vector (used as control) or with the indicated channels was determined by measuring the fraction of cells incorporating EdU reagent after 30 min of incubation in media with 5% FBS. Each bar is the mean ± S.E. n = 12–15. Data were from at least four different experiments. Comparisons were carried out with a one-way ANOVA and Tukey's HSD test as post hoc analysis, and significant differences with control and GFP-transfected cells are shown. *, p < 0.05; **, p < 0.01. B, representative examples of family of currents elicited by 500-ms depolarizing pulses from −80 to +60 mV in 20 mV from a HEK cell expressing K5N3 alone or together with the chaperone subunit Kvβ2.1. In addition to the increased current amplitude, there was a leftward shift in the voltage dependence of activation upon Kvβ2.1 coexpression. The data are representative of seven cells in each group. C, the changes in the current density of K5N3 channels do not modify their effect on proliferation. The plot shows the inhibition of proliferation (left bars; n = 4) and the current density at +40 mV (right plot; n = 8–15) from whole cell experiments of HEK293 expressing Kv1.5, K5N3, and K5N3+Kvβ2.1. Statistical differences from control (Kv1.5) were calculated with a Kruskal-Wallis test followed by a pairwise MWW with Bonferroni correction. pF, picofarads.
FIGURE 4.
FIGURE 4.
Characterization of the effects on proliferation of Kv1.3 COOH terminus point mutants. The schematic shows the position in the C terminus of Kv1.3 of the phosphorylatable residues (in red) that have been mutated to alanine. Also, AMP kinase and the insulin receptor kinase putative motifs are indicated as well as the YS segment. Conserved residues in the C terminus of Kv1.3 are underlined. The upper panel shows EdU incorporation assay of HEK293 cells transfected with each point mutant channels using Cherry and Kv1.3 expressing cells as controls. Each bar is the mean ± S.E. (n = 6–20 determinations from 3–7 different experiments). *, p < 0.05 compared with Kv1.3; #, p < 0.05 compared with Cherry, pairwise MWW with Bonferroni correction. The lower plot shows the current density at +40 mV obtained from whole-cell experiments (n = 5–8 cells).
FIGURE 5.
FIGURE 5.
Characterization of the Kv1.3 and Kv1.5 mutant channels containing the YS segment. A, average normalized activation and inactivation curves are shown as conductance-voltage relationships for Kv1.3, Kv1.5, the truncated Kv1.3-YS channel, and the chimeras Kv1.5-YS532 and Kv1.5-YS613. All datasets were fitted to Boltzmann functions. Each data point is the mean ± S.E. of 6–11 cells. B, confocal images of non-permeabilized cells transfected with Kv1.3-YS-Cherry, Kv1.5-YS532-EGFP, and Kv1.5-YS613-EGFP. An extracellular anti-Kv1.3 antibody was used to label Kv1.3-YS (green), whereas the extracellular anti-Kv1.5 antibody was used for Kv1.5-YS532 and Kv1.5-YS613 chimeras (red). Nuclei were stained by Hoechst (blue). C, proliferation rate of the indicated channels or GFP-transfected cells (control) was determined by measuring EdU incorporation. Significant differences when comparing to Kv1.3 (*) or to control (#) are indicated. Statistical analysis was performed with one-way ANOVA followed by a Tukey's HSD multiple comparison. Each bar is the average of 9–15 determinations from 5 different assays. D, the average peak current amplitude obtained in cell-attached experiments for Kv1.5 channels and all the Kv1.5 chimeras was plotted against the % of the channels expressed at the plasma membrane (upper graph) or their normalized effect on proliferation (taking 100% as the proliferation rate of GFP-transfected HEK cells, lower graph). The correlation between expression and current was fit to a linear regression curve (y = 18.54 + 0.0066x, R2 = 0.85, p = 0.008), but there was no correlation between proliferation and current amplitude (R2 = 0.23, p = 0.19).
FIGURE 6.
FIGURE 6.
MEK/ERK signaling pathway is involved in Kv1.3-induced proliferation. A, proliferation rate of HEK293 cells transfected with an empty vector (Cherry), Kv1.3 channel, and the Y447A and S459A Kv1.3 mutant channels. Cells were kept in control media alone (white bars) or preincubated with PD98059 (20 μm) 4 h before the EdU incorporation assay. Data are the mean ± S.E. n = 5–10 determinations. ***, p < 0.001 when compared with its corresponding control (untreated), pairwise comparison with student t test. B, proliferation rate of HEK cells transfected with Cherry or Kv1.3 constructs alone (Control) or together with negative control siRNA or a mixture of 3 MEK1/2 siRNAs. The effect of PD98059 treatment in this latter group was also studied. Data are the mean ± S.E. of 5–12 determinations from at least three independent experiments. Student's t test was used to compare between Cherry- and Kv1.3-transfected cells in each group. C, the bar plots show the densitometric analysis obtained from 4–6 different experiments in which samples were immunoprecipitated (IP) with RFP-Trap_A beads and incubated with anti-phosphotyrosine (P-Tyr) antibody. The data were corrected for the labeling obtained with anti-cherry antibodies and normalized to the amount obtained for untreated Kv1.3-transfected cells. Pairwise Student's t test was used to compare between control and treated cells for each condition (Kv1.3 and Y447A). A representative immunoblot for Kv1.3- and Y447A-transfected cells incubated with (+) or without (−) PD98059 20 μm is shown (the target protein bands were ∼84 kDa). D, representative immunoblot of cell lysates from Cherry (Ch)- or Kv1.3-transfected HEK cells with anti pERK1/2 antibody with or without treatment with phosphatase (P.) inhibitors. β-Acting was used as loading control. The lower blot shows anti-pERK1/2 labeling after immunoprecipitation of the same lysates with RFP-Trap.
FIGURE 7.
FIGURE 7.
Phosphotyrosine labeling of Kv1.3 channels is modulated by voltage-dependent transitions. A, representative immunoblots and summary data from Kv1.3-transfected cells incubated with the indicated K+e solutions for 20 min before RFP-Trap immunoprecipitation (IP). p-Tyr labeling was corrected for anti-Cherry labeling and normalized to control data (cells incubated in 5.4 mm K+). Statistical differences from control condition were established with a Tukey's HSD comparison after one-way ANOVA. B, time course of the effect of incubations with 60 mm K+e. At each time point, p-Tyr labeling is shown as the ratio of the 60/5.4 mm K+e signal. Each data point is the mean ± S.E. of 5–12 determinations from at least three independent experiments. Statistics were obtained with a MWW test pairwise comparison with Bonferroni correction and compared with the p-Tyr ratio at t = 5 min. C, immunoblot and densitometric average values of GFP-Trap-immunoprecipitated cells transfected with Kv1.3 or W389F-, WF3x-, and AYA Kv1.3-mutant channels. Data are normalized as above and are represented as the mean ± S.E. of 3–5 different experiments. Significant differences with Kv1.3 wild type channels were estimated with pairwise Student's t tests. *, p < 0.05; **, p < 0.01; ***, p < 0.001.

References

    1. Pardo L. A. (2004) Voltage-gated potassium channels in cell proliferation. Physiology 19, 285–292 - PubMed
    1. Wulff H., Castle N. A., and Pardo L. A. (2009) Voltage-gated potassium channels as therapeutic targets. Nat. Rev. Drug. Discov. 8, 982–1001 - PMC - PubMed
    1. Chandy K. G., Wulff H., Beeton C., Pennington M., Gutman G. A., and Cahalan M. D. (2004) K+ channels as targets for specific immunomodulation. Trends Pharmacol. Sci. 25, 280–289 - PMC - PubMed
    1. Coetzee W. A., Amarillo Y., Chiu J., Chow A., Lau D., McCormack T., Moreno H., Nadal M. S., Ozaita A., Pountney D., Saganich M., Vega-Saenz de Miera E., and Rudy B. (1999) Molecular diversity of K+ channels. Ann. N.Y. Acad. Sci. 868, 233–285 - PubMed
    1. DeCoursey T. E., Chandy K. G., Gupta S., and Cahalan M. D. (1984) Voltage-gated K+ channels in human lymphocyte-T: a role in mitogenesis. Nature 307, 465–468 - PubMed

Publication types

MeSH terms

LinkOut - more resources