. 2016 Feb;89(2):297-302.
doi: 10.1124/mol.115.102509. Epub 2015 Dec 11.

Dose-Response Analysis When There Is a Correlation between Affinity and Efficacy

Affiliations

Dose-Response Analysis When There Is a Correlation between Affinity and Efficacy

Anthony Auerbach. Mol Pharmacol. 2016 Feb.

Abstract

The shape of a concentration-response curve (CRC) is determined by underlying equilibrium constants for agonist binding and receptor conformational change. Typically, agonists are characterized by the empirical CRC parameters efficacy (the maximum response), EC(50) (the concentration that produces a half-maximum response), and the Hill coefficient (the maximum slope of the response). Ligands activate receptors because they bind with higher affinity to the active versus resting conformation, and in skeletal muscle nicotinic acetylcholine receptors there is an exponential relationship between these two equilibrium dissociation constants. Consequently, knowledge of two receptor-specific, agonist-independent constants--the activation equilibrium constant without agonists (E(0)) and the affinity-correlation exponent (M)--allows an entire CRC to be calculated from a measurement of either efficacy or affinity. I describe methods for estimating the CRCs of partial agonists in receptors that have a correlation between affinity and efficacy.


Figures

Fig. 1.
Fig. 1.
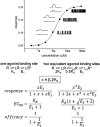
Example CRC. Top: A CRC simulation. Peak macroscopic responses (left inset) were fitted by the Hill equation (● and line) to estimate efficacy (0.34) and EC50 (173 μM). Single-receptor interval durations (right inset; R* is up) were fitted across concentrations to estimate rate constants (s−1) for agonist dissociation/association (1735/[L] • 88) and for the forward/backward activation conformational change (1003/2013). The Kd and E2 estimates were the same with either method. Bottom: CRC equations. L is the ligand, R is the resting receptor, and R* is the active receptor. Kd is the equilibrium dissociation constant for agonist binding to R, and En is the activation equilibrium constant with n bound ligands. The equations assume that activation of receptors with <n bound ligands is negligible, and that all sites are equivalent and independent. Response is the probability of a single receptor being active, EC50 is the [L] that gives a half-maximal response, and efficacy is the maximum response to the ligand.
Fig. 2.
Fig. 2.
Affinity-efficacy correlation. Kd and E2 were estimated from single-channel currents for different agonists of adult mouse AChR expressed in human embryonic kidney (HEK) cells (Jadey et al., 2011; Jadey and Auerbach, 2012). On a log-log scale, Kd and E2 are correlated linearly. The y-intercept is −5.64, and the slope is = 1.95. ACh, acetylcholine; Ana, anabaseine; CCh, carbamylcholine; Cho, choline; DMP, dimethylpyrrolidine; DMT, dimethylthiopyrrolidine; Nic, nicotine; TMA, tetramethylammonium.
Fig. 3.
Fig. 3.
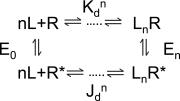
Cyclic model for binding and activation. Receptors can activate in the absence of ligands (R ↔ R*), and agonists can dissociate from active receptors (LnR* ↔ R* + nL). Linear activation schemes (Fig. 1) are good approximations when these two steps are uncommon. Dotted lines indicate that the binding of multiple agonists is sequential and not simultaneous; n is the number of (equivalent) agonist binding sites; E0 is the allosteric constant and is agonist independent; and En is the activation equilibrium constant of a fully occupied receptor. The low/high affinity ratio Kd/Jd is the coupling constant and is agonist specific. Ligands activate receptors when the coupling constant is >1 (eq. 1).
Fig. 4.
Fig. 4.
The M energy landscape. The black and gray lines pertain to a partial and a full agonist. For both, the energy change in high-affinity binding (proportional to log Jd) is M times greater than that in low-affinity binding (proportional to log Kd) (eq. 2). M is the ratio of the lengths of the vertical arrows, and it is the same for both agonists. In AChR, M = log(Jd)/log(Kd) = 1.92, and this constant is the basis for the affinity-efficacy correlation shown in Fig. 2. The dashed lines indicate that the full agonist “tilts” the unified energy landscape more than the partial one.

References

    1. Ashcroft FM. (2000) Ion channels and disease: channelopathies, Academic Press, San Diego.
    1. Auerbach A. (2012) Thinking in cycles: MWC is a good model for acetylcholine receptor-channels. J Physiol 590:93–98. - PMC - PubMed
    1. Auerbach A. (2015) Activation of endplate nicotinic acetylcholine receptors by agonists. Biochem Pharmacol 97:601–608. - PMC - PubMed
    1. Changeux J-P, Edelstein SJ. (2005) Nicotinic acetylcholine receptors: from molecular biology to cognition. Odile Jacob, New York.
    1. Colquhoun D. (1998) Binding, gating, affinity and efficacy: the interpretation of structure-activity relationships for agonists and of the effects of mutating receptors. Br J Pharmacol 125:924–947. - PMC - PubMed

Publication types

MeSH terms

LinkOut - more resources