. 2016 Mar 1:96:59-68.
doi: 10.1016/j.ymeth.2015.11.025. Epub 2015 Nov 30.

High-throughput single-molecule screen for small-molecule perturbation of splicing and transcription kinetics

Affiliations

High-throughput single-molecule screen for small-molecule perturbation of splicing and transcription kinetics

Christopher R Day et al. Methods. .

Abstract

In eukaryotes, mRNA synthesis is catalyzed by RNA polymerase II and involves several distinct steps, including transcript initiation, elongation, cleavage, and transcript release. Splicing of RNA can occur during (co-transcriptional) or after (post-transcriptional) RNA synthesis. Thus, RNA synthesis and processing occurs through the concerted activity of dozens of enzymes, each of which is potentially susceptible to perturbation by small molecules. However, there are few, if any, high-throughput screening strategies for identifying drugs which perturb a specific step in RNA synthesis and processing. Here we have developed a high-throughput fluorescence microscopy approach in single cells to screen for inhibitors of specific enzymatic steps in RNA synthesis and processing. By utilizing the high affinity interaction between bacteriophage capsid proteins (MS2, PP7) and RNA stem loops, we are able to fluorescently label the intron and exon of a β-globin reporter gene in human cells. This approach allows one to measure the kinetics of transcription, splicing and release in both fixed and living cells using a tractable, genetically encoded assay in a stable cell line. We tested this reagent in a targeted screen of molecules that target chromatin readers and writers and identified three compounds that slow transcription elongation without changing transcription initiation.

Keywords: Fluctuation; Fluorescence; RNA; Single-molecule; Small-molecule; Splicing; Transcription.


Figures

Fig. 1
Fig. 1
Work flow for the imaging-based small-molecule screen. (A) Transcription and splicing reporter gene, with MS2 and PP7 cassettes, stably integrated in U2-OS cells. (B) Experimental protocol performed before imaging. (C) Fully automated high-throughput confocal imaging. The inset shows that the number of TSs detected does not differ much when 3 or 7 z planes are imaged (5 planes are used in the rest of the study). (D) Automated primary data analysis. Cell nuclei are detected in the green channel, TS in the red channel, and both red and green fluorescence intensity are recorded at each TS. (E) Semi-automated secondary data analysis to extract kinetic information from fluorescence intensities. A scatter plot of mCherry vs eGFP intensities for each TS is plotted and fit with linear regression.
Fig. 2
Fig. 2
Monte Carlo simulations reveal kinetic information that can be determined from intron vs. exon scatter plots. (A) RNAPII occupancy of a constitutively expressed gene. (B) In silico simulations of constitutive transcription with RNAPII velocities of 1.3kb/min (blue circles) and 3.9kb/min (pink circles) are fit by linear regression. The fits show different y-intercepts but the same slope (blue, pink solid lines). The black dotted line indicates the position of the y-intercept. (C) Simulated Monte Carlo results (black circles) agree with analytical result (red dashed line) from Eq. 3 in the case of a constitutively expressed gene. There are no free parameters in the analytical result. (D) RNAPII occupancy of a bursty gene. (E) In silico simulations, for bursty transcription, of RNAPII velocities of 1.3kb/min (blue cirlces) and 3.9kb/min (pink circles) show different y-intercepts. (F) Simulated Monte Carlo results (black circles) display consistent offset with analytical results (red dashed line) from Eq. 3 in the case of a bursty gene. The solid black line is a fit with 1/v dependence and adjustable scaling parameter. (G) In silico simulations of 4 min (pink circles) and 8 min (blue circles) splicing times show different slopes. (H) In silico simulations of splicing times ranging from 1 to 40 min show a relationship between splicing time and slope but not splicing time and y-intercepts. The analytical model for slope and intercept is shown as dashed and solid gray lines, respectively.
Fig. 3
Fig. 3
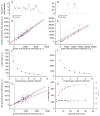
High-throughput imaging to identify molecules which change RNA synthesis kinetics. (A) Plots of the y-intercept extracted from the mCherry vs. eGFP scatter plot of each well. *p-value<0.05 **p-value<0.005 (two-tailed t-test vs control). Each column shows the 6 replicates for each treatment (3 biological with 2 technical replicates each). (B) Number of cells per well and fraction of cells transcribing for each compound tested. (C) Center of mass extracted from the mean intensity of eGFP and mCherry in each well. On panels B and C, the red point is the DMSO control and error bars are SEM.
Fig. 4
Fig. 4
Live-cell single-molecule measurements validate high-throughput imaging results. (A) A representative transcriptional time trace in control conditions (DMSO), where fluorescence is represented in both channels on the y-axis. (B) Control DMSO auto- and cross-correlation curves. (C) Average DMSO cross-correlation fit to a previously described mathematical model [18]. (D) Parameters extracted from cross-correlation curves. (E) DMSO data overlaid with SCG-CBP30 data. (F) DMSO data overlaid with PFI-1 data. (G) DMSO data overlaid with Tenovin-1 data. (E) DMSO data overlaid with (+)JQ1 data. (E) DMSO data overlaid with (−)JQ1 data.

References

    1. Orphanides G, Weinberg D. A Unified Theory of Gene Expression. Cell. 2002;108:439–451. - PubMed
    1. Coulon A, Chow CC, Singer RH, Larson DR. Eukaryotic transcriptional dynamics: from single molecules to cell populations. Nat Rev Genet. 2013;14:572–84. - PMC - PubMed
    1. Kwak H, Lis JT. Control of transcriptional elongation. Annu Rev Genet. 2013;47:483–508. - PMC - PubMed
    1. Wahl MC, Will CL, Luhrmann R. The spliceosome: design principles of a dynamic RNP machine. Cell. 2009;136:701–18. - PubMed
    1. Schmidt U, Basyuk E, Robert MC, Yoshida M, Villemin JP, Auboeuf D, et al. Real-time imaging of cotranscriptional splicing reveals a kinetic model that reduces noise: Implications for alternative splicing regulation. J Cell Biol. 2011;193:819–829. - PMC - PubMed

Publication types

MeSH terms

LinkOut - more resources