. 2016 Feb 5;291(6):2664-81.
doi: 10.1074/jbc.M115.679985. Epub 2015 Dec 11.

Selective Recognition of H3.1K36 Dimethylation/H4K16 Acetylation Facilitates the Regulation of All-trans-retinoic Acid (ATRA)-responsive Genes by Putative Chromatin Reader ZMYND8

Affiliations

Selective Recognition of H3.1K36 Dimethylation/H4K16 Acetylation Facilitates the Regulation of All-trans-retinoic Acid (ATRA)-responsive Genes by Putative Chromatin Reader ZMYND8

Santanu Adhikary et al. J Biol Chem. .

Abstract

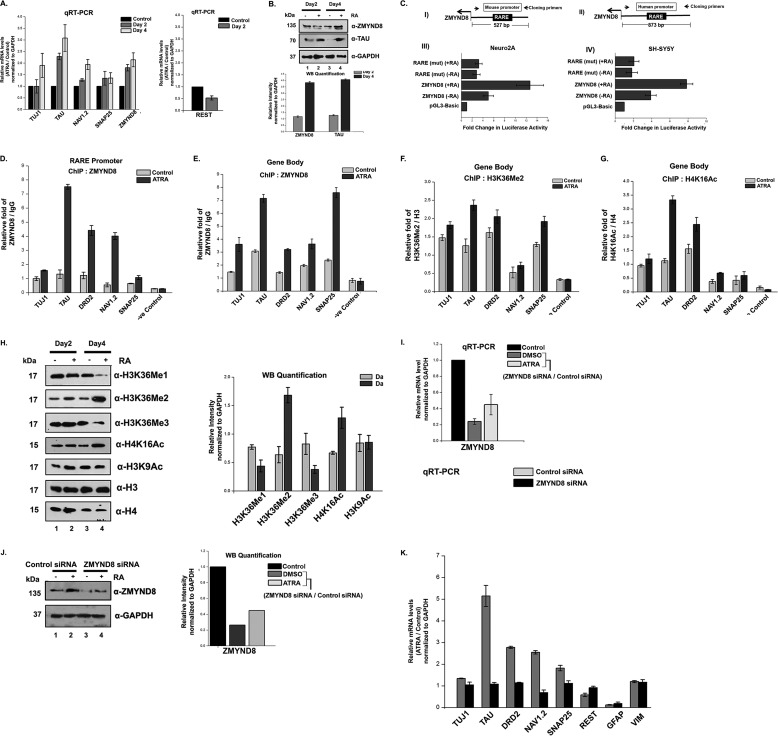
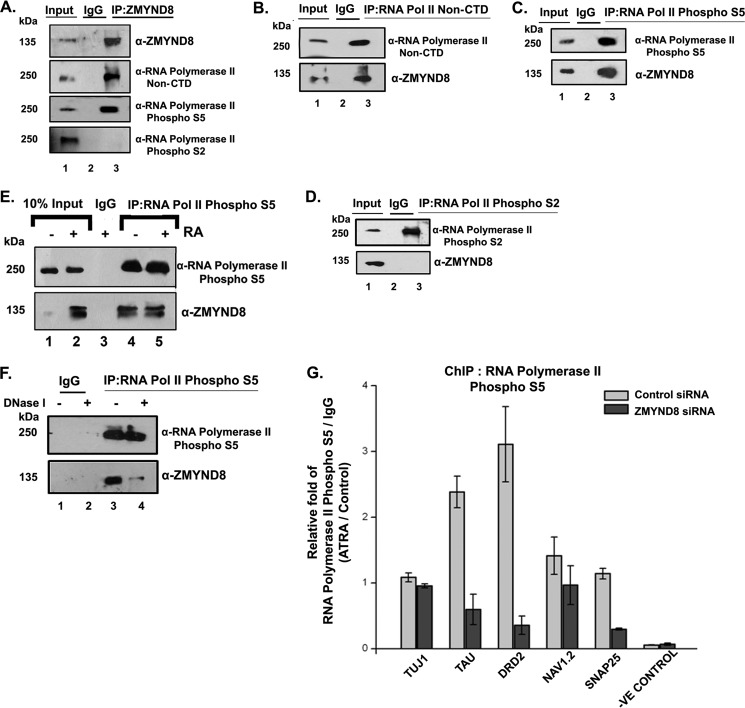
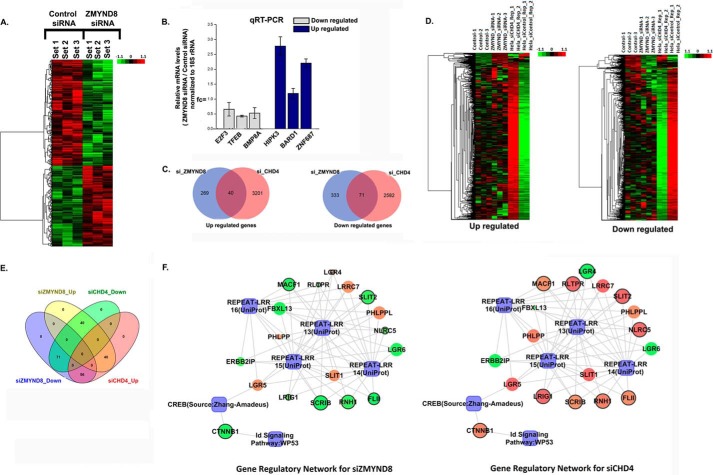
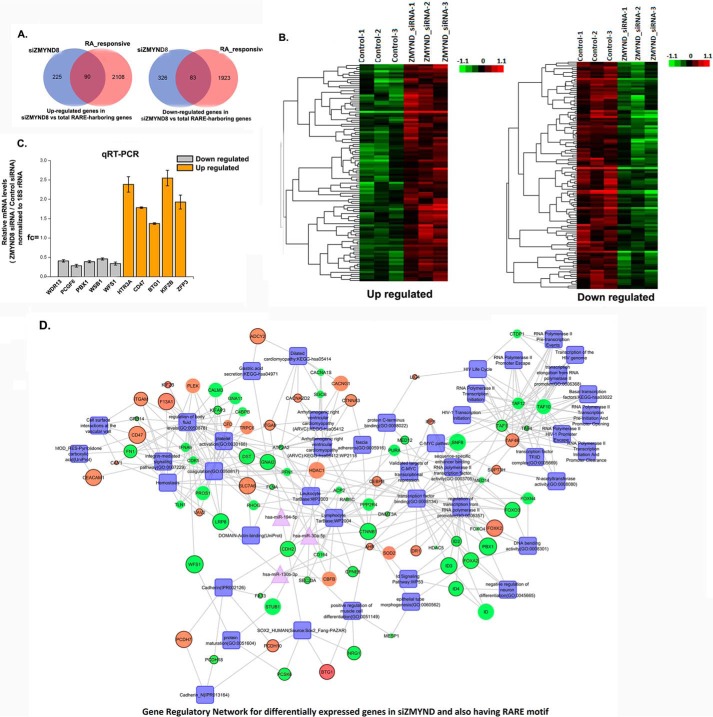
ZMYND8 (zinc finger MYND (Myeloid, Nervy and DEAF-1)-type containing 8), a newly identified component of the transcriptional coregulator network, was found to interact with the Nucleosome Remodeling and Deacetylase (NuRD) complex. Previous reports have shown that ZMYND8 is instrumental in recruiting the NuRD complex to damaged chromatin for repressing transcription and promoting double strand break repair by homologous recombination. However, the mode of transcription regulation by ZMYND8 has remained elusive. Here, we report that through its specific key residues present in its conserved chromatin-binding modules, ZMYND8 interacts with the selective epigenetic marks H3.1K36Me2/H4K16Ac. Furthermore, ZMYND8 shows a clear preference for canonical histone H3.1 over variant H3.3. Interestingly, ZMYND8 was found to be recruited to several developmental genes, including the all-trans-retinoic acid (ATRA)-responsive ones, through its modified histone-binding ability. Being itself inducible by ATRA, this zinc finger transcription factor is involved in modulating other ATRA-inducible genes. We found that ZMYND8 interacts with transcription initiation-competent RNA polymerase II phosphorylated at Ser-5 in a DNA template-dependent manner and can alter the global gene transcription. Overall, our study identifies that ZMYND8 has CHD4-independent functions in regulating gene expression through its modified histone-binding ability.

Keywords: chromatin; chromatin modification; chromatin remodeling; gene expression; gene regulation; gene silencing; gene transcription.


Figures

FIGURE 1.
FIGURE 1.
Human transcription factor ZMYND8 is a chromatin-associated protein. A, chromatin fractionation experiment with increased detergent concentration (0.1%-0.5%) in HEK293 cells was performed. ZMYND8 is associated with chromatin (C) fraction even upon 0.5% Nonidet P-40 treatment. Histone H3 and tubulin were used as markers for chromatin (C) and non-chromatin (NC) fractions. B, co-IP with α-ZMYND8 antibody from HEK293 cells followed by immunoblotting with α-H3, α-H4, α-H2B, and α-H2A antibodies. IgG pull down served as a negative control. IP, immunoprecipitation; WCE, whole cell extract. C, GST-PBP (of ZMYND8) or GST protein interaction with recombinant histone H3 (panel I) and H4 (panel II). GST pulldown assay was performed and probed with α-H3 (panel I) and α-H4 (panel II) antibodies. D, core histone (from chicken erythrocytes) interaction with GST-PBP or GST proteins. GST pulldown assay followed by Western blot analysis with α-H3, α-H4 α-H2B, and α-H2A antibodies was performed. E, interaction of chromatosome (from HeLa cells) with GST-PBP or GST proteins. GST pull down was performed followed by and immunoblotting with α-H3 and α-H4 antibodies.
FIGURE 2.
FIGURE 2.
ZMYND8 interacts preferentially with histone H3.1K36Me2/Me3 and H4K16Ac through its putative chromatin-binding module in vitro. A, schematic domain organization of ZMYND8. B, interaction of GST-PBP module of ZMYND8 with MODified Histone Peptide Array (CelluSpots array). Preferential histone peptide interactors of GST-PBP were scored by probing the array with α-GST antibody. GST-PBP showed significant interaction with H3K36Me2 (spot 3), H3K36Me3 (spot 4), and H4K16Ac (spot 6). H3K14Ac K18Ac alone or in combination with R17Me2a/s or H3K18Ac R17Me2a also showed positive interaction (spots 7–10) (panel I). Sequence alignment of the canonical H3(10–18), H3(31–40) by ClustalW. The conserved amino acids are marked in red (panel II). C, interaction of GST-PBP (panel I), GST-PWWP (panel II), and GST-PHD (panel III) with biotinylated mono/di/tri-methylated H3.1K36. Similar interactions of GST-PBP were with H3.3K36-methylated peptides (panel IV). GST-PBP interaction were with biotinylated mono/di/tri-methylated H3K27 and H4K20 peptides (panel V). D, interaction of GST-PBP (panel I), GST-bromo (panel II), with biotinylated H4-K5/K8/K12/K16/K20 acetylated peptides. Interaction of GST-PBP (panel III) and GST-bromo (panel IV) module with other acetylated histone H3 peptides (H3K9Ac, H3K14Ac, and H3K27Ac). E, unmodified H4(11–25) and H3(22–44) (panel I, lanes 3 and 4) showed minimal interaction as compared with H4K16Ac and H3.1K36Me2 peptides (panel I, lanes 5 and 6) with GST-PBP. Furthermore, GST-PBP showed preferential interaction with H3.1K36Me2 compared with H3.3K36Me2 (panel II, compare lanes 3 and 5). F, binding isotherms for the interaction of His-PBP (of ZMYND8) with indicated histone peptides as obtained from steady state fluorescence spectroscopy. Data points for H3K36Me3, H3K36Me2, and H3K36Me1 are indicated by circle (red), square (black), and triangle (blue), respectively (panel I). Binding isotherm for the interaction of His-PBP and H4K16Ac (FAM-conjugated) peptide as obtained from steady state fluorescence spectroscopy (panel II). G, sequence alignment of ZMYND8 and ZMYND11 showing conserved critical residues in Bromo-PWWP (BP) module by using ESPript. H, molecular modeling of ZMYND8 with ZMYND11 BP module was done by using Modeler version 9.13. Modeled bromodomain (I) and PWWP domain (J) structure highlighting the predicted critical residues involved in interaction with acetylated H4K16 and methylated H3.1K36, respectively. K and L, comparative binding ability of GST-PBP wild type (WT) or Y227A/N228A mutant (K) or F307A mutant (L) with H4K16Ac and H3.1K36Me2 peptides (panels I and II).
FIGURE 3.
FIGURE 3.
Preferential interaction of ZMYND8 with H3.1K36Me2/H4K16Ac ex vivo. A, interaction of ZMYND8 with H3.1 or H3.3 histones. HEK293 cells were transiently transfected with FLAG-H3.1/FLAG-H3.3. M2-agarose pull down was done and subsequently probed with α-ZMYND8 antibody. ZMYND11 was used as a control. Western blot quantification showed the preferential interaction of ZMYND8 with H3.1 and ZMYND11 with H3.3 (panel I). Blots were quantified using ImageJ software from National Institutes of Health. Sequence alignment of histone H3 binding pocket of ZMYND11 and similar sequence stretch in ZMYND8 by ClustalW. Critical residues marked in blue mediating H3.3 binding in ZMYND11 (Asn and Arg) are substituted in ZMYND8 (by Cys and Lys) (panel II). Sequence alignment of histone H3.1 and H3.3 spanned amino acids 20–40. The variation at the N-terminal tail is at amino acid Ala-31 for H3.1 which is replaced by Ser-31 for H3.3 (marked in red) (panel III). B, interaction of ZMYND8 with modified histones. Endogenous ZMYND8 was co-immunoprecipitated from HEK293 cells and immunoblotted for ZMYND8, H3K36Me2, H3K36Me3, and H4K16Ac. IgG pull down served as a negative control. C, ChIP assays were performed in HEK293 cells with α-H3K36Me2 and α-ZMYND8 antibodies to check for enrichment of H3K36Me2 (panel I) and ZMYND8 (panel II) at RRAS2, TGFA, and MET gene loci and a negative control region (depleted of H3K36Me2 and H4K16Ac). Two separate regions of each of the genes (5 and 24 kb for RRAS2, 22 and 57 kb for TGFA, and 3 and 26 kb for MET, downstream from start site) were selected for designing primers. D, similarly, ChIP assays were performed in HEK293 cells with α-H4K16Ac and α-ZMYND8 antibodies to show enrichment of H4K16Ac (panel I) and ZMYND8 (panel II) at HOXA9, WNT1, and TP53 gene loci and a negative control region (depleted of H3K36Me2 and H4K16Ac). Two separate regions of 646 and 1890 bp downstream from the start site were selected for designing primers from HOXA9 gene. WNT1 primers were for promoter region, whereas the TP53 primer was designed 11 kb downstream. Quantitative PCR was done, and relative fold was plotted normalizing by IgG. For H3K36Me2 and H4K16Ac, ChIP relative fold was further normalized to endogenous H3 and H4, respectively. At least three separate experiments were performed. Error bars show standard deviation.
FIGURE 4.
FIGURE 4.
Chromatin binding module of ZMYND8 is essential for its histone interaction. A, HeLa cells were transiently transfected with FLAG-WT ZMYND8 or FLAG-ΔPBP ZMYND8, co-stained with α-FLAG and either α-H3K36Me2 or α-H4K16Ac antibodies. The Pearson's coefficient for FLAG-WT ZMYND8 and H3K36Me2/H4K16Ac was >0.5, whereas that for FLAG-ΔPBP ZMYND8 and H3K36Me2/H4K16Ac was <0.5. B, HEK293 cells were transiently transfected with FLAG-WT or FLAG-ΔPBP ZMYND8, and whole cell extracts were subjected to M2-agarose FLAG pull down and immunoblotted with α-FLAG, α-H3K36Me2, α-H4K16Ac, α-HDAC1, and α-CHD4 antibodies. C, interaction of GST-PBP or GST-MYND with biotinylated H4K16Ac and H3.1K36Me2 peptides. Western blot analysis was done with α-GST antibody. D, ChIP assay was performed after transiently transfecting FLAG-WT or FLAG-ΔPBP ZMYND8 in HEK293 cells with α-FLAG antibody. Relative fold enrichment at TP53 (11 kb) and RRAS2 (24 kb) gene loci was scored by quantitative PCR normalized to IgG. At least three separate experiments were performed. Error bars show standard deviation.
FIGURE 5.
FIGURE 5.
ZMYND8 is ATRA-responsive and regulates other RA-inducible genes. A, ATRA treatment of SH-SY5Y cells for 2 and 4 days, respectively, leads to an increase in ZMYND8 RNA level. TAU, TUJ1, NAV1.2, SNAP25, and REST were used as controls. Relative mRNA level was plotted for ATRA-treated differentiated cells over DMSO-treated undifferentiated cells and normalized to GAPDH. At least three individual experiments were performed. Error bars show standard deviation. B, alteration in the expression of ZMYND8 protein abundance in SH-SY5Y cells upon ATRA treatment for 2 and 4 days. Western blotting was done by probing with α-ZMYND8, α-TAU, and α-GAPDH antibodies. GAPDH was used as loading control. At least three individual experiments were performed. Error bars show standard deviation. Blots were quantified using ImageJ software from National Institutes of Health. C, schematic diagram shows the upstream regulatory region of mouse (panel I) and human (panel II) ZMYND8 genes with the arbitrary position of RARE and the primer pairs used to clone those regions into pGL3-basic vector. The respective reporter constructs were transiently transfected into Neuro2A (panel III) and SH-SY5Y (panel IV) cells, respectively, with/without ATRA treatment followed by luciferase assay. The activities are shown as mean fold enhancement compared with the empty vector after normalization with Renilla luciferase activity. Here, the constructs containing mutated RARE sequence are named as RARE-mut. Each transfection was performed in triplicate, and the experiments were repeated at least three times. Error bar shows standard deviation. D–G, relative enrichment of ZMYND8 on the RARE harboring sequence of promoter of RA-responsive genes (TUJ1, TAU, DRD2, NAV1.2, and SNAP25) was observed (D). Similar enrichment of ZMYND8 (E), H3K36Me2 (F), and H4K16Ac (G) onto gene body region of TUJ1, TAU, DRD2, NAV1.2, and SNAP25 genes was monitored. ChIP assays were performed after 4 days of ATRA treatment in SH-SY5Y cells with α-ZMYND8 antibody. Relative fold was calculated by normalizing ZMYND8 with IgG for both DMSO (control) and ATRA-treated cells. At least three separate experiments were performed. Error bars show standard deviation. H, alteration in the expression of different epigenetic marks upon ATRA treatment for 2 and 4 days. Western blotting was done by probing with α-H3K36Me1, α-H3K36Me2, α-H3K36Me3, α-H4K16Ac, and α-H3K9Ac antibodies from whole cell extracts and quantified by ImageJ software from National Institutes of Health. α-H3 and α-H4 are used as loading controls for respective modifications. At least three separate experiments were done. Error bars show standard deviation. I, ZMYND8 silencing was done in 2 days of ATRA- or DMSO- treated SH-SY5Y cells. Similar experiments were performed with non-targeting siRNA, as negative control. Total mRNA level was analyzed by quantitative PCR, and GAPDH was used for normalization. Reference level was considered as 1. J, ZMYND8 knockdown in SH-SY5Y cells was scored by Western blotting after ATRA treatment for 2 days, with α-ZMYND8 antibody. GAPDH was used for normalization. Blots were quantified using ImageJ software from National Institutes of Health. K, alterations in the expression of neuronal markers (TUJ1, TAU, DRD2, NAV1.2, and SNAP25), glial markers (GFAP and VIM), and pluripotency marker REST were measured after ZMYND8 siRNA (or a non-targeting siRNA as negative control) transfection during 2 days of ATRA or DMSO treatment in SH-SY5Y cells. Total mRNA level was scored by quantitative PCR normalizing to GAPDH. Relative mRNA level was plotted as ATRA-treated differentiated cells over DMSO-treated undifferentiated cells. Reference level considered as 1. At least three separate experiments were done. Error bars show standard deviation.
FIGURE 6.
FIGURE 6.
ZMYND8 interacts with RNA polymerase II phospho-Ser5 in a DNA-dependent manner. A, ZMYND8 was co-immunoprecipitated from SH-SY5Y cells and immunoblotted with α-RNA polymerase II non-CTD (epitope at N terminus), α-RNA polymerase II phospho-Ser-5, and α-RNA polymerase II phospho-Ser-2 antibodies. IgG serves as negative control. B–D, similarly, RNA polymerase II non-CTD (B), RNA pol II phospho-Ser-5 (C), and RNA pol II phospho-Ser-2 (D) was co-immunoprecipitated from SH-SY5Y cells and immunoblotted with α-ZMYND8 antibody. E, co-IP of RNA pol II phospho-Ser-5 from 4 days ATRA- or DMSO-treated SH-SY5Y cells followed by immunoblotting with α-ZMYND8 antibody. IgG serves as negative control. F, RNA pol II phospho-Ser-5 was co-immunoprecipitated from SH-SY5Y cells after DNase I treatment of lysates and immunoblotted with α-ZMYND8 antibody. IgG serves as negative control. G, ChIP assays were performed after ZMYND8 siRNA or a non-targeting siRNA transfection during 2 days of ATRA or DMSO treatment in SH-SY5Y cells with α-RNA polymerase II phospho-Ser-5 antibody. Relative fold was calculated by normalizing RNA pol II phospho-Ser-5 with IgG and represented as ATRA-treated differentiated cells over DMSO-treated undifferentiated cells.
FIGURE 7.
FIGURE 7.
Regulation of global gene expression by ZMYND8 in a NuRD-independent mode. A, clustering and heat maps of expression values for differentially expressed genes. Down-regulated genes are marked in green, and up-regulated genes are marked in red. From left to right, first three samples are control siRNA-treated and latter three samples are ZMYND8 siRNA-treated HeLa cells. B, validation of microarray analysis. Bars show candidate up-regulated and down-regulated genes after knocking down ZMYND8 in HeLa cells. 18S rRNA was used for normalization. Reference level was considered as 1. At least three individual experiments were performed. Error bars show standard deviation. C, Venn diagram showing the overlap between up- and down-regulated genes in ZMYND8 or CHD4 knocked down HeLa cells. D, clustering and heat maps of up- and down-regulated genes in ZMYND8 knocked down and CHD4 knocked down HeLa cells. E, overlapping Venn diagram for common differentials between ZMYND8 and CHD4. The pink circle represents up-regulated genes in siCHD4, and the green circle is for down-regulated genes in siCHD4; the yellow circle is for up-regulated genes in siZMYND8, and the blue circle represents down-regulated genes in siZMYND8. As they have common differential genes, so the overlapping areas are in different colors. F, networks for ZMYND8 knocked down and CHD4 knocked down HeLa cells based on the common biology. The genes whose regulation are opposite in the two networks are bordered in black. The genes are colored according to their fold change and sized based on their p value which is <0.05. Green and red ellipses denote down-regulation and up-regulation, respectively, and the processes are denoted by a blue rectangle.
FIGURE 8.
FIGURE 8.
ZMYND8 modulates RARE-harboring genes. A, Venn diagram showing the overlap between up- and down-regulated genes in ZMYND8 knocked down and total RARE-harboring genes in HeLa cells. B, clustering and heat maps of up- and down-regulated genes in ZMYND8 knocked down and total RARE-harboring genes in HeLa cells. C, validation of microarray analysis. Bars show candidate RARE-harboring, up- and down-regulated genes after knocking down ZMYND8 in HeLa cells. 18S rRNA was used for normalization. Reference level was considered as 1. At least three separate experiments were done. Error bars show standard deviation. D, gene regulatory network for differentially expressed genes in ZMYND8 knocked down and total RARE-harboring genes in HeLa cells. Genes are in ellipses, and processes are in rectangles, and miRNAs are triangular in shape. The genes whose regulation are opposite in the two networks are bordered in black. Green denotes down-regulation, and red denotes up-regulation. The color shade of nodes differs due to their fold change. The size of the nodes is as per their p value which is <0.05.

References

    1. Zhang Y., LeRoy G., Seelig H. P., Lane W. S., and Reinberg D. (1998) The dermatomyositis-specific autoantigen Mi2 is a component of a complex containing histone deacetylase and nucleosome remodeling activities. Cell 95, 279–289 - PubMed
    1. Tong J. K., Hassig C. A., Schnitzler G. R., Kingston R. E., and Schreiber S. L. (1998) Chromatin deacetylation by an ATP-dependent nucleosome remodeling complex. Nature 395, 917–921 - PubMed
    1. Yun M., Wu J., Workman J. L., and Li B. (2011) Readers of histone modifications. Cell Res. 21, 564–578 - PMC - PubMed
    1. Musselman C. A., Lalonde M. E., Côté J., and Kutateladze T. G. (2012) Perceiving the epigenetic landscape through histone readers. Nat. Struct. Mol. Biol. 19, 1218–1227 - PMC - PubMed
    1. Malovannaya A., Lanz R. B., Jung S. Y., Bulynko Y., Le N. T., Chan D. W., Ding C., Shi Y., Yucer N., Krenciute G., Kim B. J., Li C., Chen R., Li W., Wang Y., O'Malley B. W., and Qin J. (2011) Analysis of the human endogenous coregulator complexome. Cell 145, 787–799 - PMC - PubMed

Publication types

MeSH terms

LinkOut - more resources