. 2016 Jan 29;291(5):2119-35.
doi: 10.1074/jbc.M115.675645. Epub 2015 Dec 11.

SIRT1 Limits Adipocyte Hyperplasia through c-Myc Inhibition

Affiliations

SIRT1 Limits Adipocyte Hyperplasia through c-Myc Inhibition

Houari Abdesselem et al. J Biol Chem. .

Abstract

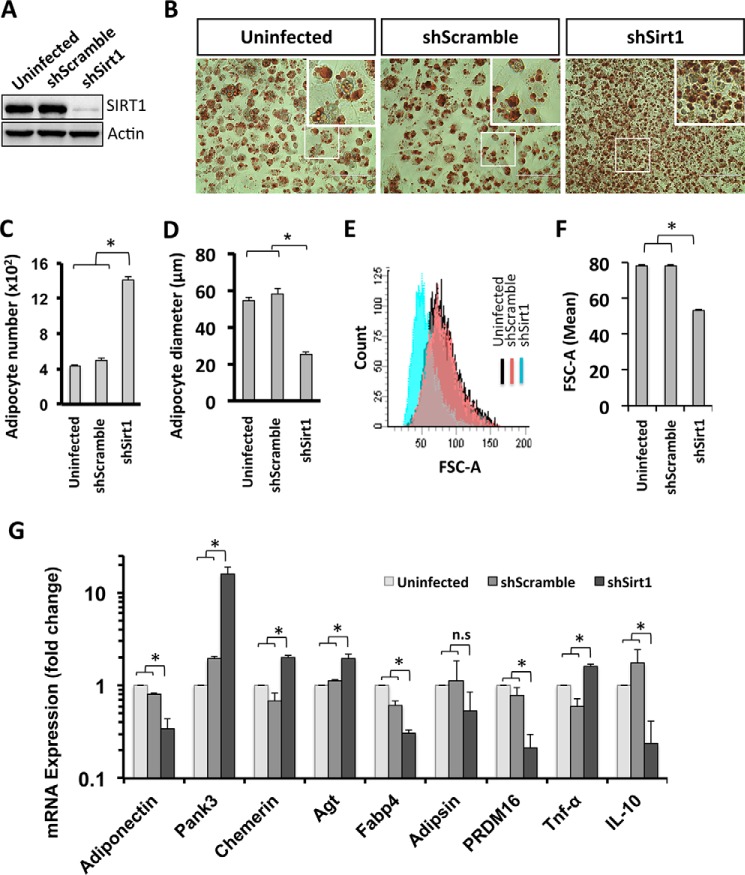
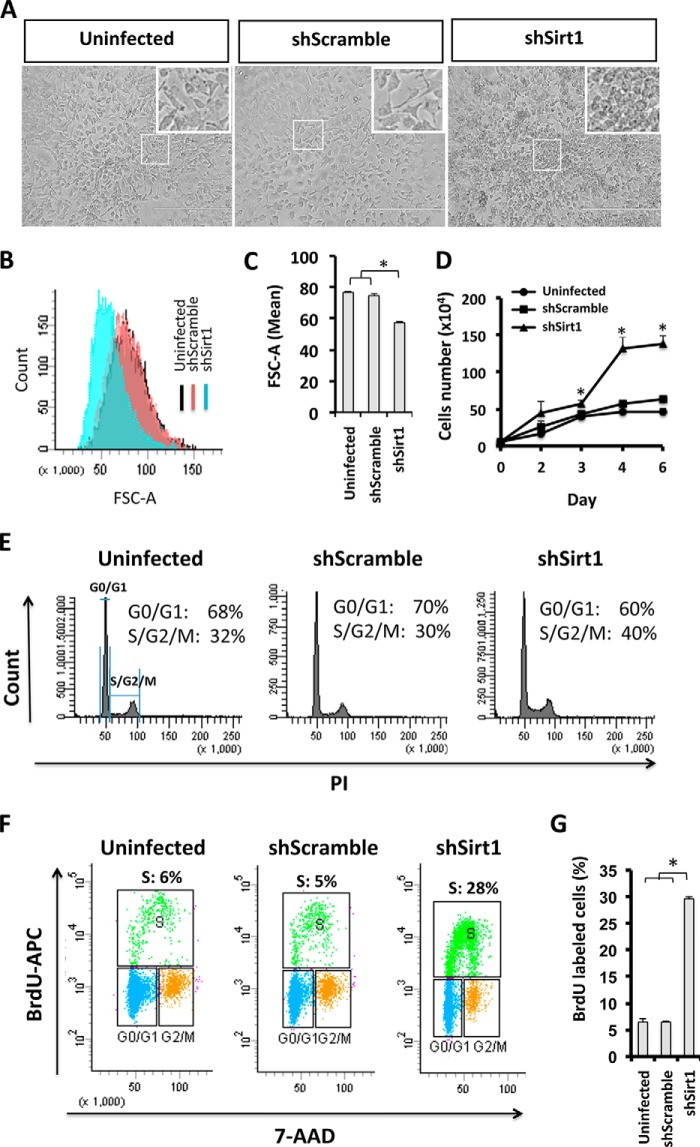
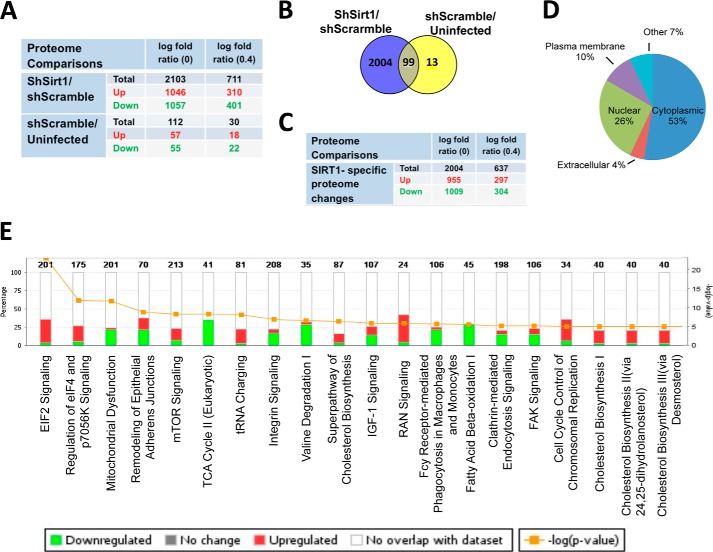
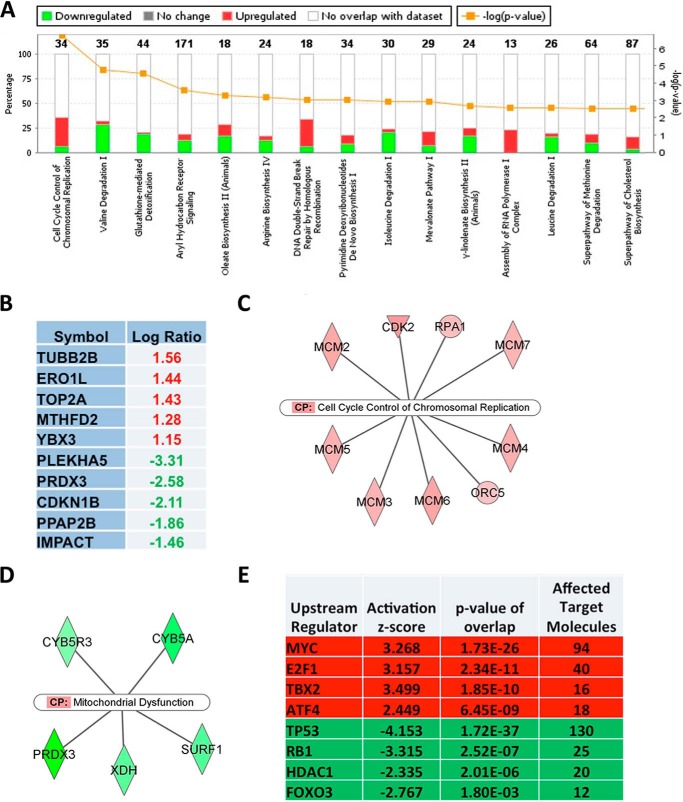
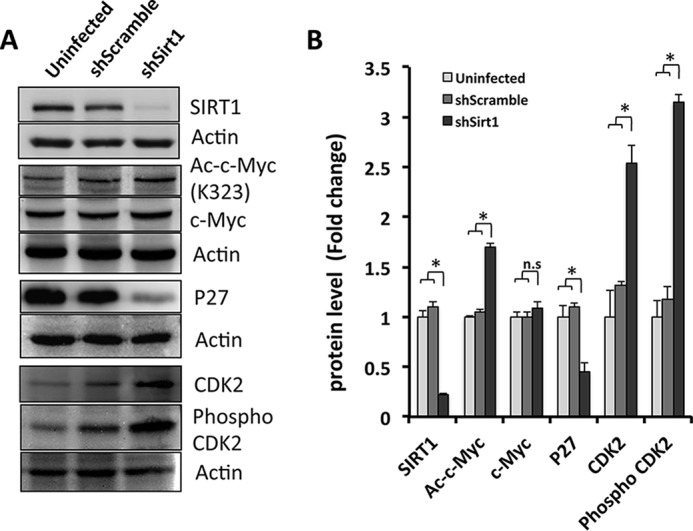
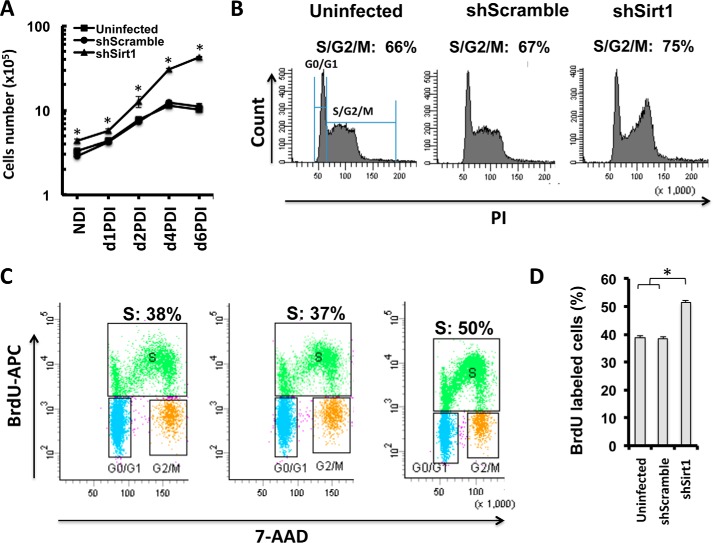
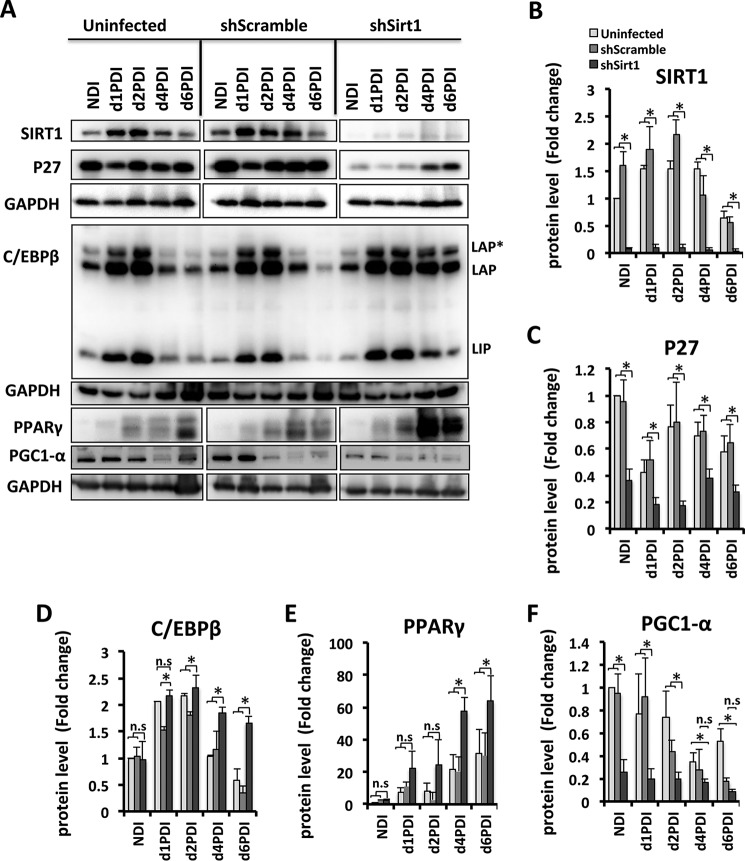
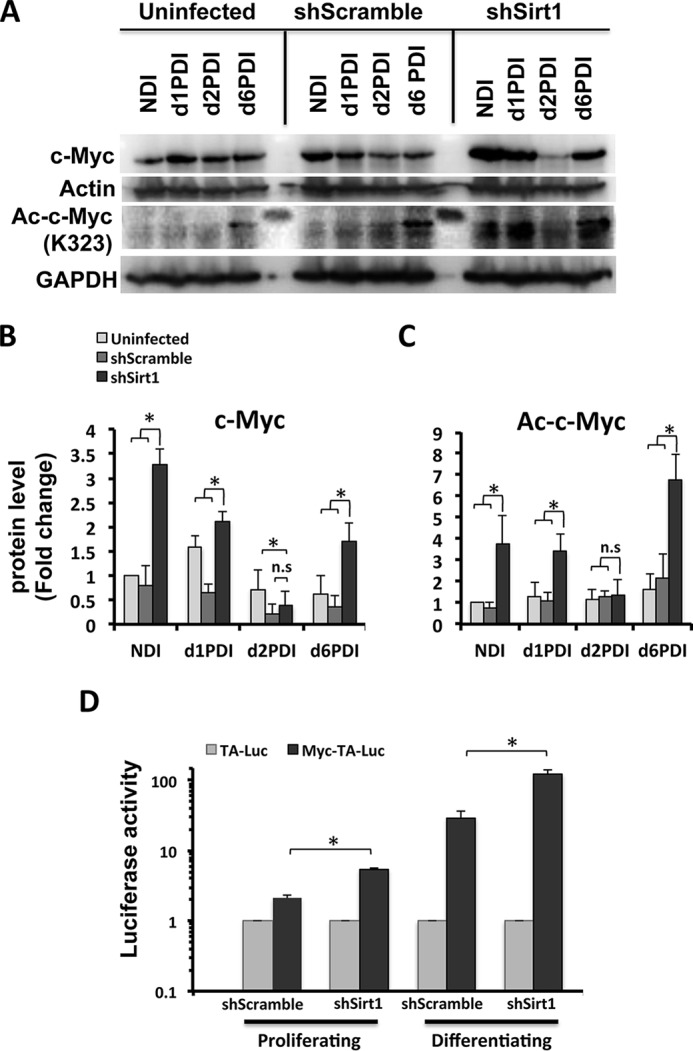
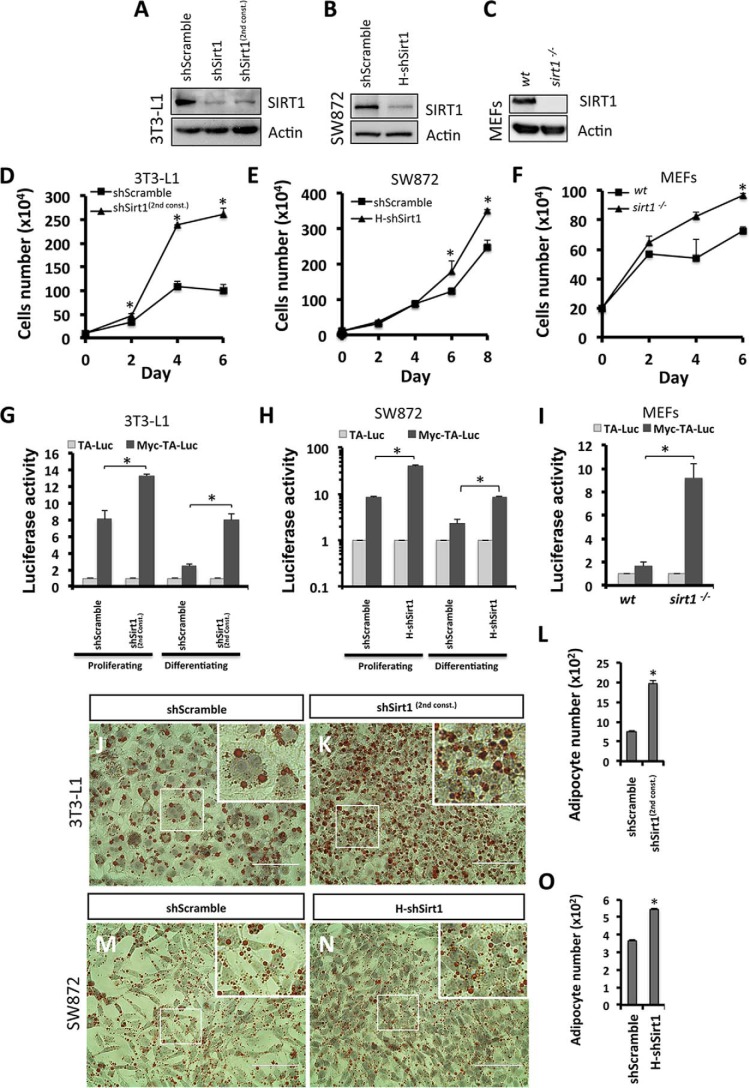
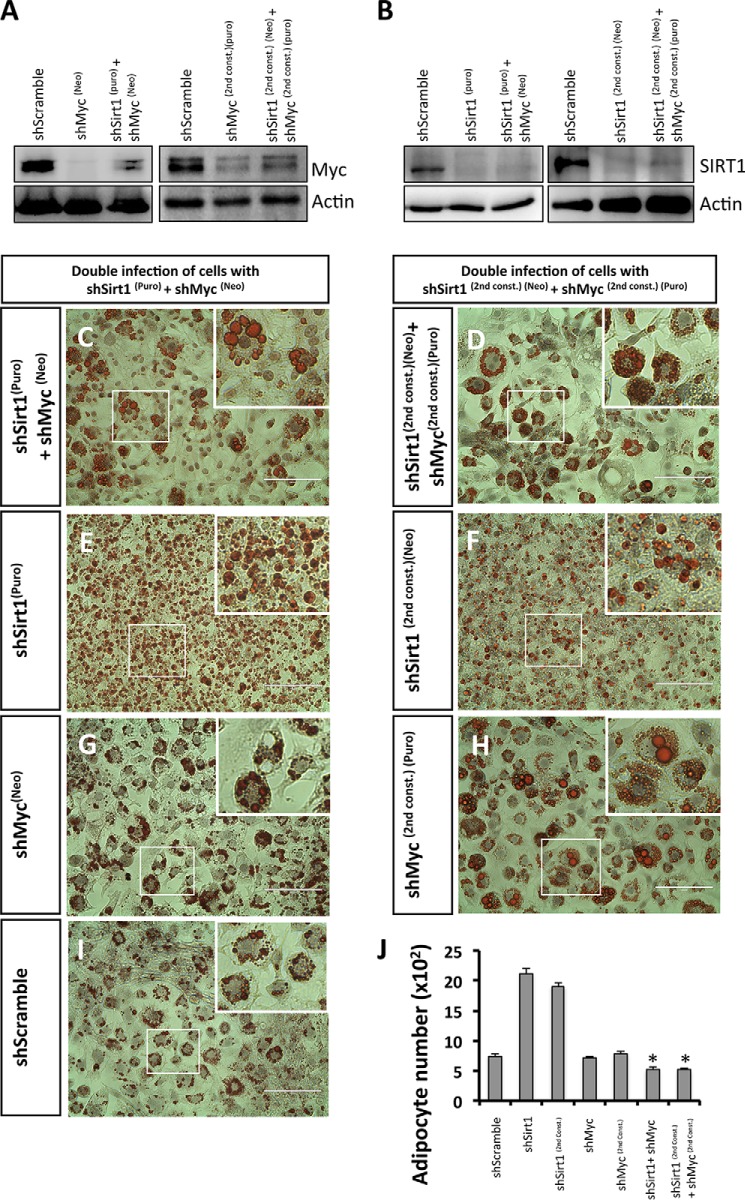
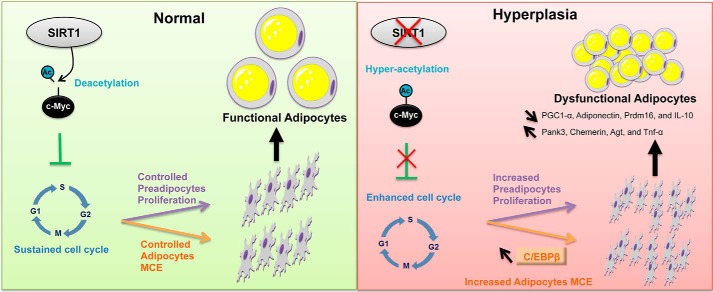
The expansion of fat mass in the obese state is due to increased adipocyte hypertrophy and hyperplasia. The molecular mechanism that drives adipocyte hyperplasia remains unknown. The NAD(+)-dependent protein deacetylase sirtuin 1 (SIRT1), a key regulator of mammalian metabolism, maintains proper metabolic functions in many tissues, counteracting obesity. Here we report that differentiated adipocytes are hyperplastic when SIRT1 is knocked down stably in mouse 3T3-L1 preadipocytes. This phenotype is associated with dysregulated adipocyte metabolism and enhanced inflammation. We also demonstrate that SIRT1 is a key regulator of proliferation in preadipocytes. Quantitative proteomics reveal that the c-Myc pathway is altered to drive enhanced proliferation in SIRT1-silenced 3T3-L1 cells. Moreover, c-Myc is hyperacetylated, levels of p27 are reduced, and cyclin-dependent kinase 2 (CDK2) is activated upon SIRT1 reduction. Remarkably, differentiating SIRT1-silenced preadipocytes exhibit enhanced mitotic clonal expansion accompanied by reduced levels of p27 as well as elevated levels of CCAAT/enhancer-binding protein β (C/EBPβ) and c-Myc, which is also hyperacetylated. c-Myc activation and enhanced proliferation phenotype are also found to be SIRT1-dependent in proliferating mouse embryonic fibroblasts and differentiating human SW872 preadipocytes. Reducing both SIRT1 and c-Myc expression in 3T3-L1 cells simultaneously does not induce the adipocyte hyperplasia phenotype, confirming that SIRT1 controls adipocyte hyperplasia through c-Myc regulation. A better understanding of the molecular mechanisms of adipocyte hyperplasia will open new avenues toward understanding obesity.

Keywords: Myc (c-Myc); adipogenesis; cell proliferation; hyperplasia; sirtuin 1 (SIRT1).


Figures

FIGURE 1.
FIGURE 1.
Adipocytes are hyperplastic, small, dysfunctional, and inflamed when SIRT1 is silenced. A, Western blotting was performed using antibodies against SIRT1 for the indicated conditions of 3T3-L1 cells (uninfected cells, shScramble, and shSirt1 lentivirus-infected cells). Actin was used as a loading control. B, Oil Red O staining of differentiated 3T3L-1 adipocytes for the indicated conditions. The areas in boxes are enlarged 5-fold at the top right. Scale bars = 100 μm. C, quantification of the data in B for the number of adipocytes for each condition. Results are presented as mean ± S.E. from six different fields of three independent experiments using Student's t test. *, p < 0.05. D, cell diameter calculation was quantified from adipocytes of the indicated conditions. Results are presented as mean ± S.E. from eight different fields of three independent experiments using Student's t test. *, p < 0.05. E and F, cell size estimation of 3T3-L1 adipocytes of the indicated conditions by flow cytometric analysis using LipidTOX staining. E, on the FITC+ gate, the cell size was estimated by FSC-A (forward scatter) (blue curve, shSirt1; red curve, shScramble; black curve, uninfected) and quantified as mean ± S.E. of three independent experiments using Student's t test. F, *, p < 0.05. G, mRNA expression analysis for white and brown adipocyte markers, and inflammation markers were assessed by quantitative RT-PCR analysis on d10PDI of the indicated conditions of 3T3-L1 adipocytes. Results are represented as mean ± S.E. of three independent experiments using Student's t test. *, p < 0.05; n.s., not significant.
FIGURE 2.
FIGURE 2.
SIRT1 knockdown increases the cell proliferation potential in 3T3-L1 preadipocytes. A, microscopic phase-contrast images of 3T3-L1 cells for the indicated conditions. Areas in boxes are enlarged 6-fold at the top right. Scale bars = 400 μm. B and C, cell size was assessed by flow cytometric analysis. Curves represent cell number versus cell size FSC-A (forward scatter) and are quantified in C. Results are presented as mean ± S.E. from three independent experiments using Student's t test. *, p < 0.05. D, growth curve representing the number of 3T3-L1 cells of the indicated conditions at different time points (days 0, 2, 3, 4, and 6). Results are presented as mean ± S.E. from three independent experiments using Student's t test. *, p < 0.05. E, cell cycle analysis by flow cytometry. 3T3-L1 cells for the indicated conditions were stained with propidium iodide nuclear dye. Cellular DNA contents were determined by flow cytometric analysis, and cells were distributed in three phases of the cycle (G0/G1, S, and G2/M). The S and G2/M phases were combined to represent 2n-fold DNA content and compared with G0/G1 (1n-fold DNA content). Results are presented in percent for each plot and are representative of three independent experiments. F, flow cytometric analysis of BrdU incorporation in 3T3-L1 cells. Cells were stained with BrdU-APC antibodies and 7-AAD nuclear dye, and S phase (green population) was defined as BrdU-APC-positive cells. PI, propidium iodide. G, quantification of BrdU incorporation presented in F. Results are presented as mean ± S.E. from three independent experiments using Student's t test. *, p < 0.05.
FIGURE 3.
FIGURE 3.
Proteomics and pathway analyses of SIRT1-silenced 3T3-L1 preadipocytes. A, the number of statistically significant proteome changes in shSirt1 versus shScramble and shScramble versus uninfected preadipocytes proteome comparisons at the indicated cutoff value of log2 -fold changes. Highlighted in red and green are the numbers of up-regulated and down-regulated gene products, respectively. B, overlap of gene products between shSirt1/shScramble and shScramble/uninfected proteome comparisons. C, the number of statistically significant SIRT1-specific proteome changes at the indicated cutoff value of log2 -fold changes. Highlighted in red and green are the numbers of up-regulated and down-regulated gene products, respectively. D, percentages of gene annotation by subcellular localization as indicated in shSirt1/shScramble proteome comparison. E, IPA prediction of the top 20 affected canonical pathways of SIRT1-specific proteome changes in the shSirt1/shScramble proteome analysis. The axes show percentages of overlapped genes in each pathway and the p value of overlap (IPA-generated). Highlighted in red and green is the percentage of up-regulated and down-regulated gene products in each pathway, respectively.
FIGURE 4.
FIGURE 4.
Focused pathway analysis of proteome changes in SIRT1-silenced preadipocytes reveals enrichment in cell cycle regulatory pathways. A, the top 15 IPA-predicted affected canonical pathways of SIRT1-specific proteome changes. The axes show percentages of overlapped genes in each pathway and the p value of overlap (IPA-generated). Highlighted in red and green is the percentage of up-regulated and down-regulated gene products in each pathway, respectively. B, the top five identified up-regulated and down-regulated gene products in the dataset as highlighted in red and green, respectively. C, the top nine affected molecules designated to the cell cycle control of chromosomal replication canonical pathway (CP). D, the top five affected molecules designated to the mitochondrial canonical pathway. Green shows down-regulated and red shows up-regulated genes products in the dataset. E, IPA predictions of affected regulators in SIRT1-specific proteome changes. Highlighted in red and green are pathways predicted as activated or inhibited, respectively. The ranking is on the basis of assigned IPA p values, and the degree of activation is on the basis of IPA assigned z scores of activation. A z score of above +2 signifies activation, whereas a z score below −2 implies inhibition.
FIGURE 5.
FIGURE 5.
c-Myc and cell cycle key player p27 and CDK2 expression and activation are altered in SIRT1 knockdown preadipocytes. A, Western blotting was performed using antibodies against SIRT1, acetylated c-Myc (Lys-323), total c-Myc, total p27, total CDK2, phospho-CDK2, and actin as a loading control from cell lysates derived from 3T3-L1 cells for the indicated conditions. B, quantification of the data in A. Results are presented as mean ± S.E. from three independent experiments using Student's t test. *, p < 0.05; n.s., not significant.
FIGURE 6.
FIGURE 6.
SIRT1 knockdown affects MCE of differentiating adipocytes. A, growth curve for differentiating 3T3-L1 cells of the indicated conditions in a time course experiment with and without differentiation induction (no DI (NDI), d1PDI, d2PDI, d4PDI, and d6PDI). Results are representative as mean ± S.E. of three independent experiments using Student's t test. *, p < 0.05. B, cell cycle analysis by flow cytometry. 3T3-L1 cells of the indicated conditions were stained with propidium iodide (PI) on d1PDI. Cellular DNA contents were determined by flow cytometric analysis. G0/G1 represent 1n-fold DNA content and S and G2/M phases represent 2n-fold DNA content. Results are presented in percent for each plot. Results are representative of four independent experiments. C, flow cytometric analysis of BrdU incorporation for the indicated conditions of 3T3-L1 cells on d1PDI. Cells were stained with BrdU-APC and 7-AAD, and S phase (green population) was defined as BrdU-APC-positive cells. D, quantification of BrdU incorporation presented in C. Results are presented as mean ± S.E. from three independent experiments using Student's t test. *, p < 0.05.
FIGURE 7.
FIGURE 7.
SIRT1 reduction leads to dysregulation of MCE and adipogenic factors in differentiating 3T3-L1 adipocytes. A, Western blot analyses were performed for cell lysates of 3T3-L1 cells for the indicated conditions using antibodies against SIRT1, p27, C/EBPβ, PPARγ, and PGC1α. GAPDH was used as a loading control. Equal amounts of proteins lysates were run in separate gels. Membranes were incubated together with antibodies and developed at the same time with ECL substrate, and pictures were taken with the same intensity. Results are representative of three independent experiments. NDI, no DI; LAP, liver enriched activator protein; *, full length; LIP, liver enriched inhibitor proteins are C/EBP-β isoforms. B–F, Western blot bands were quantified and normalized to the GAPDH control. Results are represented as mean ± S.E. of three independent experiments using Student's t test. *, p < 0.05; n.s., not significant.
FIGURE 8.
FIGURE 8.
c-Myc expression and activation are altered, whereas SIRT1 is reduced during MCE of differentiating 3T3-L1 adipocytes. A, Western blot analysis was performed from cell lysates of 3T3-L1 cells for the indicated conditions using antibodies against total c-Myc and acetylated c-Myc (Lys-323). Actin and GAPDH were used as loading controls. Results are representative of three independent experiments. NDI, no DI. B–C, Western blot bands were quantified and normalized to the loading control. D, assessment of c-Myc transcriptional activity using a luciferase reporter assay. shSirt1 3T3-L1 cells were transfected with either pMyc-TA-Luc or pTA-Luc plasmids combined with pSV-β-gal plasmids, and, the following day, cells were induced to differentiate. Luciferase activity was measured and normalized to β-gal expression for both proliferating cells and differentiating cells on d1PDI. The luciferase activity for shSirt1 cells was compared with control shScramble control cells. Results are represented as mean ± S.E. of three independent experiments using Student's t test. *, p < 0.05; n.s., not significant.
FIGURE 9.
FIGURE 9.
SIRT1 knockdown and c-Myc activation drive the enhanced proliferation phenotype in different cell types. A–C, Western blotting was performed using antibodies against SIRT1 for the indicated conditions of 3T3-L1 preadipocytes: two different shSirt1 constructs (A), SW872 preadipocytes (shScramble and H-shSirt1 lentivirus-infected cells, B), and MEF cells (WT and sirt1−/−, C). Actin was used as a loading control. D–F, growth curves representing cell numbers of 3T3-L1 (D), SW872 cells (E), and MEF cells (F) of the indicated conditions at different time points. Results are representative as mean ± S.E. of three independent experiments using Student's t test. *, p < 0.05. G and I, assessment of c-Myc transcriptional activity using a luciferase reporter assay in shSirt1(2nd const.) 3T3-L1 cells (G), H-shSirt1 SW872 cells (H), and sirt1−/− MEFs (H). Cells were transfected with either pMyc-TA-Luc or pTA-Luc plasmids combined with the pSV-β-gal plasmid. The following day, 3T3-L1 and SW872 cells were induced to differentiate. Luciferase activity was measured and normalized to β-gal expression for both proliferating cells and differentiating cells on d1PDI (3T3-L1 cells) and d4PDI (SW872 cells). Luciferase activity for shSirt1(2nd const.) cells and H-shSirt1 cells was compared with the respective shScramble control cells and that of sirt1−/− MEF cells with WT MEF control cells. Results are represented as mean ± S.E. of three independent experiments using Student's t test. *, p < 0.05. J–O, Oil Red O staining of differentiated 3T3-L1 adipocytes (J and K) and SW872 adipocytes (M and N) for the indicated conditions. Nuclei were stained with hematoxylin. The areas in boxes are enlarged 4-fold at the top right. Scale bars = 100 μm. L and O, quantification of the data in J–K and M and N, respectively, for the number of adipocytes for each condition. Results are presented as mean ± S.E. from six different fields of three independent experiments using Student's t test. *, p < 0.05.
FIGURE 10.
FIGURE 10.
c-Myc reduction prevents the SIRT1 knockdown-induced adipocyte hyperplasia phenotype. A and B, Western blotting was performed using antibodies against c-Myc (A) and SIRT1 (B) for the following conditions of 3T3-L1 preadipocytes: control shScramble, two different constructs for shMyc (A), shSirt1 (B), and two different combinations of double infection using different antibiotics selections (puromycin (puro) and neomycin (neo)) (A and B). C–I, Oil Red O staining of differentiated 3T3-L1 adipocytes for the indicated conditions. Nuclei were stained with hematoxylin. The areas in boxes are enlarged 4-fold at the top right. Scale bars = 100 μm. J, quantification of the data in C–I for the number of adipocytes for each condition. Results are presented as mean ± S.E. from six different fields of three independent experiments using Student's t test. *, p < 0.05.
FIGURE 11.
FIGURE 11.
Model of SIRT1 regulation of preadipocyte proliferation and adipocyte MCE and differentiation. The schematic illustrates how SIRT1 controls preadipocyte proliferation and differentiation through the c-Myc pathway. Reduction or absence of SIRT1 leads to hyperplastic adipogenesis (right panel), and the presence of SIRT1 mediates normal adipogenesis (left panel). Arrow pointing top left, increase; arrow pointing bottom right, decrease; ×, reduction or inhibition.

References

    1. Könner A. C., and Brüning J. C. (2011) Toll-like receptors: linking inflammation to metabolism. Trends Endocrinol. Metab. 22, 16–23 - PubMed
    1. Hotamisligil G. S. (2006) Inflammation and metabolic disorders. Nature 444, 860–867 - PubMed
    1. Hotamisligil G. S. (2010) Endoplasmic reticulum stress and the inflammatory basis of metabolic disease. Cell 140, 900–917 - PMC - PubMed
    1. Tang Q. Q., and Lane M. D. (2012) Adipogenesis: from stem cell to adipocyte. Annu. Rev. Biochem. 81, 715–736 - PubMed
    1. Rosen E. D., and Spiegelman B. M. (2006) Adipocytes as regulators of energy balance and glucose homeostasis. Nature 444, 847–853 - PMC - PubMed

Publication types

MeSH terms