. 2015 Dec 29;112(52):16048-53.
doi: 10.1073/pnas.1521675112. Epub 2015 Dec 11.

Identification of MEDIATOR16 as the Arabidopsis COBRA suppressor MONGOOSE1

Affiliations

Identification of MEDIATOR16 as the Arabidopsis COBRA suppressor MONGOOSE1

Nadav Sorek et al. Proc Natl Acad Sci U S A. .

Abstract

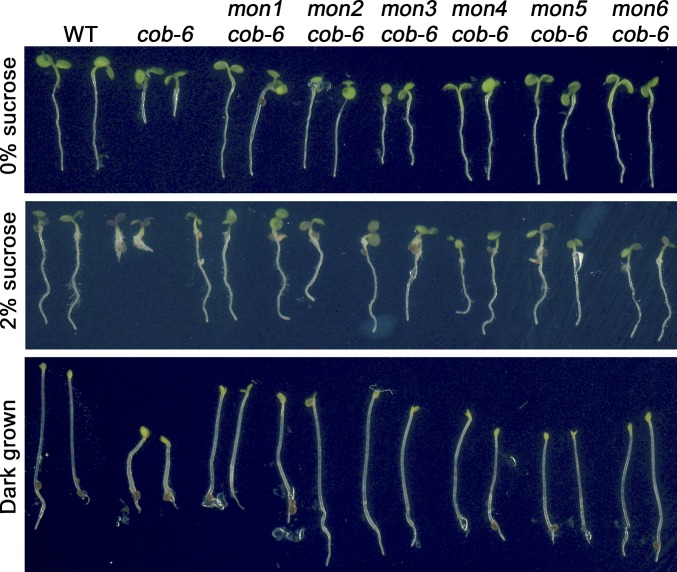
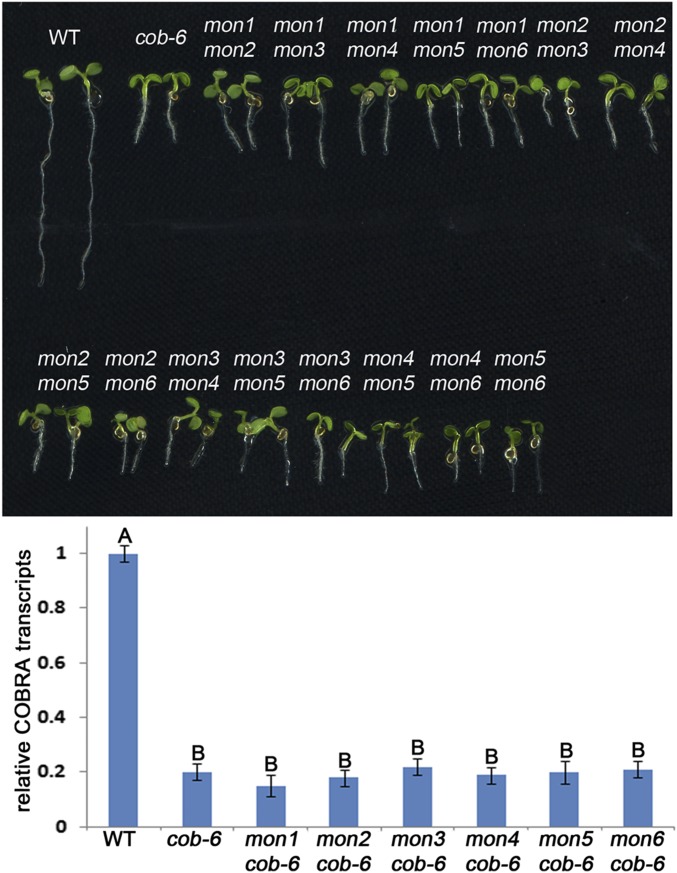
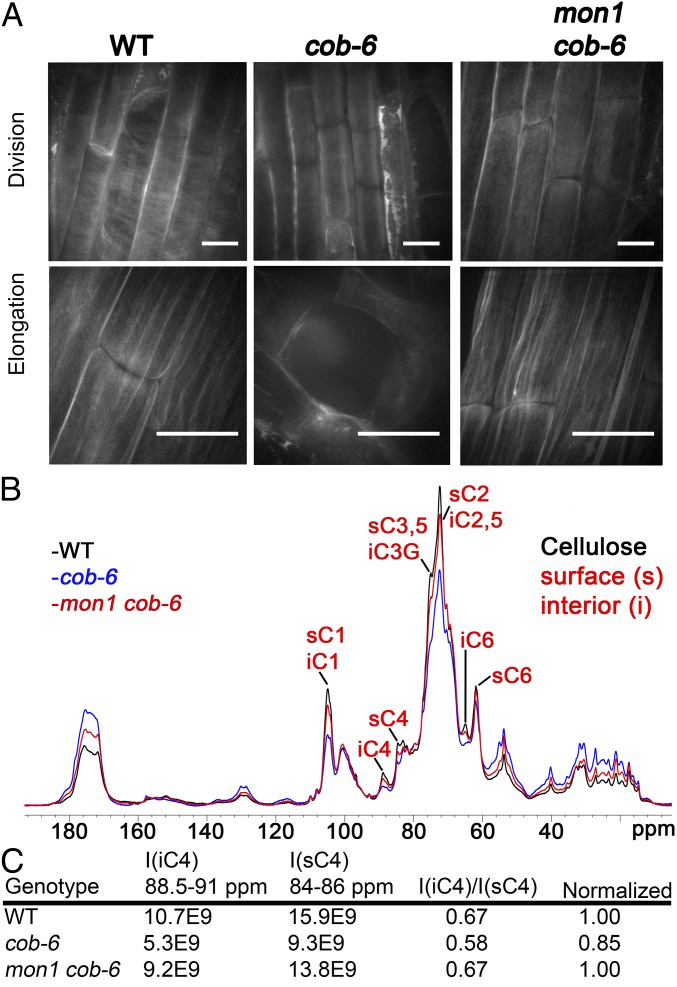
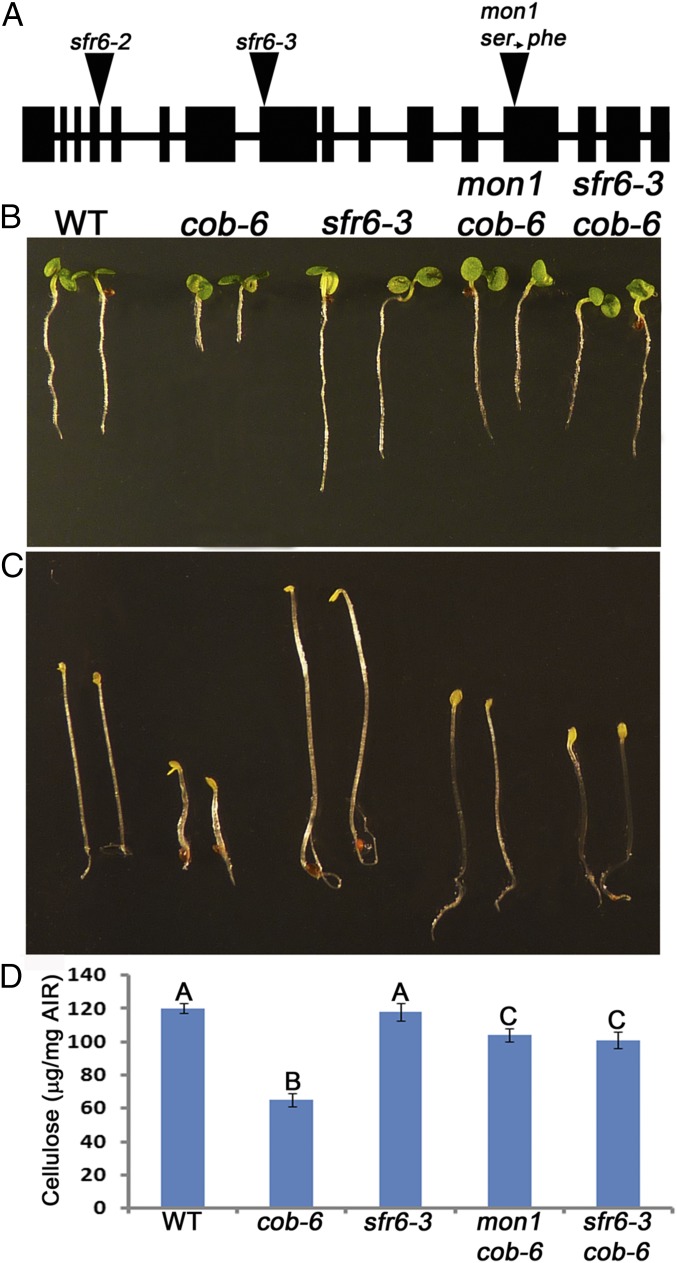
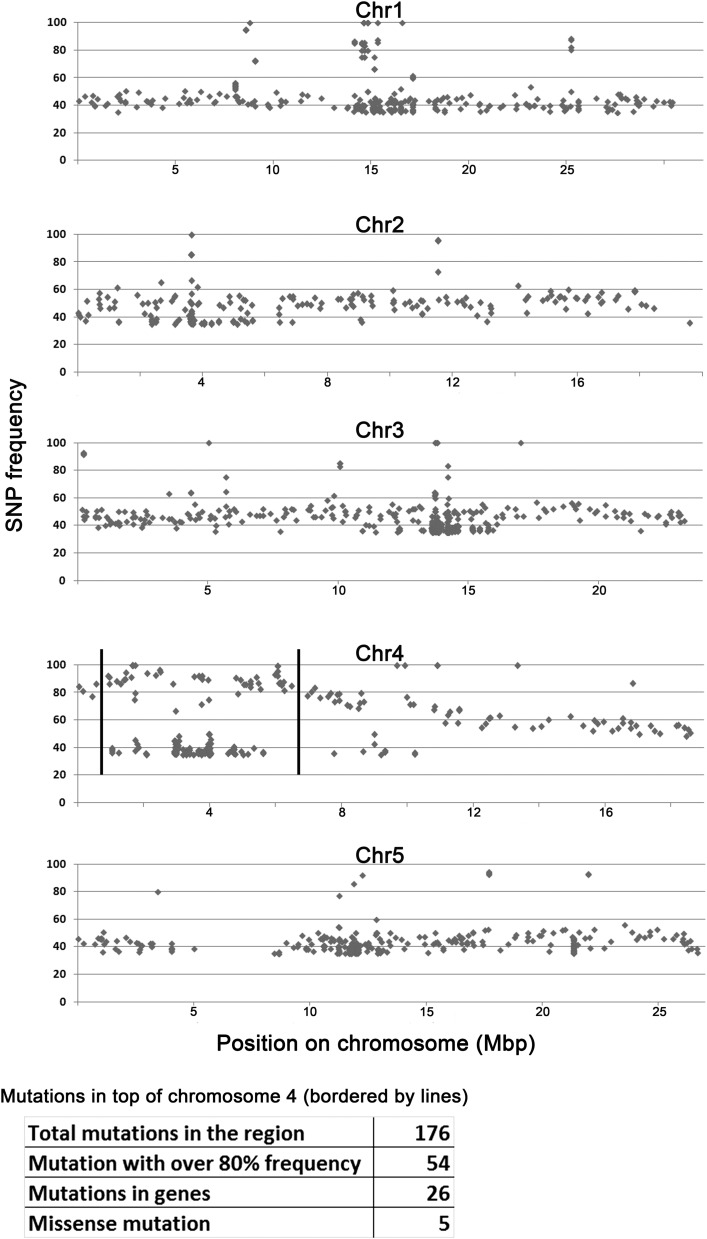
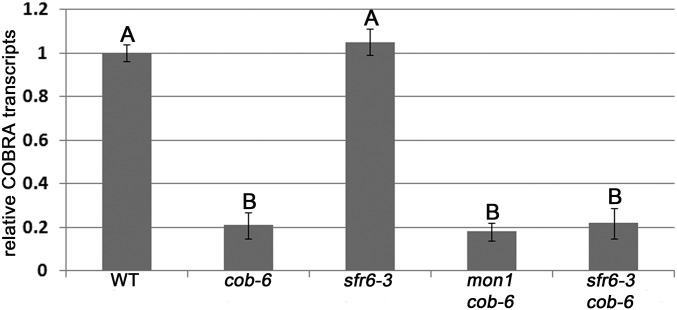
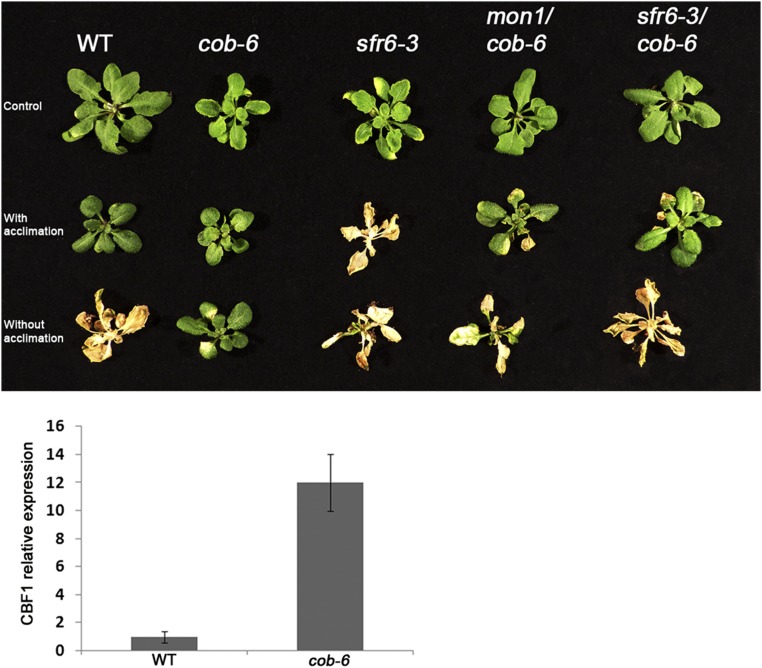
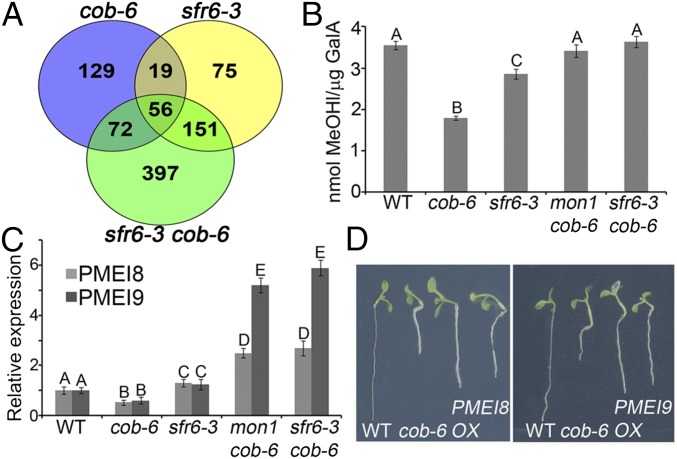
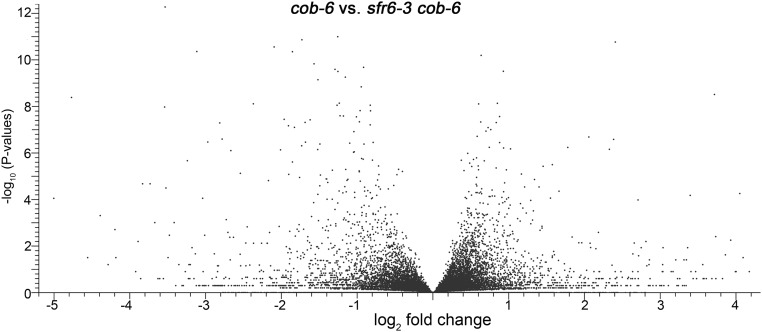
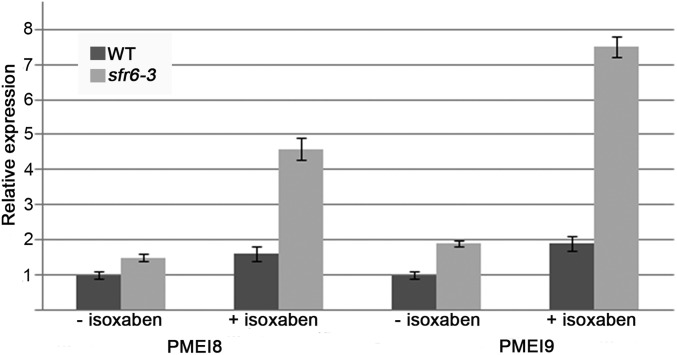
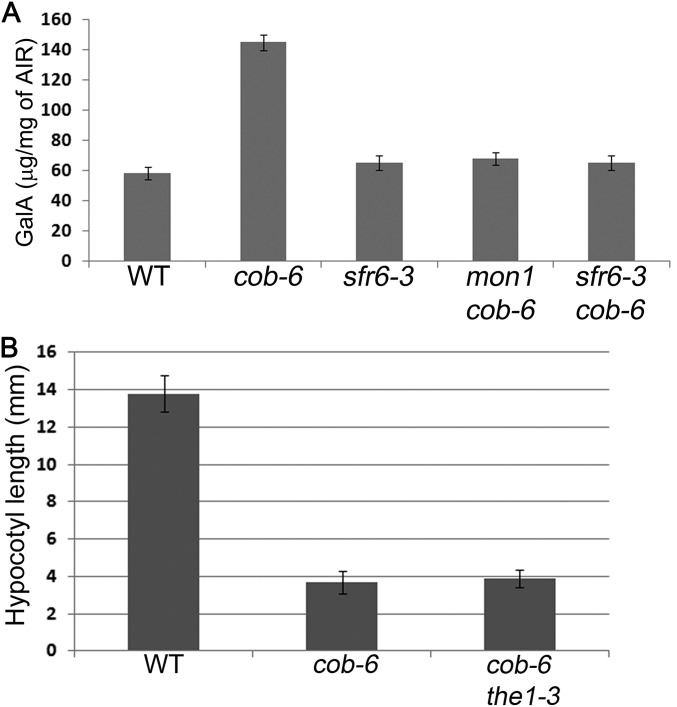
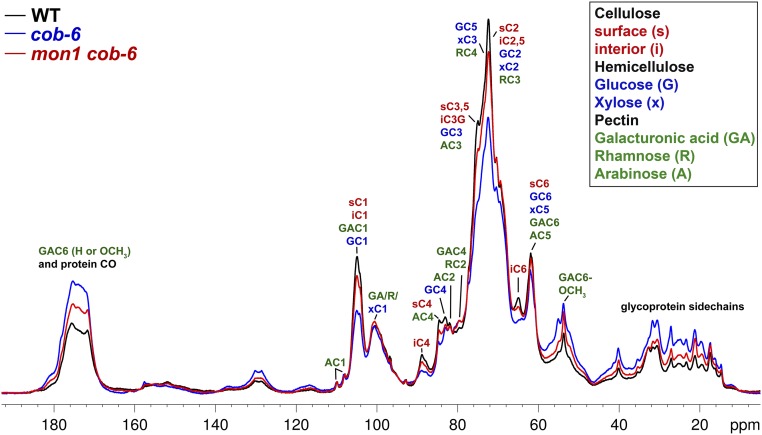
We performed a screen for genetic suppressors of cobra, an Arabidopsis mutant with defects in cellulose formation and an increased ratio of unesterified/esterified pectin. We identified a suppressor named mongoose1 (mon1) that suppressed the growth defects of cobra, partially restored cellulose levels, and restored the esterification ratio of pectin to wild-type levels. mon1 was mapped to the MEDIATOR16 (MED16) locus, a tail mediator subunit, also known as SENSITIVE TO FREEZING6 (SFR6). When separated from the cobra mutation, mutations in MED16 caused resistance to cellulose biosynthesis inhibitors, consistent with their ability to suppress the cobra cellulose deficiency. Transcriptome analysis revealed that a number of cell wall genes are misregulated in med16 mutants. Two of these genes encode pectin methylesterase inhibitors, which, when ectopically expressed, partially suppressed the cobra phenotype. This suggests that cellulose biosynthesis can be affected by the esterification levels of pectin, possibly through modifying cell wall integrity or the interaction of pectin and cellulose.

Keywords: cell wall; cellulose; freezing tolerance; pectin; transcription.


Conflict of interest statement

The authors declare no conflict of interest.

Figures

Fig. 1.
Fig. 1.
Phenotypes of the mongoose mutants. All mon lines are also homozygous for the cob-6 mutation.
Fig. S1.
Fig. S1.
Allelism test and COBRA RNA levels in mon lines. (Upper) F1 progeny from crosses between the mon lines demonstrate six independent mutations in the six mon lines. (Lower) qRT-PCR analysis shows that COBRA transcript levels in all mon lines are similar to the levels in cob-6. Bars indicate means ± standard deviation. Letters above the bars indicate significant differences based on one-way ANOVA and Tukey's test, P < 0.05.
Fig. 2.
Fig. 2.
Cellulose macrostructure and amount in mon1 cob-6 mutant. (A) Cellulose in root cells stained with S4B. In cob-6, staining is reduced and less homogeneous, with some cells exhibiting almost a complete lack of fluorescence. Fibrils that can be detected are not as defined as in wild type, and are not as regularly oriented (Upper, cob-6). In mon1 cob-6, fibrils were similar to wild type, more so in elongated cells. (Scale bars, 15 μm.) (B) One-dimensional ssNMR analysis. Quantitative 13C direct polarization (DP)-MAS ssNMR spectra of wild-type, cob-6, and mon1 cob-6 cell walls. Additional annotation is shown in Fig. S8. (C) Relative intensities of interior and surface cellulose C4 signals from 13C DP-MAS spectra.
Fig. 3.
Fig. 3.
Properties of med16 mutants. (A) Gene structure of AT4G04920 (MED16) showing T-DNA insertion sites and the mon1 mutation. (B and C) Growth phenotype of 7-d light-grown seedlings (B) and 5-d dark-grown hypocotyls (C) showing suppression of the cob-6 phenotype by mon1 and sfr6-3. (D) Cellulose measurement showing suppression of cob-6 cellulose deficiency. Values are means ± standard deviation. Letters above the bars indicate significant differences based on one-way ANOVA and Tukey's test, P < 0.05. AIR, alcohol-insoluble residue.
Fig. S2.
Fig. S2.
Genomic DNA sequence analysis for mon1. Two hundred F2 segregants from a mon1 cob-6 line backcrossed to cob-6 were pooled for whole-genome sequencing. To identify the region containing the causative mutation, we plotted the SNP frequencies (y axis). We identified the region of the causative mutation in the top arm of chromosome 4 (bordered by lines), and the table presents the statistics for this region. A point mutation in SFR6 with 95% SNP frequency was identified in this region.
Fig. S3.
Fig. S3.
COBRA suppression in cob-6 sfr6-3 is not due to restoration of COBRA transcript levels. qRT-PCR analysis shows that COBRA transcript levels in sfr6-3 cob-6 are the same as in cob-6 and mon1 cob-6. Bars indicate means ± standard deviation. Letters above the bars indicate significant differences based on one-way ANOVA and Tukey's test, P < 0.05.
Fig. S4.
Fig. S4.
Freezing experiments. All lines were either cold-acclimated at 4 °C for 8 d (With acclimation) or directly (Without acclimation) transferred to −7 °C for 16 h. Photos were taken 5 d after the freezing treatments. cob-6 was found to be resistant to freezing, and qPCR showed that CBF1 expression is significantly higher in control cob-6 plants compared with wild type, suggesting that the cell wall damage in cob-6 triggers a stress response that likely confers freezing tolerance. Bars indicate means ± standard deviation.
Fig. 4.
Fig. 4.
Increased transcription of pectin methylesterase inhibitors and the restoration of pectin esterification to wild-type levels in mon1 cob-6 and sfr6-3 cob-6. Bar graphs indicate means ± standard deviation. Letters above the bars indicate significant differences based on one-way ANOVA and Tukey's test, P < 0.05. (A) Venn diagram for RNA-seq analysis of cob-6, sfr6-3, and sfr6-3 cob-6 shows all genes that are up-regulated and down-regulated compared with wild type with 1.5-fold change or above. For further analysis, we looked at genes that are misexpressed between sfr6-3 cob-6 and cob-6, and identified 48 cell wall-related genes. (B) Pectin esterification levels in the different lines. Values were normalized to the total amount of galacturonic acid (Fig. S7A). (C) Steady-state mRNA levels of two pectin methylesterase inhibitor genes, AT3G17130 (PMEI8) and AT1G62770 (PMEI9), in various genotypes. (D) PMEI8 and PMEI9 were overexpressed (OX) in the cob-6 background. Ten independent lines were analyzed, all demonstrating partial suppression of the cob-6 phenotype.
Fig. S5.
Fig. S5.
Volcano plot comparing differences in gene expression between cob-6 and sfr6-3 cob-6. Data for this plot are in GEO accession no. GSE75199.
Fig. S6.
Fig. S6.
PMEI8 and PMEI9 are up-regulated in sfr6-3 when treated with isoxaben. Seedlings were grown with 1 nM isoxaben or with only DMSO (no isoxaben) for 7 d. PMEI8 and PMEI9 expression was analyzed using qRT PCR. Bars indicate means ± standard deviation.
Fig. S7.
Fig. S7.
Additional information about the various lines. (A) Galacturonic acid content in the different genotypes. (B) The theseus1 mutation does not suppress the cobra phenotype. Hypocotyl length was measured in dark-grown seedlings grown on 1/2MS medium without carbohydrate. n ≥ 20. Bars indicate means ± standard deviation.
Fig. S8.
Fig. S8.
Quantitative 13C DP-MAS ssNMR spectra of wild-type, cob-6, and mon1 cob-6 cell walls. This figure shows the same data as in Fig. 2 but provides additional assignments of selected carbons from noncellulosic components of the cell walls.

References

    1. Somerville C, et al. Toward a systems approach to understanding plant cell walls. Science. 2004;306(5705):2206–2211. - PubMed
    1. Wallace IS, Somerville CR. A blueprint for cellulose biosynthesis, deposition, and regulation in plants. In: Fukuda H, editor. Plant Cell Wall Patterning and Cell Shape. Wiley, Hoboken, NJ; 2015. pp. 65–97.
    1. McFarlane HE, Döring A, Persson S. The cell biology of cellulose synthesis. Annu Rev Plant Biol. 2014;65:69–94. - PubMed
    1. Li S, Bashline L, Lei L, Gu Y. Cellulose synthesis and its regulation. Arabidopsis Book. 2014;12:e0169. - PMC - PubMed
    1. Kumar M, Turner S. Plant cellulose synthesis: CESA proteins crossing kingdoms. Phytochemistry. 2015;112:91–99. - PubMed

Publication types

MeSH terms

Associated data