. 2015 Dec 29;112(52):16024-9.
doi: 10.1073/pnas.1506214112. Epub 2015 Dec 11.

Discontinuity of cortical gradients reflects sensory impairment

Affiliations

Discontinuity of cortical gradients reflects sensory impairment

Noam Saadon-Grosman et al. Proc Natl Acad Sci U S A. .

Abstract

Topographic maps and their continuity constitute a fundamental principle of brain organization. In the somatosensory system, whole-body sensory impairment may be reflected either in cortical signal reduction or disorganization of the somatotopic map, such as disturbed continuity. Here we investigated the role of continuity in pathological states. We studied whole-body cortical representations in response to continuous sensory stimulation under functional MRI (fMRI) in two unique patient populations-patients with cervical sensory Brown-Séquard syndrome (injury to one side of the spinal cord) and patients before and after surgical repair of cervical disk protrusion-enabling us to compare whole-body representations in the same study subjects. We quantified the spatial gradient of cortical activation and evaluated the divergence from a continuous pattern. Gradient continuity was found to be disturbed at the primary somatosensory cortex (S1) and the supplementary motor area (SMA), in both patient populations: contralateral to the disturbed body side in the Brown-Séquard group and before repair in the surgical group, which was further improved after intervention. Results corresponding to the nondisturbed body side and after surgical repair were comparable with control subjects. No difference was found in the fMRI signal power between the different conditions in the two groups, as well as with respect to control subjects. These results suggest that decreased sensation in our patients is related to gradient discontinuity rather than signal reduction. Gradient continuity may be crucial for somatotopic and other topographical organization, and its disruption may characterize pathological processing.

Keywords: fMRI; plasticity; somatotopy; topographic maps; whole-body representation.


Conflict of interest statement

The authors declare no conflict of interest.

Figures

Fig. 1.
Fig. 1.
Qualitative representation of gradients in a representative patient with Brown-Séquard syndrome. Cross-correlation maps corresponding to continuous somatosensory stimulation of a patient with left hemihypoesthesia due to partial cervical Brown-Séquard syndrome are shown. Note the continuous character of gradients in the hemisphere contralateral to the healthy body side in the primary somatosensory cortex (S1; Upper Left) and supplementary motor area (SMA; Lower Left), compared with discontinuous gradients in the hemisphere corresponding to the disturbed body side (Right). Color scale represents body parts from lips (dark red) to toe (dark blue). Extracted gradients (white rectangles) are magnified (for an example of a patient before and after surgical repair, see Fig. S2).
Fig. 2.
Fig. 2.
Gradient quantification. (A) The original functional image of a gradient is shown, including centroids corresponding to clusters of different lag-values. (B) Centroids are shown with the corresponding lag color and linear fit. (C) Trend line optimization: centroids (black) projected on different trend lines (red dots) varying 35 degrees rotation clockwise and anti-clockwise and four vertical translations. Black lines represent the original linear fit and the variation that yielded the lowest gradient dispersion value (GDV).
Fig. S1.
Fig. S1.
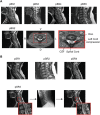
Patients’ structural MRI. Sagittal T2 weighted imaging of patients' structural MRI is shown for the Brown-Séquard (A) and surgical-repair groups (B). For patient BS2, axial image demonstrates left cord compression (radiological view). For patient SR3, postsurgical X-ray and MRI images are shown, highlighting the results of surgical repair. D, dorsal; L, left; pBS, Brown-Séquard patient; pSR, surgical-repair patient; R, right; V, ventral.
Fig. S2.
Fig. S2.
Qualitative representation of gradients before and after surgical repair of cervical disk protrusion (representative patient). Cross-correlation maps for continuous somatosensory stimulation of a patient with cervical disk protrusion before (Left) and after (Right) surgical repair is shown for S1 (Upper) and SMA (Lower) homunculi. Note the continuous character of gradients after surgical repair. Extracted gradients are shown for the right hemisphere, contralateral to stimulation of the left body side. Color scale represents body parts from lips (dark red) to toe (dark blue). Extracted gradients (white rectangles) are magnified.
Fig. 3.
Fig. 3.
Group analysis of GDV and signal power. (A) Brown-Séquard group: GDV. Mean GDVs of all patients' gradients contralateral to the disturbed (dark gray) and nondisturbed (light gray) body sides, as well as healthy controls (white, averaged over both hemispheres), are presented for S1 (Left) and the SMA (Right) separately. Note the difference between disturbed and nondisturbed/control gradients (P < 0.05), as well as the similarity between nondisturbed gradients and healthy controls. Error bars represent SEM. (B) Brown-Séquard group: signal power. Percent signal change of whole-body representation in all conditions did not reveal any significant differences. (C) Surgical repair group: GDV. Mean GDVs of all patients' gradients before (dark brown) and after (light brown) surgical repair, as well as healthy controls (white), are presented for S1 (Left) and the SMA (Right) separately. (D) Surgical repair group: signal power. Percent signal change of whole-body representation did not reveal any significant differences between conditions.
Fig. S3.
Fig. S3.
Percent signal change of somatosensory representations: Brown-Séquard syndrome (individual patients). Percent signal change at the maximum value of epoch-based event-related averaging (−1 to 1 TR around condition onset) in cheek (red), palm (green), and toe (blue) responses are shown at S1 (Left) and the SMA (Right) for each individual patient. Light colors represent responses in the hemisphere contralateral to the disturbed body side (pBS1 to -5: right, left, left, left, right; activation for cheek in patient 5 is missing due to a technical problem during recording), and dark colors represent responses in the hemisphere contralateral to the nondisturbed body side. Note the lack of consistent pattern of activation in between patients, conditions, or body parts. pBS, patient with Brown-Séquard.
Fig. S4.
Fig. S4.
Percent signal change of somatosensory representations before and after surgical repair (SR) of cervical disk protrusion (individual patients). Percent signal change at the maximum value of epoch-based event-related averaging (−1 to 1 TR around condition onset) in cheek (red), palm (green), and toe (blue) responses are shown at S1 (Left) and the SMA (Right). Light colors represent responses before surgical repair, and dark colors represent responses after repair. Responses are shown at the hemisphere contralateral to the more disturbed body side. Note the lack of significant consistent pattern of activation in between patients, conditions, or body parts.
Fig. S5.
Fig. S5.
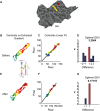
Illustration of the gradient extraction and quantification procedure (representative patient before and after surgery, right hemisphere). (A) At first, a patch-of-interest (POI) [parallel to region-of-interest (ROI) defined on a flat cortex surface; Brain Voyager] is extracted anatomically (verified with block design peaks of cheek, palm, and toe activations) for S1 (yellow) and the SMA (red). (B). The extracted gradient is segmented into clusters using the MATLAB (MathWorks) image-processing toolbox. Each color represents one lag number out of 12 that manifests the highest correlation coefficient between the predicted response and the time course at a specific voxel (cluster's threshold size was set to 70 pixels). For each cluster, a geometric centroid is calculated using the MATLAB image-processing toolbox (marked with a white dot on the original image). (C) Centroids are projected on a linear fit, yielding a one-dimensional series, depicting a one-dimensional order of lag-values. (D) To quantify the gradient dispersion value (GDV), the distribution of a difference series (the difference between each pair of lag-values) was calculated. A perfect gradient is characterized by uniform distribution of one (red). The GDV is calculated by the variance of this differences distribution. (EG) The same procedure was repeated for each patient in both conditions. Note the improvement in the GDV as reflected in the different stages of the procedure.

References

    1. Penfield W, Boldrey E. Somatic motor and sensory representation in the cerebral cortex of man as studied by electrical stimulation. J Neurol. 1937;60:389–443.
    1. Penfield W, Rasmussen T. The Cerebral Cortex of Man: A Clinical Study of Localization of Function. Hafner; New York: 1950.
    1. Fox PT, Burton H, Raichle ME. Mapping human somatosensory cortex with positron emission tomography. J Neurosurg. 1987;67(1):34–43. - PubMed
    1. Nakamura A, et al. Somatosensory homunculus as drawn by MEG. Neuroimage. 1998;7(4 Pt 1):377–386. - PubMed
    1. Narici L, et al. Neuromagnetic somatosensory homunculus: A non-invasive approach in humans. Neurosci Lett. 1991;121(1-2):51–54. - PubMed

Publication types

LinkOut - more resources