. 2016 Feb 1;115(2):967-77.
doi: 10.1152/jn.00889.2015. Epub 2015 Dec 9.

Is the notion of central fatigue based on a solid foundation?

Affiliations

Is the notion of central fatigue based on a solid foundation?

Paola Contessa et al. J Neurophysiol. .

Abstract

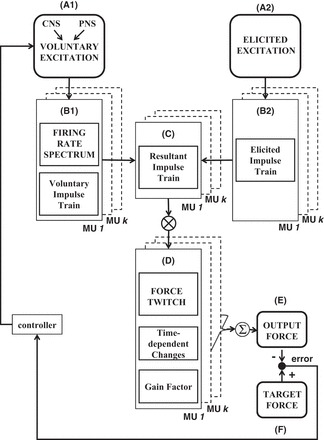
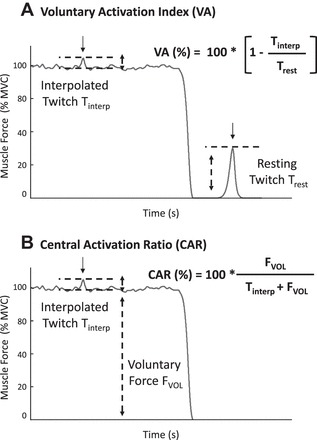
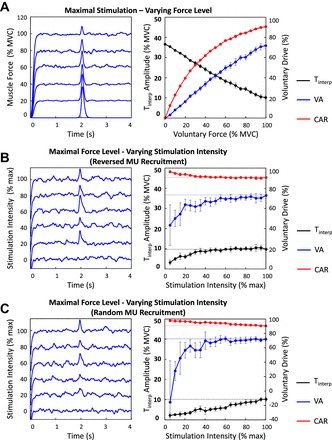
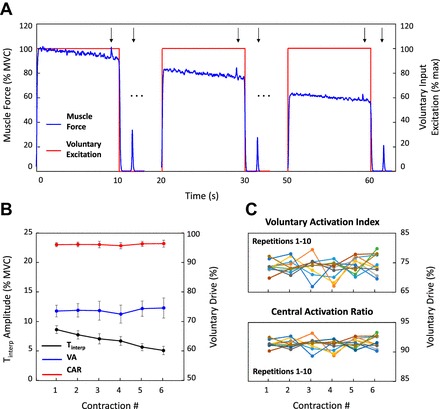
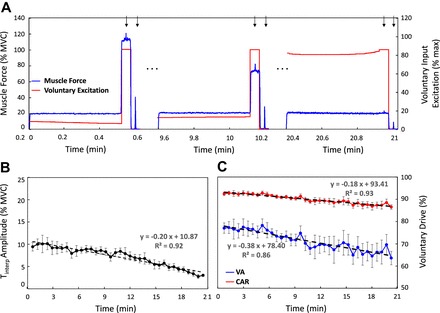
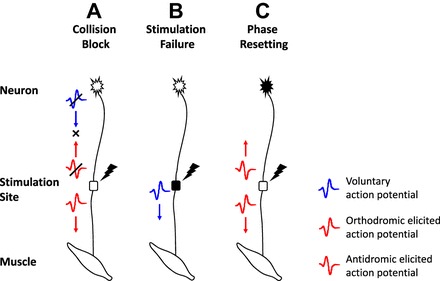
Exercise-induced muscle fatigue has been shown to be the consequence of peripheral factors that impair muscle fiber contractile mechanisms. Central factors arising within the central nervous system have also been hypothesized to induce muscle fatigue, but no direct empirical evidence that is causally associated to reduction of muscle force-generating capability has yet been reported. We developed a simulation model to investigate whether peripheral factors of muscle fatigue are sufficient to explain the muscle force behavior observed during empirical studies of fatiguing voluntary contractions, which is commonly attributed to central factors. Peripheral factors of muscle fatigue were included in the model as a time-dependent decrease in the amplitude of the motor unit force twitches. Our simulation study indicated that the force behavior commonly attributed to central fatigue could be explained solely by peripheral factors during simulated fatiguing submaximal voluntary contractions. It also revealed important flaws regarding the use of the interpolated twitch response from electrical stimulation of the muscle as a means for assessing central fatigue. Our analysis does not directly refute the concept of central fatigue. However, it raises important concerns about the manner in which it is measured and about the interpretation of the commonly accepted causes of central fatigue and questions the very need for the existence of central fatigue.

Keywords: central fatigue; interpolated twitch; motor units; voluntary drive.


Figures

Fig. 1.
Fig. 1.
Model schematic. The force model has 2 inputs: the voluntary input excitation (A1) and the elicited input excitation (A2). The former represents the sum of all excitatory and inhibitory inputs from the central nervous system (CNS) and from the peripheral nervous system (PNS) to all the motor units in the pool of a muscle. The latter represents the effect of electrical stimulation to a muscle or nerve supplying a muscle. The voluntary input excitation determines the firing behavior and impulse trains of motor units (MUs) during voluntary contractions (B1). The voluntary impulse trains interact with the elicited impulse trains (B2) if motor units are concurrently activated by the elicited input excitation. The resultant impulse trains (C) include the combined effect of both excitation sources. They are convolved with the time-dependent and firing rate-dependent motor unit force twitches (D) to compute the force contribution of the active motor units. Motor unit forces are summed to obtain the muscle output force (E), which is compared with the target force (F). The tracking error between output and target force is used to adjust the input excitation. See text for additional details.
Fig. 2.
Fig. 2.
Quantification of voluntary drive. Graphic representation of 2 measures of voluntary drive: the voluntary activation index (VA; A) and the central activation ratio (CAR; B). A maximal stimulus is delivered during a voluntary contraction, and the additional force elicited by the stimulation is referred to as the interpolated twitch, or Tinterp. For the computation of VA, an additional force twitch is elicited by electrical stimulation on the muscle at rest (in the absence of concurrent voluntary contraction) and is referred to as the resting twitch, or Trest. FVOL is the magnitude of the muscle force generated during voluntary contraction. Arrows indicate the time of electrical stimulation.
Fig. 3.
Fig. 3.
Amplitude of the interpolated twitch and voluntary drive as a function of voluntary force and stimulation intensity. Left: A: voluntary muscle force simulated at force levels increasing from 0% to 100% maximal voluntary contraction (MVC) with superimposed single maximal stimulus. B and C: voluntary muscle force simulated at 100% MVC with superimposed single stimulus elicited at stimulation intensities increasing from 0% to maximal. Electrical stimulation was modeled to activate motor units in order of inverse physiological recruitment (B) and in random order (C). Right: amplitude of Tinterp, VA, and CAR as a function of increasing voluntary force (A) and stimulation intensity (B and C). Values are displayed as averages ± SD of the estimates from 10 repetitions of the simulated protocol.
Fig. 4.
Fig. 4.
Simulated maximal voluntary efforts. A: muscle force generated during the simulation of a maximal effort sustained for 60 s during which peripheral fatigue developed. Peripheral fatigue was modeled as a time-varying decrease in the amplitude of the motor unit force twitches. The contraction was interrupted every 10 s, and a single maximal stimulus was simulated before each break superimposed on the maximal voluntary force and during each break on the muscle at rest. Voluntary input excitation remained maximal throughout the simulated protocol. Arrows indicate the time of simulated electrical stimulation. B: amplitude of Tinterp, VA, and CAR as a function of contraction number. Values are displayed as averages ± SD of the estimates from 10 repetitions of the simulated protocol. C: VA and CAR as a function of contraction number for all repetitions of the simulated task.
Fig. 5.
Fig. 5.
Repeated submaximal voluntary contractions. A: simulated muscle force during the first, middle, and last contractions of a series of tasks sustained at 20% MVC during which peripheral fatigue developed and repeated until the endurance limit. Peripheral fatigue was modeled as a time-varying decrease in the amplitude of the force twitch of the active motor units. A 3-s maximal effort was simulated at the end of each repetition. A single maximal stimulus was simulated on the superimposed maximal effort and on the muscle at rest between contractions. Voluntary input excitation increased over time in order to compensate for the decrease in the amplitude of the motor unit force twitches (i.e., peripheral fatigue) and maintain the 20% MVC target force level (see text for details). Voluntary input excitation remained at maximal level during every maximal task to exclude the development of central fatigue. Arrows indicate the time of simulated electrical stimulation. B: amplitude of Tinterp as a function of time. C: VA and CAR as a function of time. Values are displayed as averages ± SD of the estimates from 10 repetitions of the simulated protocol.
Fig. A1.
Fig. A1.
Interaction between voluntary and elicited firings. Graphic representation of the interactions between voluntary and elicited action potentials: collision block (A), stimulation failure (B), and phase resetting (C). Refer to text for additional details.

References

    1. Adam A, De Luca CJ. Recruitment order of motor units in human vastus lateralis muscle is maintained during fatiguing contractions. J Neurophysiol 90: 2919–2927, 2003. - PubMed
    1. Adam A, De Luca CJ. Firing rates of motor units in human vastus lateralis muscle during fatiguing isometric contractions. J Appl Physiol 99: 268–280, 2005. - PubMed
    1. Arampatzis A, Mademli L, De Monte G, Walsh M. Changes in fascicle length from rest to maximal voluntary contraction affect the assessment of voluntary activation. J Biomech 40: 3193–3200, 2007. - PubMed
    1. Babault N. The interpolated twitch to determine voluntary activation in various conditions. J Appl Physiol 107: 360, 2009. - PubMed
    1. Bawa P, Stein RB. Frequency response of human soleus muscle. J Neurophysiol 39: 788–793, 1976. - PubMed

Publication types

LinkOut - more resources