. 2016 Jan;18(1):65-75.
doi: 10.1038/ncb3285. Epub 2015 Dec 14.

The centrosome is an actin-organizing centre

Affiliations

The centrosome is an actin-organizing centre

Francesca Farina et al. Nat Cell Biol. 2016 Jan.

Abstract

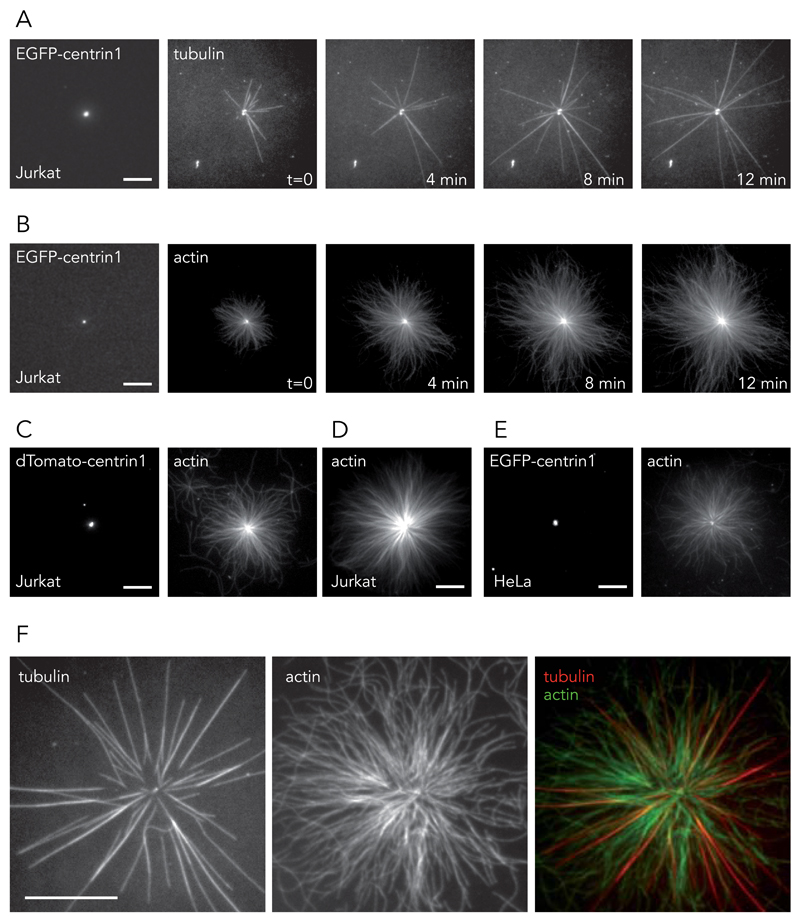
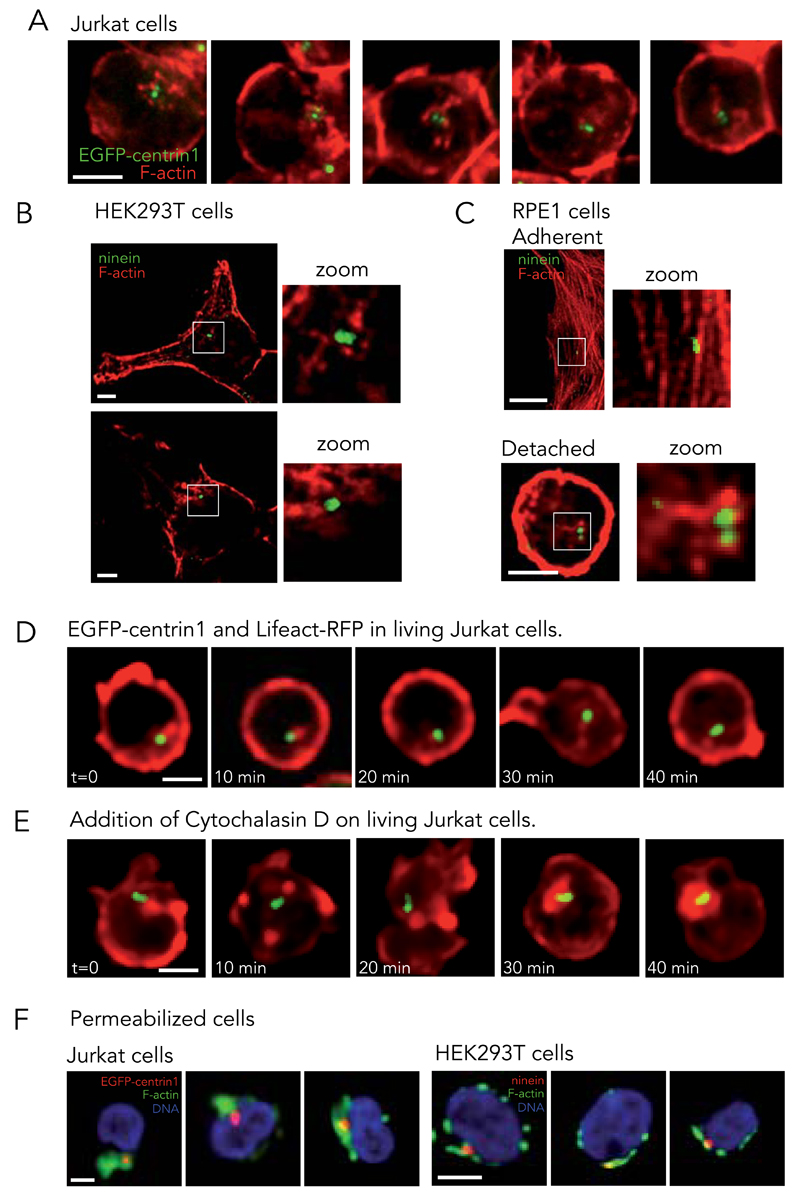
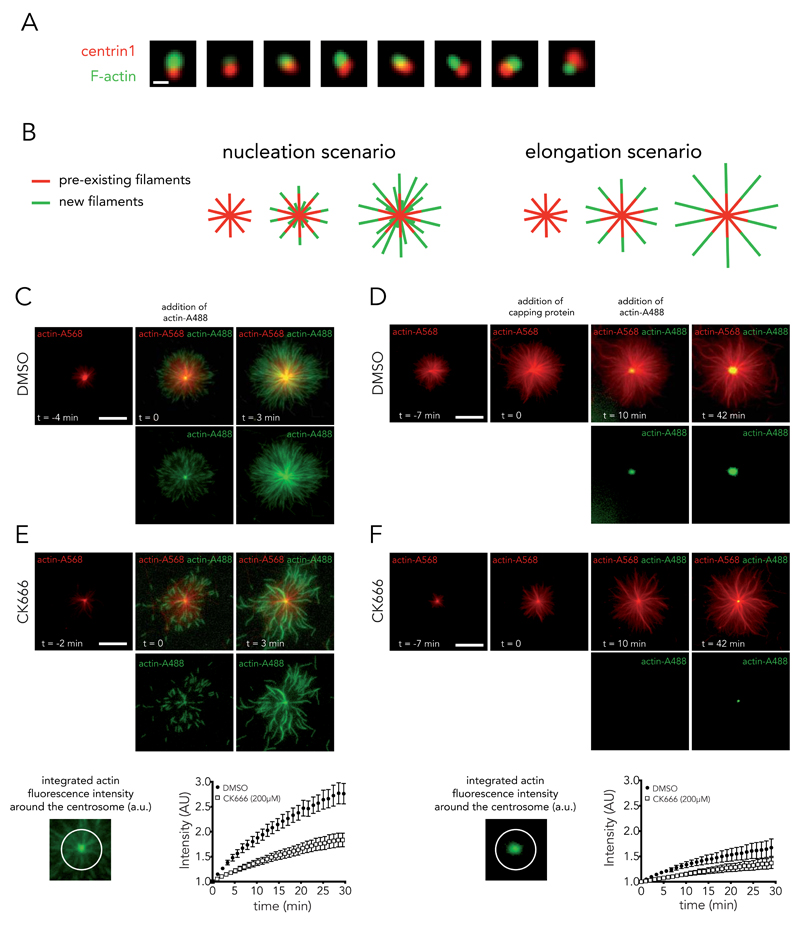
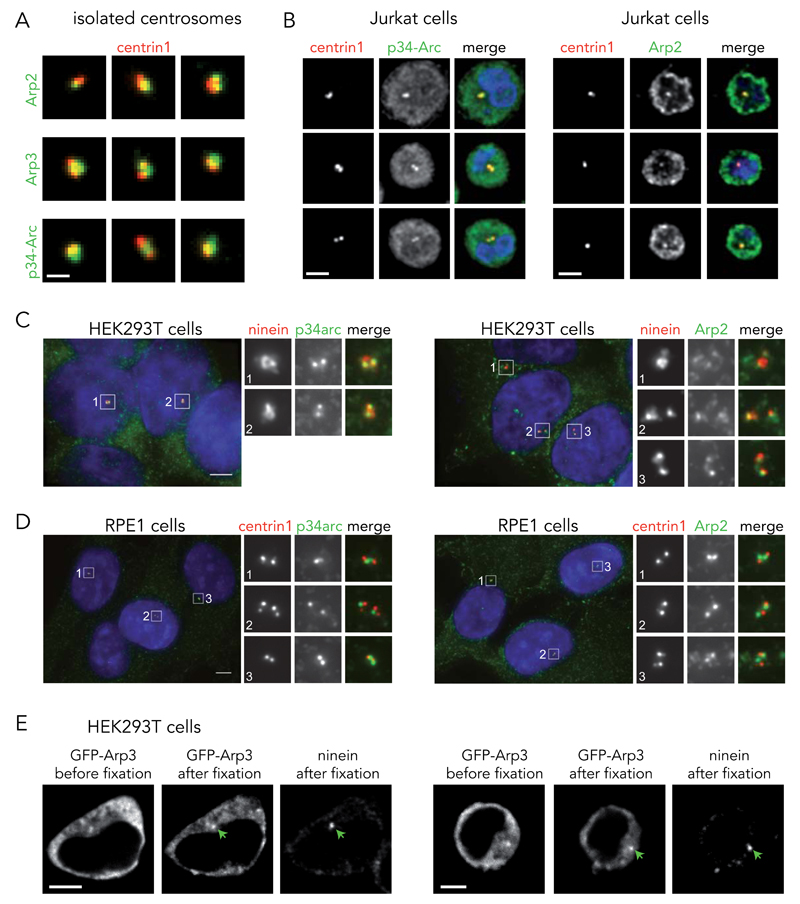
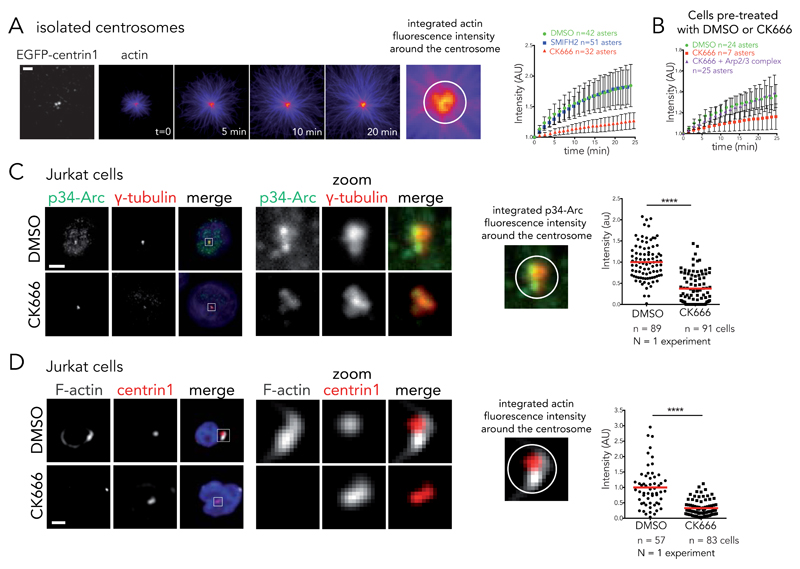
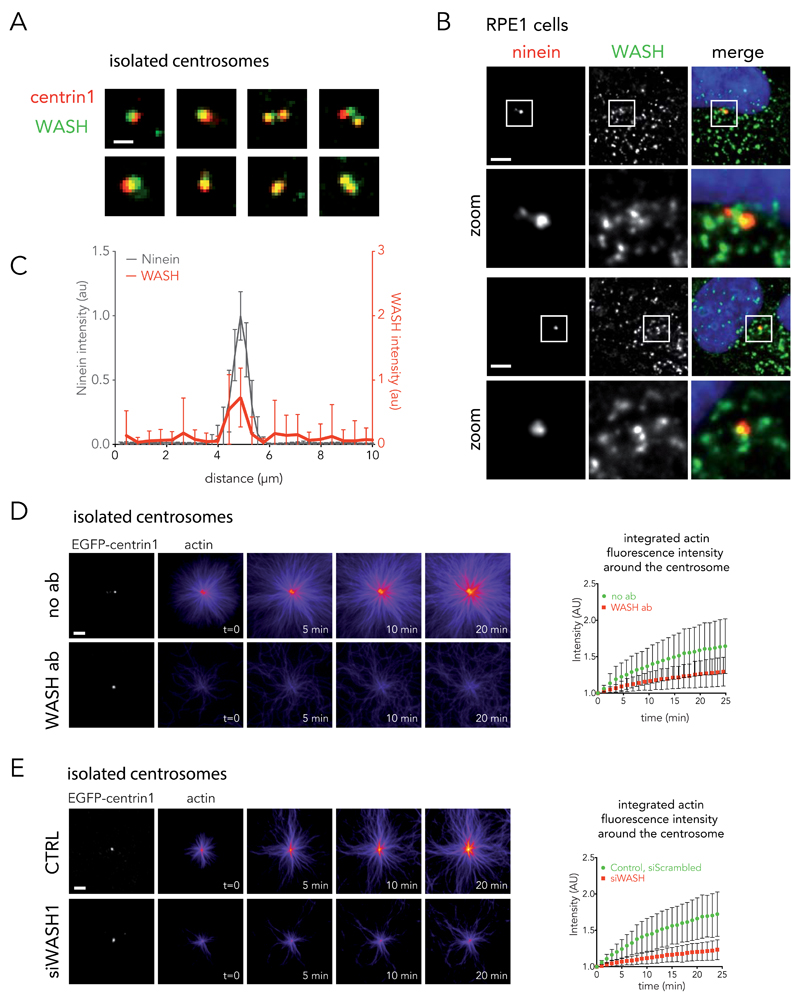
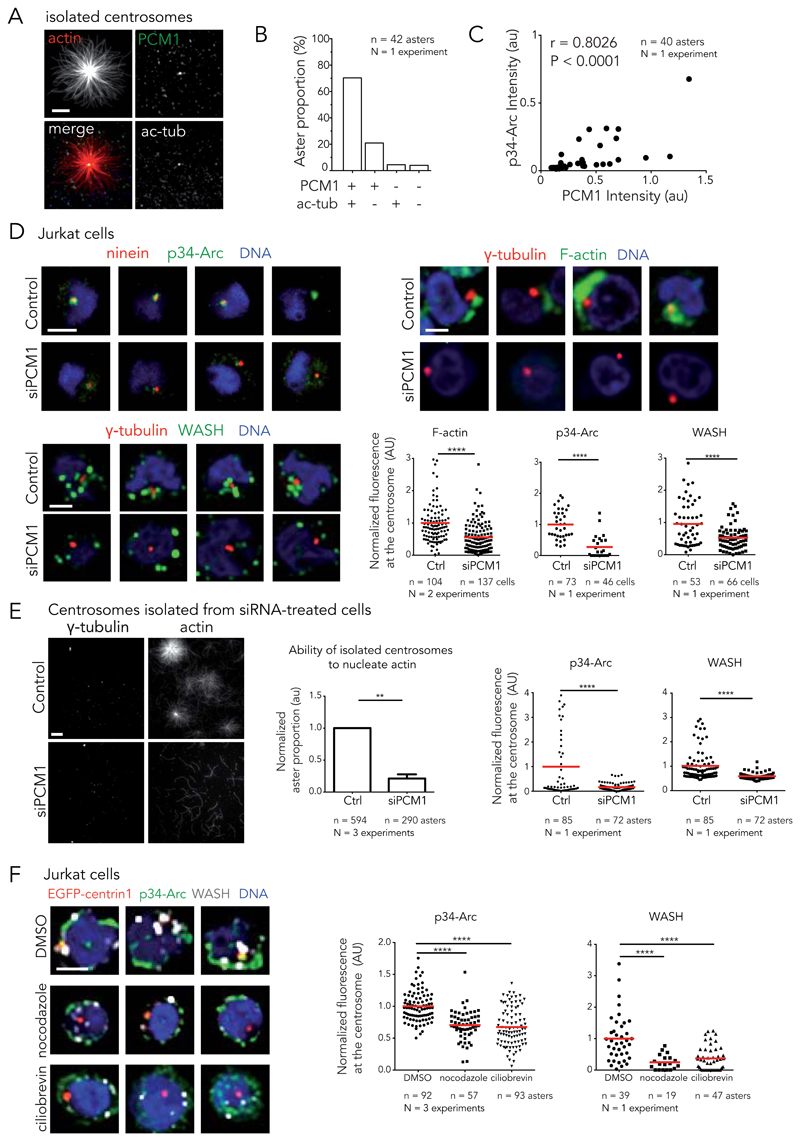
Microtubules and actin filaments are the two main cytoskeleton networks supporting intracellular architecture and cell polarity. The centrosome nucleates and anchors microtubules and is therefore considered to be the main microtubule-organizing centre. However, recurring, yet unexplained, observations have pointed towards a connection between the centrosome and actin filaments. Here we have used isolated centrosomes to demonstrate that the centrosome can directly promote actin-filament assembly. A cloud of centrosome-associated actin filaments could be identified in living cells as well. Actin-filament nucleation at the centrosome was mediated by the nucleation-promoting factor WASH in combination with the Arp2/3 complex. Pericentriolar material 1 (PCM1) seemed to modulate the centrosomal actin network by regulating Arp2/3 complex and WASH recruitment to the centrosome. Hence, our results reveal an additional facet of the centrosome as an intracellular organizer and provide mechanistic insights into how the centrosome can function as an actin-filament-organizing centre.


Conflict of interest statement

Competing financial interests

The authors declare no competing financial interests.

Figures

Figure 1
Figure 1. Cytoskeleton filament assembly from isolated centrosomes.
(A and B) Centrosomes were isolated from T lymphocytes expressing EGFP-centrin1 and seeded on glass coverslips. (A) The addition of purified tubulin dimers led to the assembly of dynamic microtubules. Time is in minutes. Images are representative of 7 independent experiments. (B) The addition of purified actin monomers led to the assembly of radial arrays of actin filaments. Time is in minutes. Images are representative of 12 independent experiments. (C, D and E) Centrosomes were isolated from Jurkat cells expressing dTomato-centrin1 (5 independent experiments) (C), non-modified Jurkat cells (5 independent experiments) (D) and from HeLa cells expressing EGFP-centrin1 (8 independent experiments) (E). All centrosome preparations induced the growth of actin filaments in the presence actin monomers. (F) The assembly of both microtubules and actin filaments from isolated centrosomes. Images are representative of 5 independent experiments. Scale bars:10 μm.
Figure 2
Figure 2. Association of actin filaments with centrosome in living cells.
(A) Actin filaments staining with phalloidin (red) in Jurkat cells expressing EGFP-centrin1 (green). Images are representative of 4 independent experiments. (B) F-actin (phalloidin, red) and ninein (green) in HEK293T cells. Images are representative of 2 independent experiments. (C) F-actin (phalloidin, red) and ninein (green) in RPE1 cells, adherent and in solution. Images are representative of 2 independent experiments. Cells were fixed with PFA. (D) Time-series of Jurkat cells expressing EGFP-centrin1 (green) transfected with Lifeact-RFP to visualize actin network (red). Image gamma was set to 0.65 to highlight the cytoplasmic network. Images are representative of 6 independent experiments. (E) Same as (D) except after the addition of 10 μg/ml cytochalasin D at t=0. Images are representative of 3 independent experiments. (F) DNA (blue) and F-actin (phalloidin, green) in pre-permeabilized and fixed Jurkat cells (left panel) expressing EGFP-centrin1 (red) and HEK293T cells (right panel) stained for ninein (red). Images are representative of 5 and 2 independent experiments for Jurkat and HEK293T cells respectively. Scale bars: 5 μm.
Figure 3
Figure 3. Isolated centrosomes nucleate actin filaments.
(A) Actin-filament staining with phalloidin (green) on isolated centrosomes (EGFP-centrin1 in red). Images are representative of 4 independent experiments. Scale bar: 2 μm. (B) Schematic representations of actin-filament nucleation and elongation hypotheses. (C, E) Time-lapse imaging of actin-filament assembly from isolated centrosomes in the presence of Alexa568-actin monomers (red) followed by addition of Alexa488-actin monomers (green). Bottom row shows green channel and top row the overlay. Growth of green actin filaments at the centrosome supported the nucleation hypothesis. Actin nucleation activity was measured at the centrosome in the presence of DMSO (full circles, mean of n = 9 actin asters) or 0.2 mM of CK666 (empty squares, mean of n = 17 actin asters); data show the results of a single experiment, representative of 2 independent experiments. Bars represent the s.d. (D, F) Same as (C, E) except that capping protein is added 10 minutes prior to Alexa488-actin monomers to block red actin filaments. Here also, growth of green actin filaments at the centrosome supported the nucleation hypothesis. DMSO and CK666 mean of n = 15 and 21 actin asters respectively; data show the results of a single experiment, representative of 3 independent experiments. Bars represent s.d. With or without the capping of older actin filaments, Arp2/3 inhibition reduced actin nucleation at the centrosome. Scale bars:10 μm.
Figure 4
Figure 4. Arp2/3 complex localizes to the centrosome.
(A) Immunofluorescence staining of isolated centrosomes (EGFP-centrin1 in red) with antibodies against Arp2, Arp3 or p34-Arc subunits of the Arp2/3 complex (green). Images are representative of 4 independent experiments. Scale bar; 2 μm. (B) Immunofluorescence staining of T lymphocytes for p34-Arc and Arp2 after fixation with cold methanol. EGFP-centrin1 is shown in red, p34-Arc and Arp2 (2 independent experiments) in green and the DNA in blue. Scale bar: 10 µm. (C) Immunofluorescence staining of methanol-fixed HEK293T cells with antibodies to ninein (red) and p34arc or Arp2 (both green). DNA is in blue (1 experiment). Scale bar: 10 μm. (D) Methanol-fixed RPE1 cells stably expressing EGFP-centrin1 (red) stained with antibodies to p34arc or Arp2 (both green). DNA is in blue. Both p34arc and Arp2 juxtapose EGFP-centrin1 suggesting that the subunits of the Arp2/3 complex localize to or towards the proximal ends of centrioles. Images are representative of 3 independent experiments. Scale bars; 5 μm. (E) Distribution of EGFP-Arp3 in HEK293T cells before and after fixation (PFA + methanol) and ninein staining. Green arrows indicate the centrosome position. Images are representative of 2 independent experiments. Scale bar: 10 μm.
Figure 5
Figure 5. Arp2/3 complex inactivation impairs actin filament nucleation at the centrosome.
(A) Time-lapse imaging of actin filament assembly from isolated centrosomes. “Fire” look-up table of actin images reveals that fluorescence intensity increases at the centrosome over time. This intensity was integrated over a 2 μm diameter circle around the centrosome and plotted against time in the presence of DMSO, 0.2 mM SMIFH2 or 0.2 mM of CK666 (right panel). Intensities were normalized with respect to initial intensity. Data show the results of a single experiment, representative of 3 independent experiments. Errors bars represent standard deviation. Scale bar: 5 μm. (B) Actin nucleation activity for centrosomes isolated from DMSO or CK666-treated cells. Addition of 100 nM purified Arp2/3 complex restores nucleation activity of CK666-treated centrosomes. Data show the results of a single experiment, representative of 3 independent experiments. Errors bars represent standard deviation. (C) Immunostaining of p34-Arc (green), γ-tubulin (red) and DNA (blue) at the centrosome of Jurkat cells incubated with DMSO or 0.2 mM CK666 and subsequently fixed with cold methanol. Right panel: p34-Arc fluorescence integrated over a 3 μm diameter circle around the centrosome for DMSO and CK666 condition. **** p ≤ 0.0001. Scale bar: 5 μm. (D) Immunostaining of F-actin (phalloidin, white) at the centrosome (EGFP-centrin1, red) of Jurkat cells incubated with DMSO or 0.2 mM CK666 and subsequently treated with detergent prior to PFA fixation. Actin fluorescence intensity was integrated over a 4 μm diameter circle around the centrosome to compare the two conditions (right panel). **** p ≤ 0.0001. Scale bar: 5 μm. Red bar indicates the mean. Unpaired t-test with Welch’s correction was used to generate p values.
Figure 6
Figure 6. Implication of the WASH complex in actin nucleation at the centrosome
(A) Immunostaining of WASH (green) on isolated centrosomes (EGFP-centrin1 in red). Images are representative of 2 independent experiments. Scale bar: 2 μm. (B) RPE1 cells were fixed in cold methanol and stained for ninein (left panel) and WASH (central panel). Right panel shows the overlay of WASH (green), ninein (red) and DNA (blue). Images are representative of 3 independent experiments. Scale bar: 5 μm. (C) Linescan analysis of fluorescent distribution of WASH (red line) at the centrosome (ninein, black line) (mean of n = 31 cells, data are pooled from 2 independent experiments). Bars represent the s.d. (D) Inhibition of WASH on isolated centrosomes with blocking antibodies (bottom row). Control experiments performed without antibody (no ab, top row). Data show the results of a single experiment, representative of 2 independent experiments: n = 25 and 27 actin asters for no antibody (green discs) and WASH antibody (red squares) respectively (mean ± s.d.). Scale bar: 5 μm. (E) Actin nucleation activity of centrosomes isolated from siWASH1-treated cells (bottom row) or control cells (top row). Data show the results of a single experiment, representative of 2 independent experiments: n = 20 and 26 actin asters for control (green discs) and siWASH1 (red squares) condition respectively (mean ± s.d.). Scale bar: 5 μm.
Figure 7
Figure 7. Regulation of actin filament assembly at the centrosome by PCM1.
(A) Immunostaining of PCM1 (green) and acetylated-tubulin (white) on isolated centrosomes in the presence of actin (red). Scale bar: 10 μm. (B) Quantification of aster proportion depending on the composition of the nucleation center (42 asters, 1 experiment). (C) Amount of p34-Arc plotted against PCM1 amount on isolated centrosomes. Pearson correlation coefficient (r) and P-value measure the correlation between the two variables. (D) Knockdown of PCM1 in Jurkat cells. Left panels: methanol fixed cells, ninein (red), p34-Arc (green) and DNA (blue) (top) and γ-tubulin (red), WASH (green) and DNA (blue) (bottom). Top right: cells treated with detergent prior to PFA fixation and stained for γ-tubulin (red), F-actin (phalloidin, green) and DNA (blue). Top row: control siRNA. Bottom row: PCM1 siRNA. Scale bars: 5 γm. Graph: fluorescence intensity at the centrosome of F-actin, p34-Arc and WASH. **** p ≤ 0.0001. (E) Left: centrosomes isolated from siPCM1 treated cells (bottom row) or control cells (top row) in the presence of actin and stained for γ-tubulin. Scale bar: 5 γm. Centre: ability of isolated centrosomes to nucleate actin calculated as ratio of the number of actin asters divided by the number of γ-tubulin spots. Error bar; s.d. ** p ≤ 0.01. Right: fluorescence intensity of p34-Arc and WASH. **** p ≤ 0.0001 . (F) Representative staining of Jurkat cells incubated with DMSO (top panel), nocodazole (central panel) and ciliobrevin D (bottom panel) and stained for DNA (blue), ninein (red), p34-Arc (green) and WASH (white). Scale bars: 5 γm. Graph: p34-Arc and WASH amount at the centrosome. **** p ≤ 0.0001. Red bar indicates the mean. Unpaired t-test with Welch’s correction was used to generate p values.

Comment in

References

    1. Bornens M. Organelle positioning and cell polarity. Nat Rev Mol Cell Biol. 2008;9:874–886. - PubMed
    1. Etienne-Manneville S. Actin and microtubules in cell motility: which one is in control? Traffic. 2004;5:470–7. - PubMed
    1. Rodriguez OC, et al. Conserved microtubule – actin interactions in cell movement and morphogenesis. Nat Cell Biol. 2003;5:599–609. - PubMed
    1. Coles CH, Bradke F. Coordinating Neuronal Actin–Microtubule Dynamics. Curr Biol. 2015;25:R677–R691. - PubMed
    1. Chesarone Ma, DuPage AG, Goode BL. Unleashing formins to remodel the actin and microtubule cytoskeletons. Nat Rev Mol Cell Biol. 2010;11:62–74. - PubMed

Publication types