

Application of an autoregressive integrated moving average model for predicting injury mortality in Xiamen, China
- PMID: 26656013
- PMCID: PMC4679986
- DOI: 10.1136/bmjopen-2015-008491
Application of an autoregressive integrated moving average model for predicting injury mortality in Xiamen, China
Abstract
Objective: Injury is currently an increasing public health problem in China. Reducing the loss due to injuries has become a main priority of public health policies. Early warning of injury mortality based on surveillance information is essential for reducing or controlling the disease burden of injuries. We conducted this study to find the possibility of applying autoregressive integrated moving average (ARIMA) models to predict mortality from injuries in Xiamen.
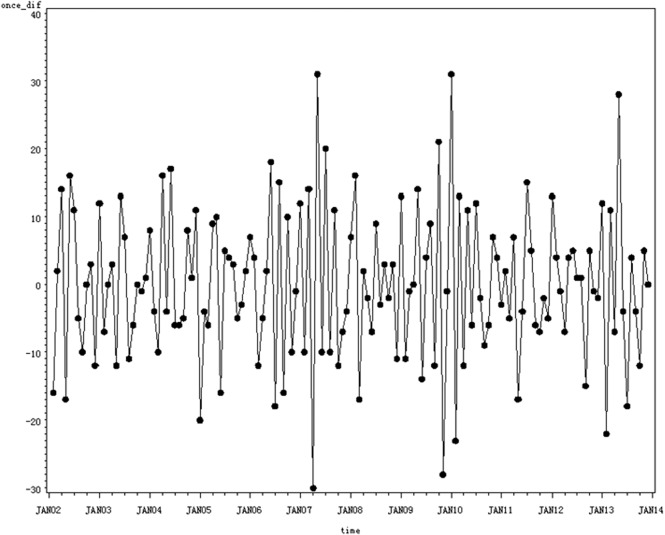
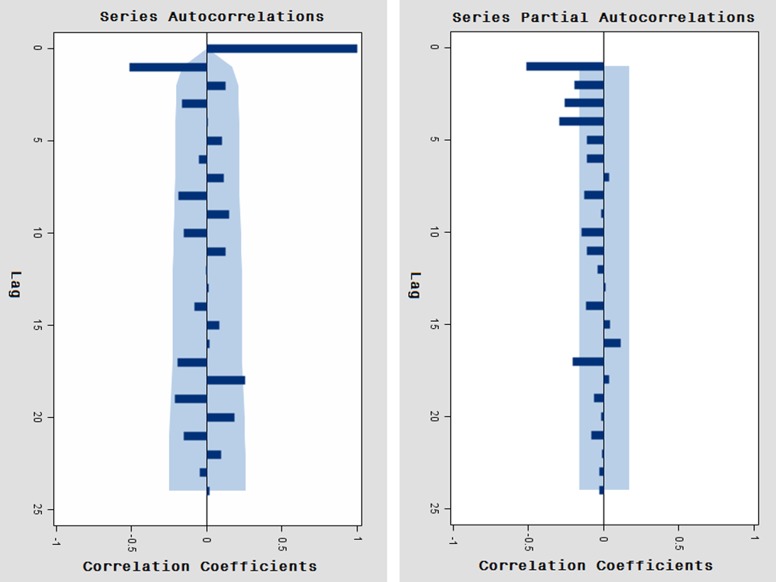
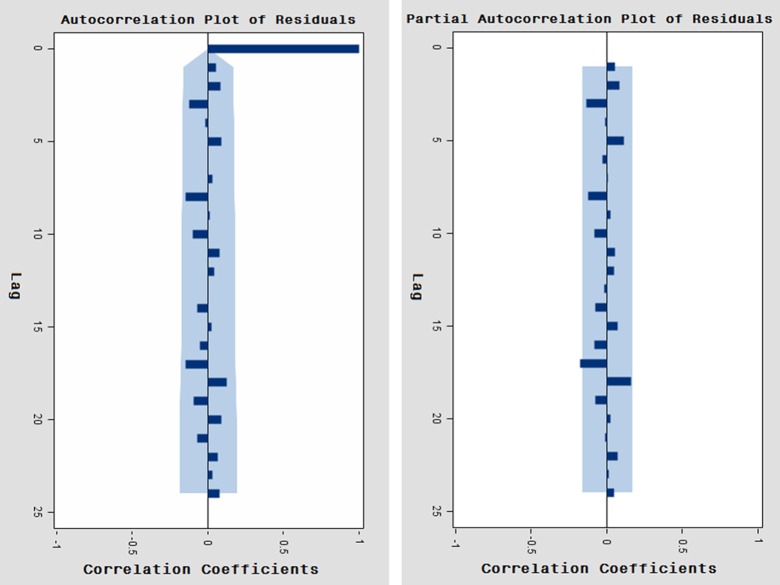
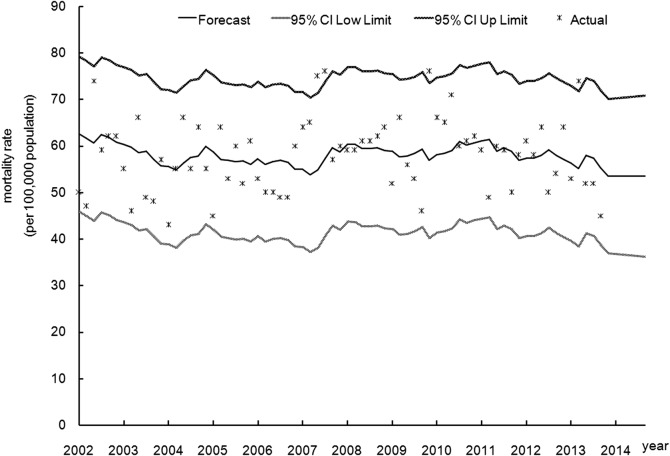
Method: The monthly mortality data on injuries in Xiamen (1 January 2002 to 31 December 2013) were used to fit the ARIMA model with the conditional least-squares method. The values p, q and d in the ARIMA (p, d, q) model refer to the numbers of autoregressive lags, moving average lags and differences, respectively. The Ljung-Box test was used to measure the 'white noise' and residuals. The mean absolute percentage error (MAPE) between observed and fitted values was used to evaluate the predicted accuracy of the constructed models.
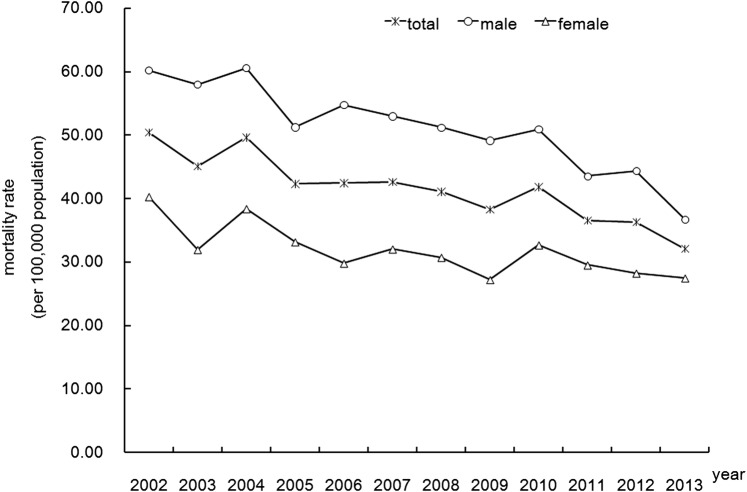
Results: A total of 8274 injury-related deaths in Xiamen were identified during the study period; the average annual mortality rate was 40.99/100,000 persons. Three models, ARIMA (0, 1, 1), ARIMA (4, 1, 0) and ARIMA (1, 1, (2)), passed the parameter (p<0.01) and residual (p>0.05) tests, with MAPE 11.91%, 11.96% and 11.90%, respectively. We chose ARIMA (0, 1, 1) as the optimum model, the MAPE value for which was similar to that of other models but with the fewest parameters. According to the model, there would be 54 persons dying from injuries each month in Xiamen in 2014.
Conclusion: The ARIMA (0, 1, 1) model could be applied to predict mortality from injuries in Xiamen.
Keywords: ARIMA; injury; prediction; time serial.
Published by the BMJ Publishing Group Limited. For permission to use (where not already granted under a licence) please go to http://www.bmj.com/company/products-services/rights-and-licensing/
Figures
References
-
- World Health Organization. Health statistics and information systems/Estimates for 2000–2012/CAUSE-SPECIFIC MORTALITY. 2014. http://www.who.int/healthinfo/global_burden_disease/estimates/en/index1.... (accessed 20 Sept 2014).
-
- China Ministry of Health. Injury prevention report in China. 1st edn, Beijing: People's Medical Publishing House, 2007:10.
Publication types
MeSH terms
LinkOut - more resources
Full Text Sources
Other Literature Sources
Medical