Diabetes-Associated Changes in Cortical Auditory-Evoked Potentials in Relation to Normal Aging
- PMID: 26656318
- PMCID: PMC5551416
- DOI: 10.1097/AUD.0000000000000255
Diabetes-Associated Changes in Cortical Auditory-Evoked Potentials in Relation to Normal Aging
Abstract
Objectives: (1) To characterize the influence of type 2 diabetes mellitus (DM) on cortical auditory-evoked potentials (CAEPs) separate from the effects of normal aging, and (2) to determine whether the disease-related effects are modified by insulin dependence.
Design: A cross-sectional study was conducted in a large cohort of Veterans to investigate the relationships among type 2 DM, age, and CAEPs in randomly selected participants with (N = 108) and without (N = 114) the disease and who had no more than a moderate hearing loss. Participants with DM were classified as insulin-dependent (IDDM, N = 47) or noninsulin-dependent (NIDDM, N = 61). Other DM measures included concurrent serum glucose, HbA1c, and duration of disease. CAEPs were evoked using a passive homogeneous paradigm (single repeating stimulus) by suprathreshold tones presented to the right ear, left ear, or both ears. Outcome measures were adjusted for the pure-tone threshold average for frequencies of 0.5, 1, and 2 kHz and analyzed for differences in age effects between participant groups using multiple regression.
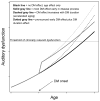
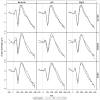
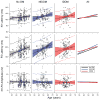
Results: There is little variation across test ear conditions (left, right, binaural) on any CAEP peak in any of the groups. Among no-DM controls, P2 latency increases about 9 msec per decade of life. DM is associated with an additional delay in the P2 latency of 7 and 9 msec for the IDDM and NIDDM groups, respectively. Moreover, the slope of the function relating P2 latency with age is similar across participant groups and thus the DM effect appears constant across age. Effects on N1 latency are considerably weaker, with age effects of less than 4 msec per decade across all groups, and DM effects of only 2 (IDDM) or 3 msec (NIDDM). In the NIDDM group, the slope relating N1 latency to age is steeper relative to that observed for the no-DM group, providing some evidence of accelerated "aging" for this CAEP peak. DM does not substantially reduce N1-P2 amplitude and age relationships with N1-P2 amplitude are effectively absent. There is no association between pure-tone average at 0.5, 1, and 2 kHz and any aspect of CAEPs in this cohort.
Conclusions: In a large cohort of Veterans, we found that type 2 DM is associated with prolonged N1 and P2 latencies regardless of whether insulin is required to manage the disease and independent of peripheral hearing thresholds. The DM-related effects on CAEP latencies are threefold greater for P2 compared with N1, and there is little support that at the cortical level, IDDM participants had poorer responses compared with NIDDM participants, although their responses were more variable. Overall, these results indicate that DM is associated with slowed preattentive neural conduction. Moreover, the observed 7 to 9 msec P2 latency delay due to DM is substantial compared with normal age changes in P2, which are 9 msec per decade of life in this cohort. Results also suggest that whereas N1 latency changes with age are more pronounced among individuals with DM versus without DM, there was no evidence for more rapid aging of P2 among patients with DM. Thus, the damage responsible for the major DM-related differences may occur early in the DM disease process. These cross-sectional results should be verified using a longitudinal study design.
Figures


References
-
- American Diabetes Association, ADA. Fast Facts: Data and statistics about diabetes (revised 3/2015) 2015
-
- Aimoni C, Bianchini C, Borin M, et al. Diabetes, cardiovascular risk factors and idiopathic sudden sensorineural hearing loss: A case-control study. Audiology and Neurotology. 2009;15(2):111–115. - PubMed
-
- Akinpelu OV, Mujica-Mota M, Daniel SJ. Is type 2 diabetes mellitus associated with alterations in hearing? A systematic review and meta-analysis. Laryngoscope. 2014a;124:767–776. - PubMed
-
- Akinpelu OV, Ibrahim F, Waissbluth S, et al. Histopathologic changes in the cochlea associated with diabetes mellitus-a review. Otol Neurotol. 2014b;35(5):764–74. - PubMed
Publication types
MeSH terms
Substances
Grants and funding
LinkOut - more resources
Full Text Sources
Other Literature Sources
Medical

