. 2016 Jan;19(1):65-74.
doi: 10.1038/nn.4193. Epub 2015 Dec 14.

Oligodendrocyte death results in immune-mediated CNS demyelination

Affiliations

Oligodendrocyte death results in immune-mediated CNS demyelination

Maria Traka et al. Nat Neurosci. 2016 Jan.

Abstract

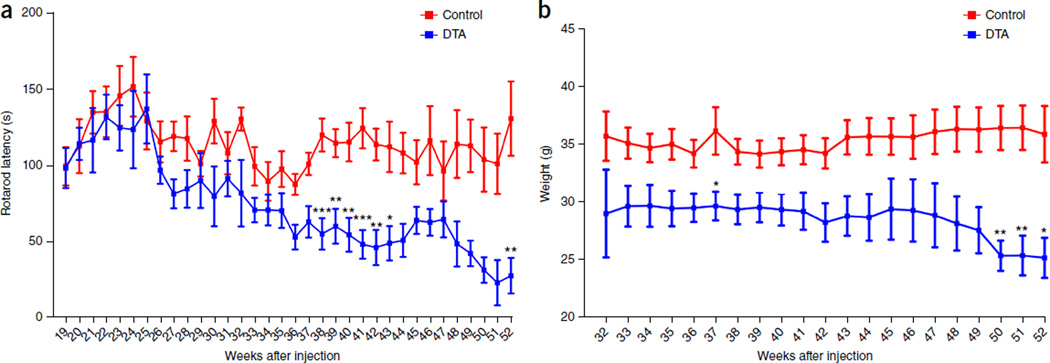
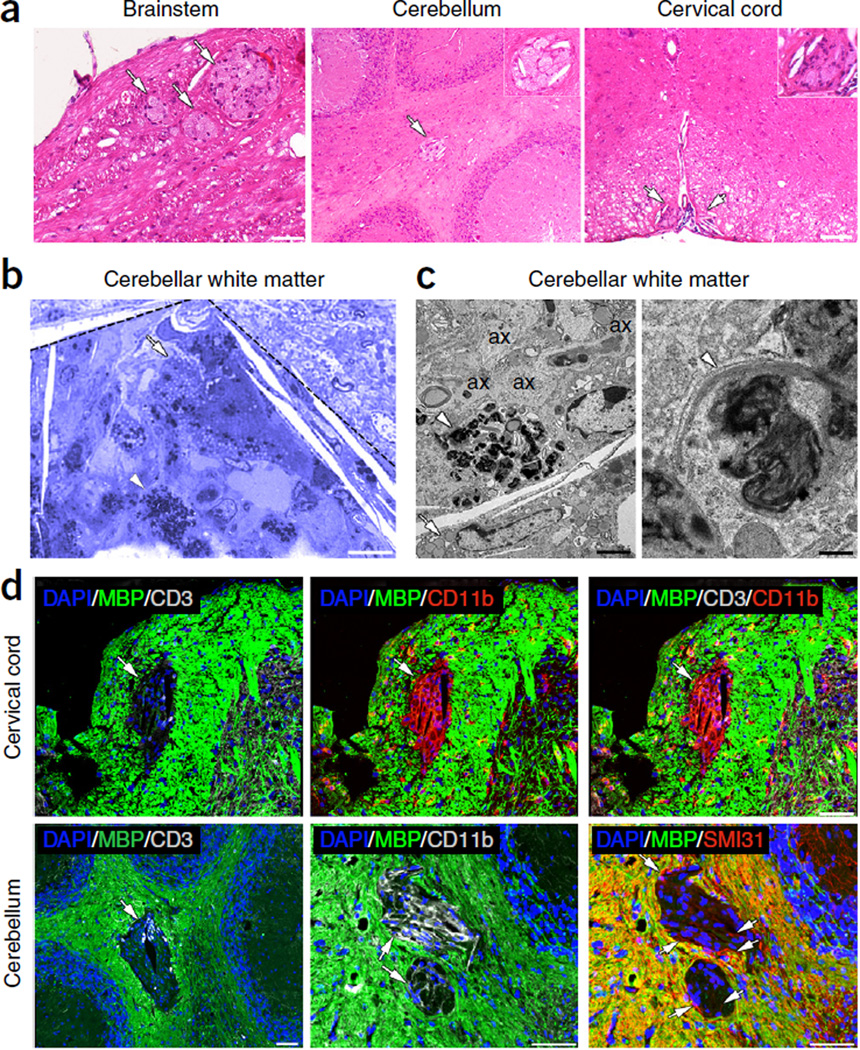
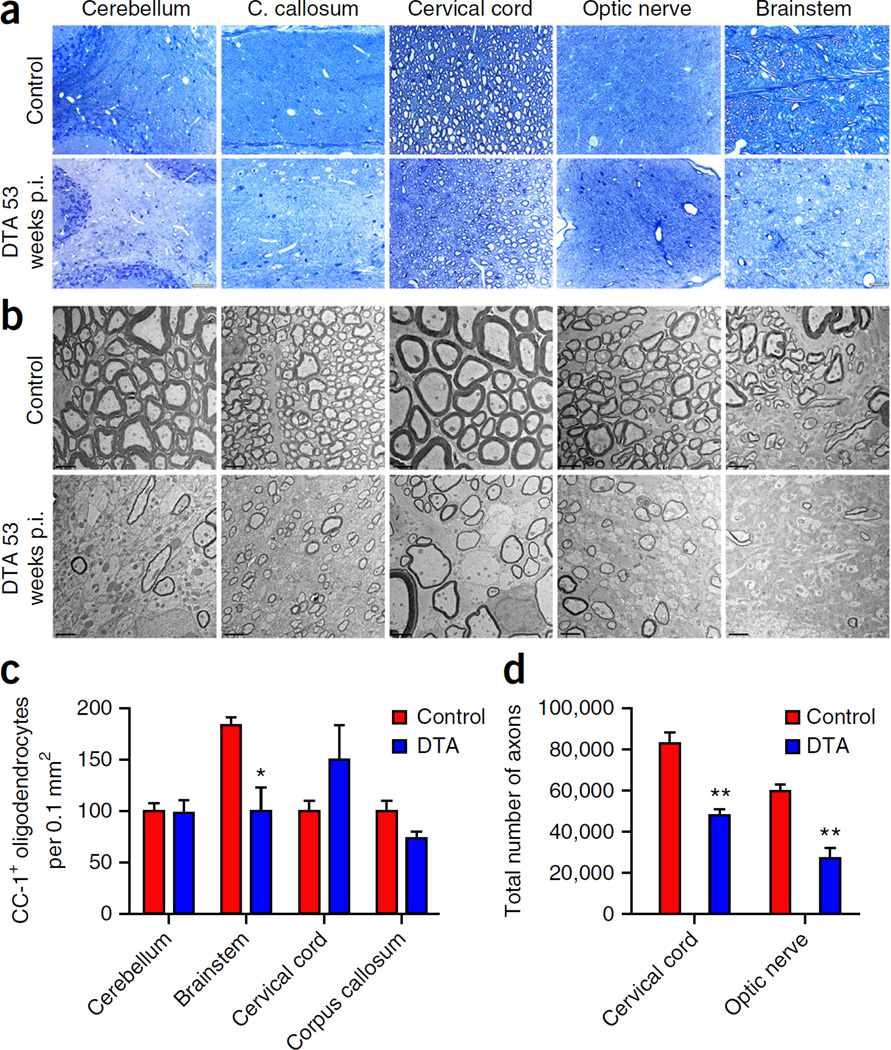
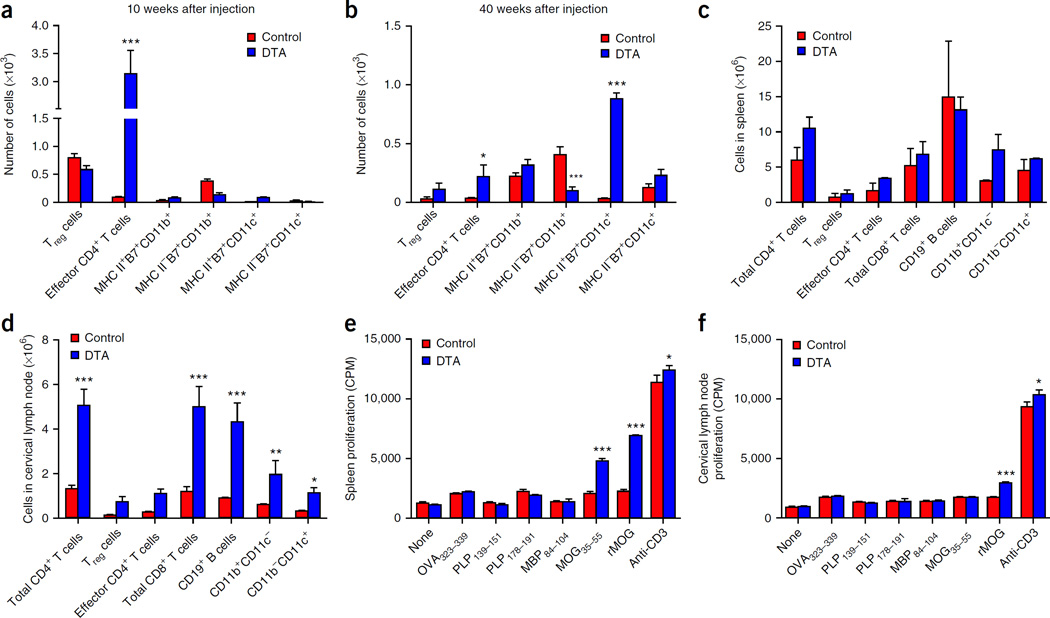
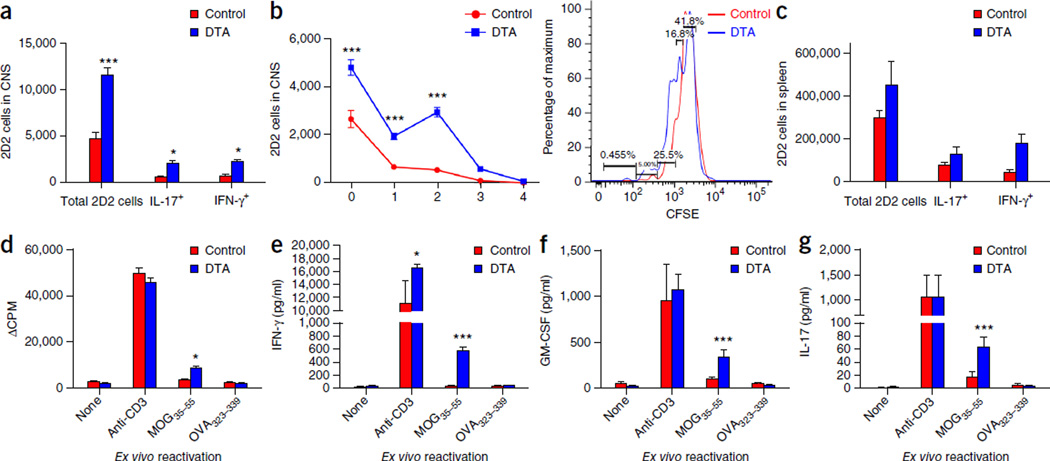
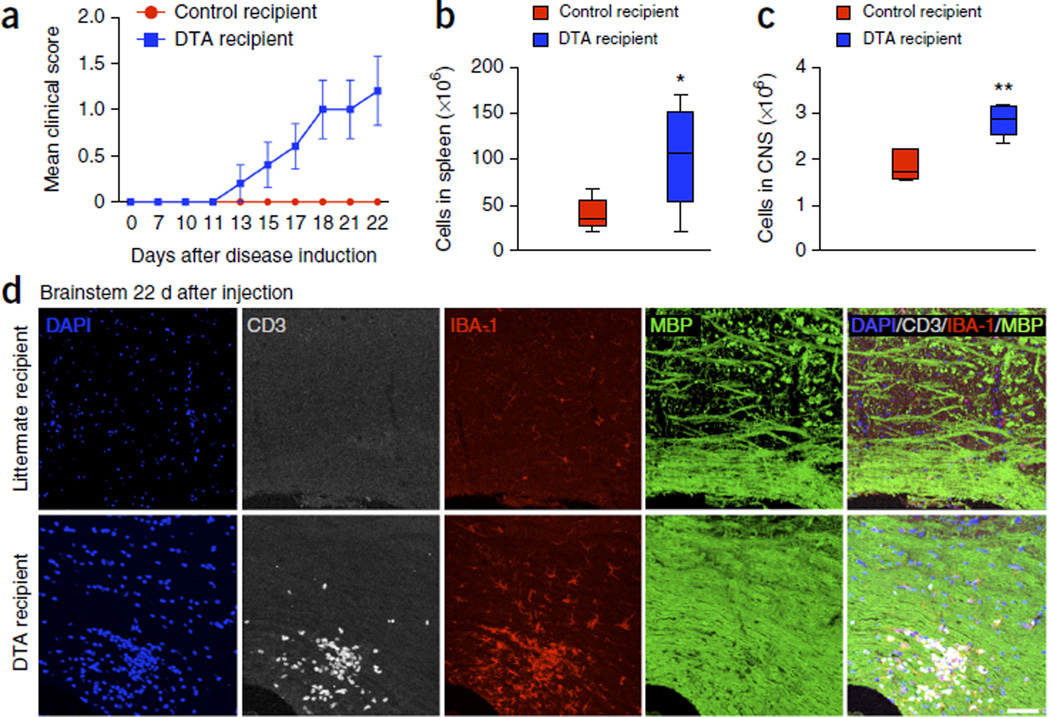
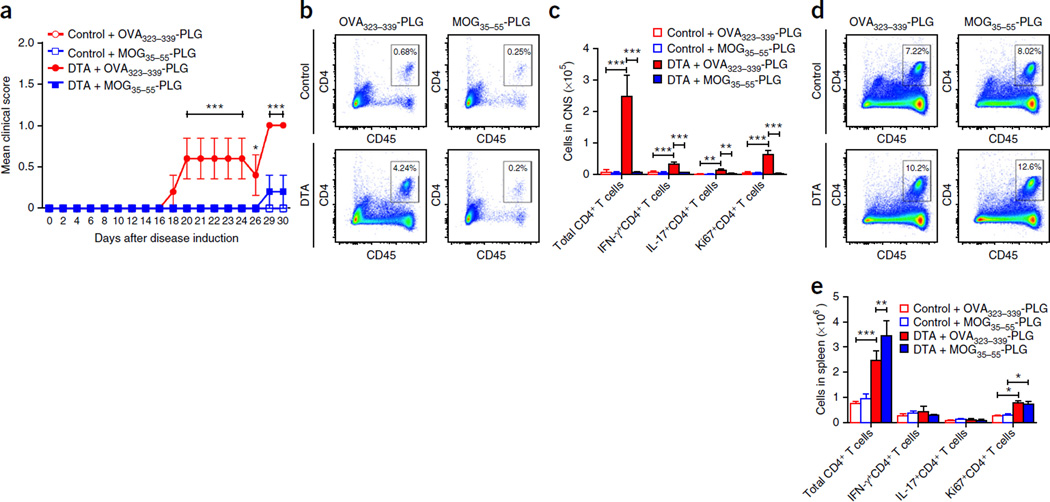
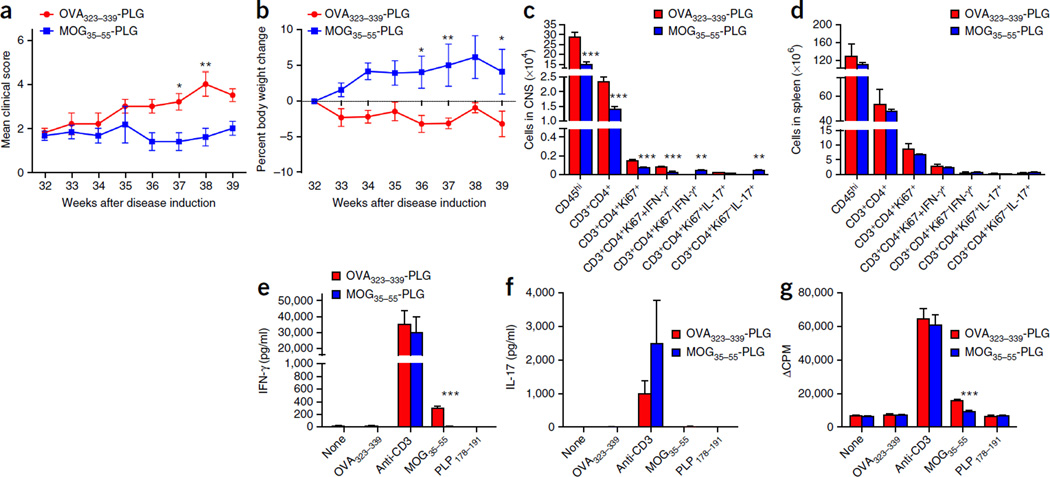
Although multiple sclerosis is a common neurological disorder, the origin of the autoimmune response against myelin, which is the characteristic feature of the disease, remains unclear. To investigate whether oligodendrocyte death could cause this autoimmune response, we examined the oligodendrocyte ablation Plp1-CreER(T);ROSA26-eGFP-DTA (DTA) mouse model. Approximately 30 weeks after recovering from oligodendrocyte loss and demyelination, DTA mice develop a fatal secondary disease characterized by extensive myelin and axonal loss. Strikingly, late-onset disease was associated with increased numbers of T lymphocytes in the CNS and myelin oligodendrocyte glycoprotein (MOG)-specific T cells in lymphoid organs. Transfer of T cells derived from DTA mice to naive recipients resulted in neurological defects that correlated with CNS white matter inflammation. Furthermore, immune tolerization against MOG ameliorated symptoms. Overall, these data indicate that oligodendrocyte death is sufficient to trigger an adaptive autoimmune response against myelin, suggesting that a similar process can occur in the pathogenesis of multiple sclerosis.


Figures

Figure 1
Figure 1
DTA mice develop a severe late-onset clinical phenotype. (a) Tamoxifen-treated Plp1-CreERT;ROSA26-eGFP-DTA mice displayed significantly reduced latency on the rotarod starting around 38 weeks after injection as compared to the control littermate (ROSA26-eGFP-DTA) mice. Control mice: 19–32 weeks, n = 5; 33 and 46–51 weeks, n = 9; 34, 35 and 43–45 weeks, n = 11; 36, 41 and 42 weeks, n = 14; 37–40 weeks, n = 15; 52 weeks, n = 7. DTA mice: 19–32 weeks, n = 4; 33 and 42 weeks, n = 10; 34 weeks, n = 12; 35 and 41 weeks, n = 11; 36–39 weeks, n = 15; 40 weeks, n = 14; 43 weeks, n = 9; 44 weeks, n = 7; 45–50 weeks, n = 5; 51–52 weeks, n = 3. Significance between control and DTA mice: 38 weeks, P = 0.0005; 39 weeks, P = 0.0094; 40 weeks, P = 0.0024; 41 weeks, P = 0.0002; 42 weeks, P = 0.0025; 43 weeks, P = 0.0207; 52 weeks, P = 0.0095. (b) Concurrently with the late-onset disease, the tamoxifen-treated DTA mice showed significant weight loss as compared to control littermate mice. Control mice: 32 weeks, n = 5; 33 weeks, n = 10; 34–35 and 43–45 weeks, n = 11; 36, 41 and 42 weeks, n = 14; 37–40 weeks, n = 15; 46–51 weeks, n = 9; 52 weeks, n = 7. DTA mice: 32 weeks, n = 4; 33–34 weeks, n = 10; 35 and 41 weeks, n = 12; 36–39 weeks, n = 16; 40 weeks, n = 15; 42 weeks, n = 11; 43 weeks, n = 9; 44 weeks, n = 8; 45–49 weeks, n = 6; 50–52 weeks, n = 5. Significance between control and DTA mice: 37 weeks, P = 0.021; 50 weeks, P = 0.0063; 51 weeks, P = 0.0063; 52 weeks, P = 0.0188. Data in a and b are presented as the mean ± s.e.m. *P < 0.05, **P < 0.01 and ***P < 0.001; two-way ANOVA with Bonferroni post hoc analysis.
Figure 2
Figure 2
Focal white matter lesions at early disease stages. (a) Focal white matter lesions (arrows) were detected in different CNS areas of the tamoxifen-treated Plp1-CreERT;ROSA26-eGFP-DTA mice ~40 weeks after injection, such as the brainstem white matter, the cerebellar white matter and the cervical spinal cord white matter. They appear as lighter areas on sections stained with hematoxylin and eosin. Insets show higher magnifications of lesions. Scale bars: 50 µm (brainstem) and 100 µm (cervical cord, cerebellum). (b,c) A focal lesion is outlined in the cerebellar white matter (dashed lines) on a toluidine blue–stained section (b). The lesion contains a high density of macrophages with lipids from degrading myelin (arrow) and myelin debris (arrowhead) in their cytoplasm, which are also shown at higher resolution by EM (c, left). A higher magnification EM image of the myelin debris is shown in c, right. EM analysis also demonstrates the presence of unmyelinated axons (ax) in the focal lesions (c, left panel). Scale bars: 10 µm (b), 2 µm (c, left) and 200 nm (c, right). (d) Focal lesions showed loss of MBP staining in the cerebellar white matter and the cervical spinal cord white matter (green, arrows), and they frequently contained T cells stained for CD3 (gray). These sites also showed increased staining for the microglia and macrophage marker CD11b (red in cervical cord, gray in cerebellum). A few unmyelinated axons were also detected in the white matter lesions by SMI31 staining (red in cerebellum, arrows). Immunofluorescence images are representative of three mice per genotype. Scale bars, 50 µm.
Figure 3
Figure 3
Extensive myelin and axonal loss at late disease stages. (a,b) Toluidine blue staining (a) and EM analysis (b) showed substantial myelin loss in different CNS white-matter-rich areas of the tamoxifen-treated DTA mice at later disease stages, 53 weeks post-injection (p.i.). Corresponding CNS areas from the control littermate (ROSA26-eGFP-DTA) mice are shown in the upper panel. Scale bars: 100 µm (a, cerebellum), 20 µm (a, corpus (C.) callosum, cervical cord, optic nerve, brainstem) and 2 µm (b). Images in a and b are representative of three mice per genotype. (c) Counts of the CC-1-positive cell numbers indicated significant oligodendrocyte loss in the brainstem of tamoxifen-treated DTA mice at 53 weeks p.i., but not in the cerebellum, cervical cord or corpus callosum, compared with control mice. N = 3 mice per genotype (brainstem, cervical cord and corpus callosum), n = 4 control mice and n = 3 DTA mice (cerebellum). P = 0.0262 between control and DTA mice in brainstem. No significance between control and DTA mice: cerebellum, P = 0.8691; cervical cord, P = 0.2245; corpus callosum, P = 0.1061. (d) Counts of the total axonal numbers showed significantly fewer axons in the cervical spinal cord ventrolateral white matter and the optic nerve areas of the tamoxifen-treated DTA mice 53 weeks p.i. as compared to control littermate mice. N = 3 mice per genotype. Between control and DTA mice: cervical cord, P = 0.0034; optic nerve, P = 0.0024. Data in c and d are presented as the mean + s.e.m. **P < 0.01, *P < 0.05 with two-tailed unpaired Student’s t test.
Figure 4
Figure 4
CNS inflammation and peripheral MOG-specific CD4+ T-cell responses during late-onset demyelination in tamoxifen-treated DTA mice. (a) Flow cytometry revealed increased numbers of effector CD4+ T cells (CD3+CD4+CD44hi) (P < 0.0001) in the CNS of the tamoxifen-treated Plp1-CreERT;ROSA26-eGFP-DTA (DTA) mice 10 weeks after injection as compared to the age-matched control ROSA26-eGFP-DTA (control) mice (n = 3). (b) Increased numbers of effector CD4+ T cells (P = 0.0336) persisted into late-onset disease at 40 weeks after injection, when the numbers of dendritic cells (CD3CD11bCD11c+) (P < 0.0001) were also increased and MHCIIB7+ monocytes decreased (P = 0.0005). (c,d) The numbers of total CD4+ T cells (CD3+CD4+CD8) (in cervical lymph nodes, P = 0.0001), regulatory T (Treg) cells (CD3+CD4+CD25+FoxP3+), effector CD4+ T cells (CD3+CD4+CD44hiFoxP3), total CD8+ T cells (total CD3+CD4CD8+) (in cervical lymph nodes, P = 0.0001), B cells (CD3CD19+) (in cervical lymph nodes, P = 0.0004), monocytes (CD3CD11b+CD11c) (in cervical lymph nodes P = 0.0100) and dendritic cells (CD3CD11bCD11c+) (in cervical lymph nodes P = 0.0267) were determined by flow cytometry in the spleens (c) and cervical lymph nodes (d) of tamoxifen-treated DTA mice 40 weeks after injection and control mice. Additionally, splenocytes (e) and cervical lymph node cells (f) (1 × 10⁶ per well) were activated in culture for 72 h in the presence of medium alone or with anti-CD3 (1 µg/ml) (spleen, P = 0.0118; cervical lymph node, P = 0.012), OVA323–339, PLP139–151, PLP178–191, MBP84–104 or MOG35–55 (spleen, P < 0.0001) or whole recombinant rat MOG (rMOG) protein (10 µg/ml) (spleen, P < 0.0001; cervical lymph node, P = 0.0005), with pulsed tritiated thymidine (1 µCi) added at 24 h. The levels of cellular proliferation were then determined. One representative experiment of three is presented. Three mice from each group were assessed per experiment. The data are presented as the mean + s.e.m. Counts per minute (CPM) of triplicate cultures. *P < 0.05, **P < 0.01 and ***P < 0.001 for differences between control mice and tamoxifen-treated DTA mice; two-way ANOVA with Bonferroni post hoc analysis.
Figure 5
Figure 5
Activated MOG-specific T cells infiltrate the CNS of the tamoxifen-treated DTA mice during the early demyelinating disease. (a–g) CFSE-labeled 2D2 (MOG-specific) T cells were adoptively transferred into tamoxifen-treated PLP-CreERT;ROSA26-eGFP-DTA mice at 7 weeks after injection and into control littermate (ROSA26-eGFP-DTA) mice. Flow cytometry was performed 1 week later; it showed increased numbers of proliferating CFSE-labeled 2D2 (MOG-specific) T cells in the CNS (P < 0.0001; one representative flow cytometry histogram is presented) (a,b), as well as in the spleens of the tamoxifen-treated DTA mice compared to control mice (c). Increased numbers of 2D2 cells producing proinflammatory cytokines (IL-17 (P = 0.0395) and IFN-γ (P = 0.0415)) were also detected in both the CNS (a) and the spleens (c) of the tamoxifen-treated DTA mice as compared to littermate (control) mice. Furthermore, splenocytes isolated from DTA mice showed increased cellular proliferation (d) (MOG35–55 activation, P = 0.0347), as well as secretion of the proinflammatory cytokines IFN-γ (anti-CD3 activation, P = 0.0234; MOG35–55 activation, P < 0.0001) (e), GM-CSF (MOG35–55 activation, P < 0.0001) (f) and IL-17 (MOG35–55 activation, P = 0.0003) (g) when the cells were activated ex vivo in the presence of MOG35–55. One representative experiment of two is presented with n = 5 mice per group. The data are presented as the mean + s.e.m. *P < 0.05 and ***P < 0.001 for differences shown between mice in different groups (n = 5); two-way ANOVA with Bonferroni post hoc analysis.
Figure 6
Figure 6
Adoptive transfer of MOG-specific T cells derived from tamoxifen-treated DTA mice causes white matter inflammation in the CNS of naive Rag1−/− mice. One representative experiment of two is presented. Splenic cells from tamoxifen-treated Plp1-CreERT;ROSA26-eGFP-DTA mice 40–52 weeks after injection or age-matched control (ROSA26-eGFP-DTA) mice were cultured for 72 h at in the presence of MOG35–55 peptide (20 µg/ml) plus IL-12 (10 ng/ml) and IL-2 (100 U/ml). Cultured cells (107 blast cells) from tamoxifen-treated DTA mice were transferred into naive Rag1−/− recipient mice. (a) Mean (± s.e.m.) EAE scores indicated EAE-like neurological symptoms in Rag1−/− mice inoculated with cells from tamoxifen-treated DTA mice (DTA recipient) but not in Rag1−/− mice inoculated with cells from littermate mice (control recipient). (b,c) On day 22 after cell transfer, the number of total cells present in the spleen (b) and CNS (c) were enumerated. (d) Immunohistochemistry revealed the presence of focal inflammatory lesions with high levels of infiltrating T cells (CD3+ cells, gray) and microglia or macrophages (IBA-1+ cells, red), without apparent myelin loss (MBP signal, green) in the brainstem of the Rag1−/− mice inoculated with T cells from tamoxifen-treated DTA mice (bottom). No white matter lesions were detected in those mice inoculated with cells from control littermate (ROSA26-eGFP-DTA) mice (top). Images are representative of five mice per genotype. Scale bar, 60 µm. The data in a–c are presented as mean + s.e.m. One representative experiment of two is presented with n = 5 mice per group; *P < 0.05, **P < 0.01 for differences between control-derived and DTA-derived cell recipient mice shown in b (P = 0.0398) and c (P = 0.0016); one-tailed unpaired Student’s t test.
Figure 7
Figure 7
MOG35–55-specific tolerance inhibits CNS entry of DTA mouse-derived MOG35–55-specific T cells. As in Figure 6, MOG35–55-activated blast cells were generated from tamoxifen-treated Plp1-CreERT;ROSA26-eGFP-DTA and control (ROSA26-eGFP-DTA) mice. Recipient Rag1−/− mice received control-derived or DTA-derived blast cells plus either OVA323–339-PLG or MOG35–55-PLG nanoparticles via i.v. injection (n = 5). (a) The recipient mice were followed for disease (DTA + MOG35–55-PLG compared to DTA + OVA323–339-PLG: P < 0.0001, days 20–24 and days 29–30; P = 0.0331, day 26) and, on day 30 after cell transfer, spleen and CNS samples were assayed for the number and phenotype of the CD4+ T cells present. (b) Analysis of representative CNS samples gating on total singlet live CD45hiCD4+ cells. (c) This population of CD4+ T cells was further analyzed to determine the number of T cells that were CD4+ (control + OVA323–339-PLG compared to DTA + OVA323–339-PLG, P < 0.0001; DTA + OVA323–339-PLG compared to DTA + OVA323–339-PLG, P < 0.0001), IFN-γ+CD4+ (control + OVA323–339-PLG compared to DTA + OVA323–339-PLG, P < 0.0001; DTA + OVA323–339-PLG compared to DTA + OVA323–339-PLG, P < 0.0001), IL-17+CD4+ (control + OVA323–339-PLG compared to DTA + OVA323–339-PLG, P ≤ 0.0032; DTA + OVA323–339-PLG compared to DTA + OVA323–339-PLG, P = 0.0032), and Ki67+CD4+ (control + OVA323–339-PLG compared to DTA + OVA323–339-PLG, P < 0.0001; DTA + OVA323–339-PLG compared to DTA + OVA323–339-PLG, P < 0.0001). Representative flow plots are presented in Supplementary Figure 8a–c. (d) Analysis of representative spleen samples gating on total singlet live CD45hiCD4+ cells. (e) This population of CD4+ T cells was further analyzed to determine the number of T cells that were CD4+ (control + OVA323–339-PLG compared to DTA + OVA323–339-PLG, P < 0.0001; DTA + OVA323–339-PLG compared to DTA + OVA323–339-PLG, P = 0.0099), IFN-γ+CD4+, IL-17+CD4+, and Ki67+CD4+ (control + OVA323–339-PLG compared to DTA + OVA323–339-PLG, P = 0.02; DTA + OVA323–339-PLG compared to DTA + OVA323–339-PLG, P = 0.009). One representative experiment of two is presented with n = 5 mice per group. Representative flow plots are presented in Supplementary Figure 8d–f. The data are presented as mean + s.e.m. *P < 0.05, **P < 0.01 and ***P < 0.001 for differences shown between mice in different groups; two-way ANOVA with Bonferroni post hoc analysis.
Figure 8
Figure 8
Tolerance against MOG35–55 inhibits neurological disease induced by the DTA-derived MOG-specific T cells. Tamoxifen-treated Plp1-CreERT;ROSA26-eGFP-DTA mice at 32 weeks after injection were either tolerized against the MOG35–55 peptide by a single i.v. treatment with MOG35–55-PLG nanoparticles or injected with control OVA323–339-PLG nanoparticles. (a) Motor defects (DTA + OVA323–339-PLG compared to DTA + MOG35–55-PLG: week 37, P = 0.0393; week 38, P = 0.0019) and (b) weight loss were assessed weekly between weeks 32 and 39 (DTA + OVA323–339-PLG compared to DTA + MOG35–55-PLG: week 36, P = 0.0281; week 37, P = 0.009; week 39, P = 0.0434). (c,d) At week 39 after injection, FACS analysis of the CNS (c) (CD45hi, P < 0.0001; CD3+CD4+, P < 0.0001; CD3+CD4+Ki67+, P < 0.0001; CD3+CD4+Ki67+IFN-γ+, P < 0.0001; CD3+CD4+Ki67IFN-γ+, P = 0.009; CD3+CD4+Ki67IL-17+, P = 0.009) and spleens (d) was completed to determine the number and phenotype of the CD4+ T cells in these tissues. (e–g) CD4+ T cell responses to MOG35–55 were assessed by culturing 1 × 10⁶ total splenocytes for 3 d with medium alone, anti-CD3 (1 µg/ml), OVA323–339, MOG35–55 or PLP178–191 (10 µg/ml). The levels of secreted IFN-γ (e) (MOG35–55 activation P < 0.0001), IL-17 (f) and cellular proliferation (g) (MOG35–55 activation P < 0.0001) as determined by tritiated thymidine incorporation were assessed. One representative experiment of two is presented with n = 6 mice per group. The data are presented as the mean + s.e.m. *P < 0.05, **P < 0.01 and ***P < 0.001 for differences shown between the different groups. Two-way ANOVA with Bonferroni post hoc analysis.

Comment in

References

    1. Nylander A, Hafler DA. Multiple sclerosis. J. Clin. Invest. 2012;122:1180–1188. - PMC - PubMed
    1. Nakahara J, Aiso S, Suzuki N. Autoimmune versus oligodendrogliopathy: the pathogenesis of multiple sclerosis. Arch. Immunol. Ther. Exp. (Warsz.) 2010;58:325–333. - PubMed
    1. McFarland HF, Martin R. Multiple sclerosis: a complicated picture of autoimmunity. Nat. Immunol. 2007;8:913–919. - PubMed
    1. Stys PK, Zamponi GW, van Minnen J, Geurts JJ. Will the real multiple sclerosis please stand up? Nat. Rev. Neurosci. 2012;13:507–514. - PubMed
    1. Barnett MH, Prineas JW. Relapsing and remitting multiple sclerosis: pathology of the newly forming lesion. Ann. Neurol. 2004;55:458–468. - PubMed

Publication types

MeSH terms

Substances