. 2016 Feb;48(2):206-13.
doi: 10.1038/ng.3467. Epub 2015 Dec 14.

Fine-mapping cellular QTLs with RASQUAL and ATAC-seq

Affiliations

Fine-mapping cellular QTLs with RASQUAL and ATAC-seq

Natsuhiko Kumasaka et al. Nat Genet. 2016 Feb.

Erratum in

Abstract

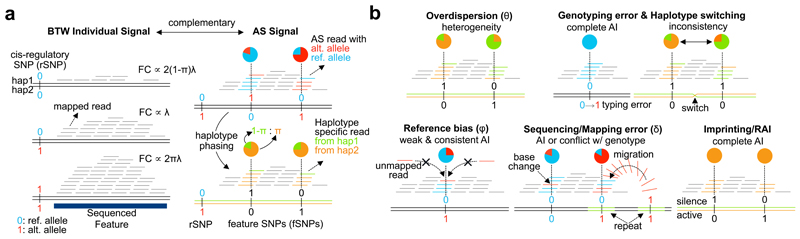
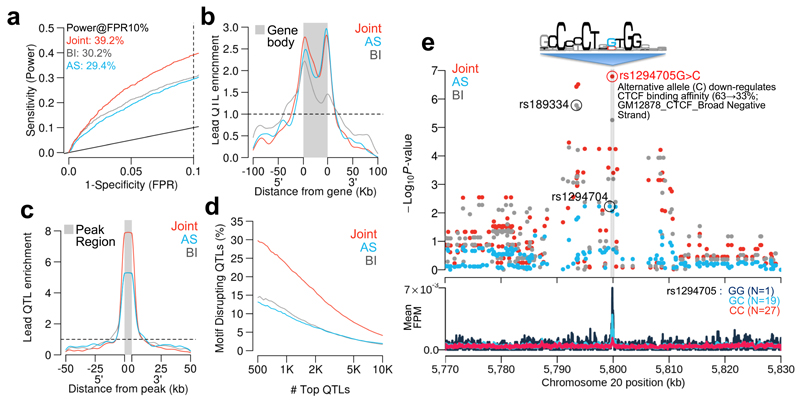
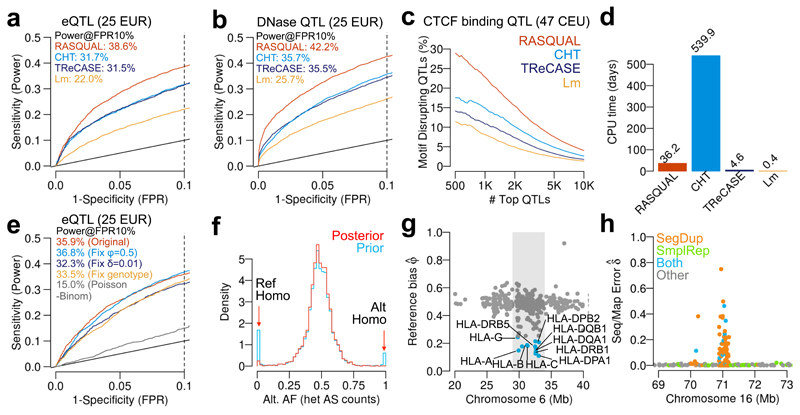
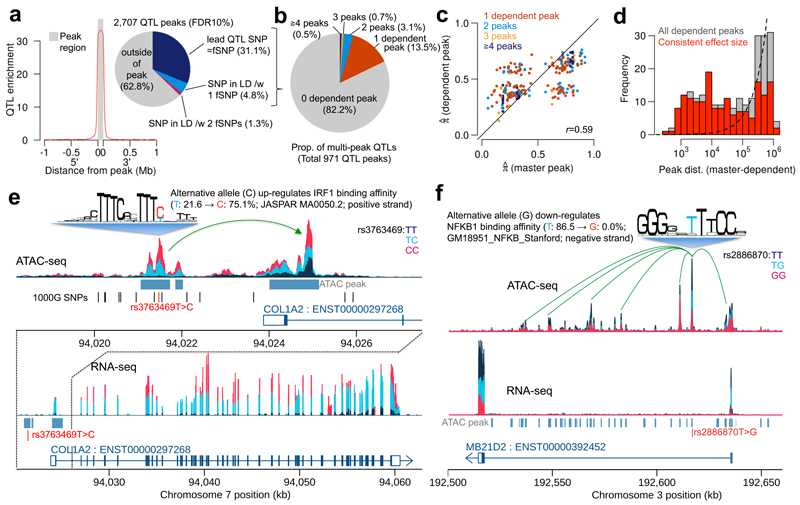
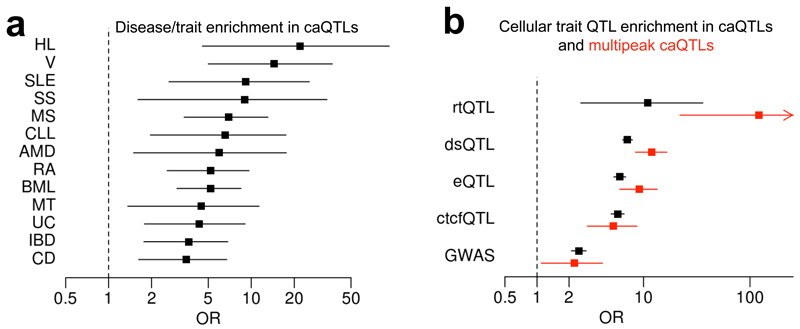
When cellular traits are measured using high-throughput DNA sequencing, quantitative trait loci (QTLs) manifest as fragment count differences between individuals and allelic differences within individuals. We present RASQUAL (Robust Allele-Specific Quantitation and Quality Control), a new statistical approach for association mapping that models genetic effects and accounts for biases in sequencing data using a single, probabilistic framework. RASQUAL substantially improves fine-mapping accuracy and sensitivity relative to existing methods in RNA-seq, DNase-seq and ChIP-seq data. We illustrate how RASQUAL can be used to maximize association detection by generating the first map of chromatin accessibility QTLs (caQTLs) in a European population using ATAC-seq. Despite a modest sample size, we identified 2,707 independent caQTLs (at a false discovery rate of 10%) and demonstrated how RASQUAL and ATAC-seq can provide powerful information for fine-mapping gene-regulatory variants and for linking distal regulatory elements with gene promoters. Our results highlight how combining between-individual and allele-specific genetic signals improves the functional interpretation of noncoding variation.


Conflict of interest statement

Conflicts of Interest: None declared

Figures

Figure 1
Figure 1
Schematic of RASQUAL approach. Throughout, reference and alternate alleles are coloured blue and red and coded 0 or 1, respectively, while alternative haplotype are coloured orange and green, respectively. (a) Plot illustrates the two sources of input data to RASQUAL: between-individual and AS signals, as observed from sequence data. Left panel shows the fragment count (FC) is proportional to rSNP genotype and right hand panel illustrates how those two signals are connected by the cis-regulatory effect π after conversion of AS counts into haplotype specific expression (see Main text for details). (b) Visual representation of the key RASQUAL features and parameters. Overdispersion introduces greater heterogeneity in the AS count than would be expected under binomial assumption. RASQUAL models the overdispersion in AS counts and total fragment counts with a single parameter θ. Genotyping error introduces complete allelic imbalance when homozygote is miscalled as heterozygote. Haplotype switching produces inconsistency of allelic imbalance among SNPs within an individual. Reference bias occurs when sequence reads containing the alternative allele(s) are unmappable to the correct location. RASQUAL employs a parameter φ that captures the excess of allelic imbalance beyond the genetic effect π. Sequencing/mapping error introduces additional allelic imbalance or genotype inconsistency. RASQUAL explicitly models the proportion of reads that are erroneously sequenced or mapped from incorrect genomic location by parameter δ to allow imperfect sequencing results. Imprinting introduces strong allelic imbalance that can confounds with genetic effects.
Figure 2
Figure 2
Comparing between-individual only (BI), allele-specific only (AS) and combined models. In panels a-d, red curves indicate the joint RASQUAL model, blue indicates the AS only signal and grey indicates the between-individual only signal. (a) ROC curves for detecting known eQTL genes (see Online Methods) for the three different models in a random subset of 24 individuals from gEUVADIS RNA-seq data. Dotted line indicates FPR=10%. (b) Density plot shows the enrichment of top 1,000 lead eQTLs relative to the gene body and 5’/3’ flanking regions. (c) Density plot showing positional enrichment of the lead CTCF QTL SNPs near the CTCF peak, relative to all SNPs, aggregated over the top 1,000 detected CTCF QTLs. (d) The percentage of motif-disrupting lead SNPs in top N CTCF binding QTLs. Motif-disrupting SNPs were defined as SNPs located within a CTCF peak and putative CTCF motif, whose predicted allelic effect on binding, computed using CisBP position weight matrices, corresponded to an observed change in CTCF ChIP-seq peak height in the expected direction (see Online Methods). Ordering of the top QTLs was based on their statistical significance independently measured by the three models. (e) Regional plot of P-values around an example CTCF binding QTL (top panel) and CTCF ChIP-seq coverage plot stratified by the lead SNP detected by the joint model (rs1294705) (bottom panel). The sequencing logo (Accession M4325) was derived by the CisBP database analysis of ENCODE CTCF ChIP-seq for GM12878 conducted by Broad Institute.
Figure 3
Figure 3
Comparison of RASQUAL with the combined haplotype test (CHT), TReCASE and simple linear regression of log-transformed, principal component-corrected FPKM values (Lm). Dotted line indicates FPR=10% throughout. (a) ROC curves for detecting known eQTL genes (see Online Methods) in a random subset of 25 individuals from gEUVADIS RNA-seq data. (b) ROC curves for detecting known DNaseI QTLs in a random subset of 25 individuals from DNaseI-seq data . (c) Percentage of motif-disrupting SNPs in top N lead CTCF-binding QTLs. Ordering of the top QTLs was based on their statistical significance independently measured by the four models. (d) CPU time in days required by each method to finish mapping CTCF QTLs genome-wide. (e) ROC curves for detecting known eQTL genes in a random subset of 25 individuals from gEUVADIS RNA-seq data. The original RASQUAL model (red) is compared to a model with fixed reference bias φ = 0.5 (light blue), fixed mapping/sequencing error δ = 0.01 (dark blue), fixed genotype likelihood (yellow) and no overdispersion θ (poisson-binomial model; grey). (f) Allelic imbalance at heterozygous fSNPs (coverage depth > 20). Heterozygous fSNPs are called as maximum “a priori” genotype (blue) and maximum “a posteriori” genotype (red) (g) The reference bias parameter φ̂ for RNA-seq data estimated by RASQUAL in the MHC region (chr6:28,477,797-33,448,354). Genes with φ̂ < 0.25 are coloured in blue. (h) Example of a genomic distribution of the sequencing/mapping error (δ̂) estimated by RASQUAL for the CTCF ChIP-seq data. Colours represent known segmental duplications (orange), simple repeats (green) or both (blue).
Figure 4
Figure 4
ATAC-QTL mapping with RASQUAL. (a) Positional enrichment of ATAC-QTL lead SNPs, relative to all SNPs, across all 2,707 FDR 10% significant associations detected; inset shows proportion of lead SNPs located inside, outside and in perfect LD (r2 > 0.99) with a SNP inside the ATAC peak. (b) Breakdown of multipeak caQTLs in terms of the number of dependent peaks. (c) Comparison of effect sizes (π̂) between master and dependent peaks. (d) Distribution of peak distance between master and dependent peaks. (e) Example of a multipeak ATAC-QTL (rs3763469) that perturbs a putative enhancer-promoter interaction in the COL1A2, also driving variation in gene expression (RASQUAL eQTL P = 3.4 × 10−42 on gEUVADIS 343 EUR samples). Sequence logo illustrates the IRF1 position weight matrix from JASPAR (f) Example of a multipeak QTL (rs2886870) disrupting the NFKB motif drives associations at 6 peaks in the intron and promoter of the MB21D2 gene. The SNP is also an eQTL of this gene (gEUVADIS project P = 5.2 × 10−54 on 373 EUR samples).
Figure 5
Figure 5
Enrichment of caQTLs and multipeak caQTLs for SNPs associated with other cellular and organismal traits from GWAS. (a) Disease/traits in GWAS catalogue that are enriched in caQTLs (Fisher exact P<0.01). The dot shows the odds ratio between each disease/trait and caQTL, and black line shows its 95% confidence interval. (b) Cellular trait QTL enrichment in caQTL (black) and multipeak caQTL (red). The dot shows the odds ratio between each disease/trait and caQTL, and the black line shows its 95% confidence interval. The red arrow shows the confidence interval continues toward 451. Hodgkin’s lymphoma (HL); Vitiligo (V); Systemic lupus erythematosus (SLE); Systemic sclerosis (SS); Multiple sclerosis (MS);Chronic lymphocytic leukemia (CLL); Age-related macular degeneration (AMD); Rheumatoid arthritis (RA); Blood metabolite levels (BML); Metabolic traits (MT); Ulcerative colitis (UC); Inflammatory bowel disease (IBD); Crohn’s disease (CD); DNA replication timing QTL (rtQTL); DNaseI hypersensitive QTL (dsQTL); CTCF binding QTL (ctcfQTL); expression QTL (eQTL).

References

    1. Pickrell JK, et al. Understanding mechanisms underlying human gene expression variation with RNA sequencing. Nature. 2010;464:768–72. - PMC - PubMed
    1. Montgomery SB, et al. Transcriptome genetics using second generation sequencing in a Caucasian population. Nature. 2010;464:773–7. - PMC - PubMed
    1. Lappalainen T, et al. Transcriptome and genome sequencing uncovers functional variation in humans. Nature. 2013;501:506–11. - PMC - PubMed
    1. Battle A, et al. Characterizing the genetic basis of transcriptome diversity through RNA-sequencing of 922 individuals. Genome Res. 2014;24:14–24. - PMC - PubMed
    1. Degner JF, et al. DNase I sensitivity QTLs are a major determinant of human expression variation. Nature. 2012;482:390–4. - PMC - PubMed

Publication types