. 2015 Dec 10:6:10090.
doi: 10.1038/ncomms10090.

A CDC42EP4/septin-based perisynaptic glial scaffold facilitates glutamate clearance

Affiliations

A CDC42EP4/septin-based perisynaptic glial scaffold facilitates glutamate clearance

Natsumi Ageta-Ishihara et al. Nat Commun. .

Abstract

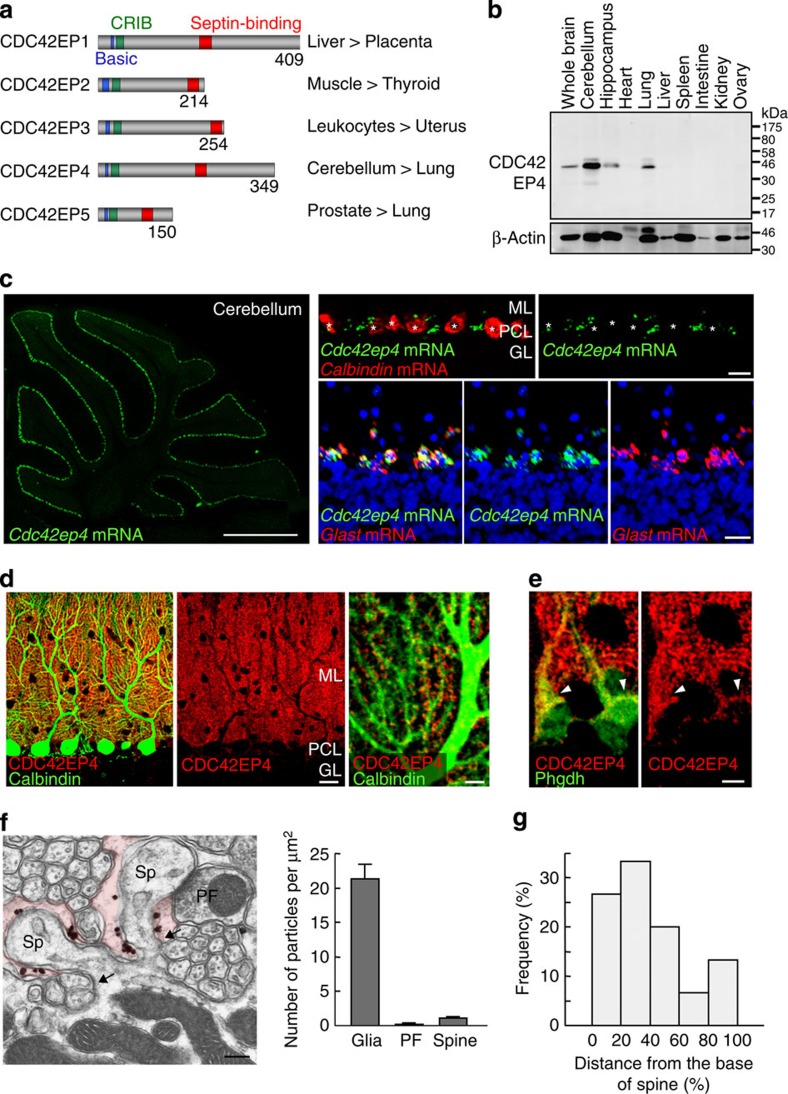
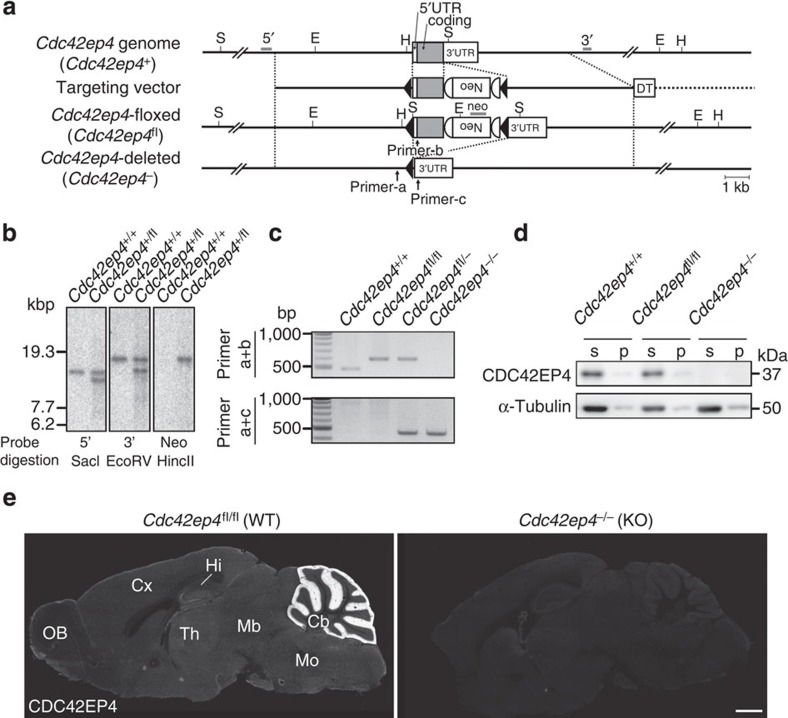
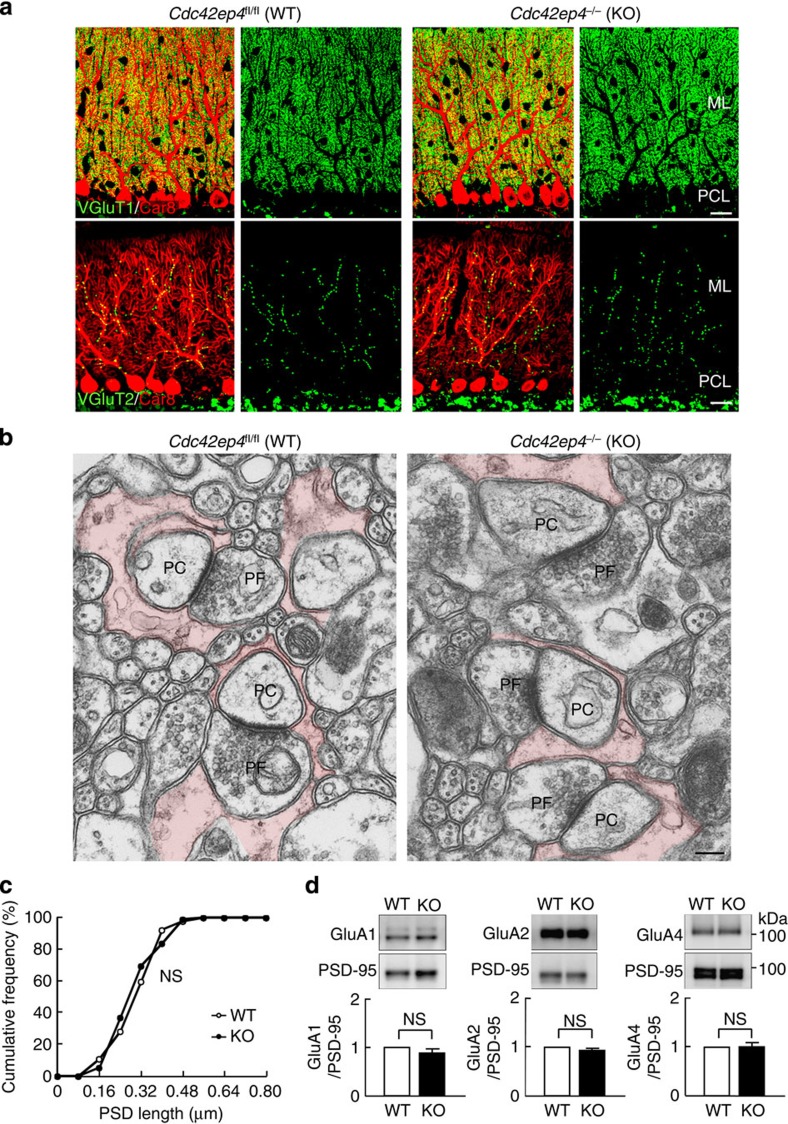
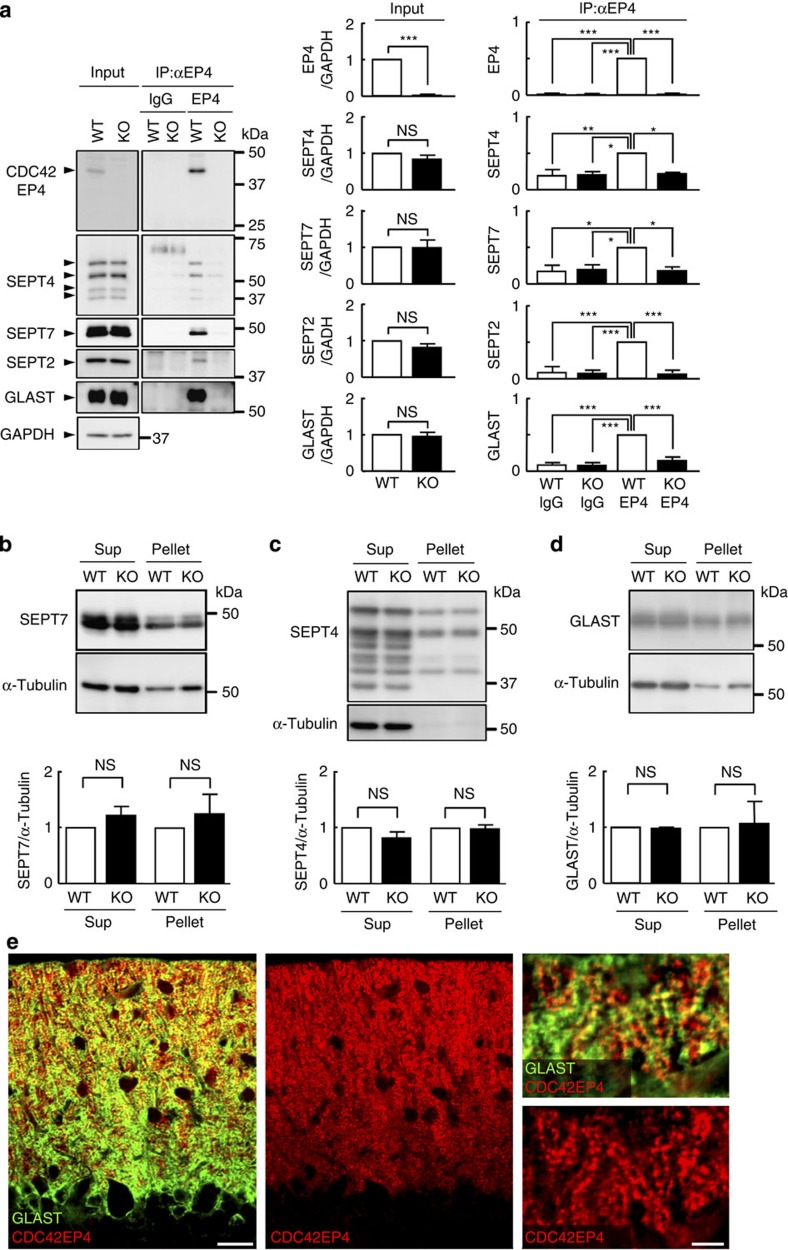
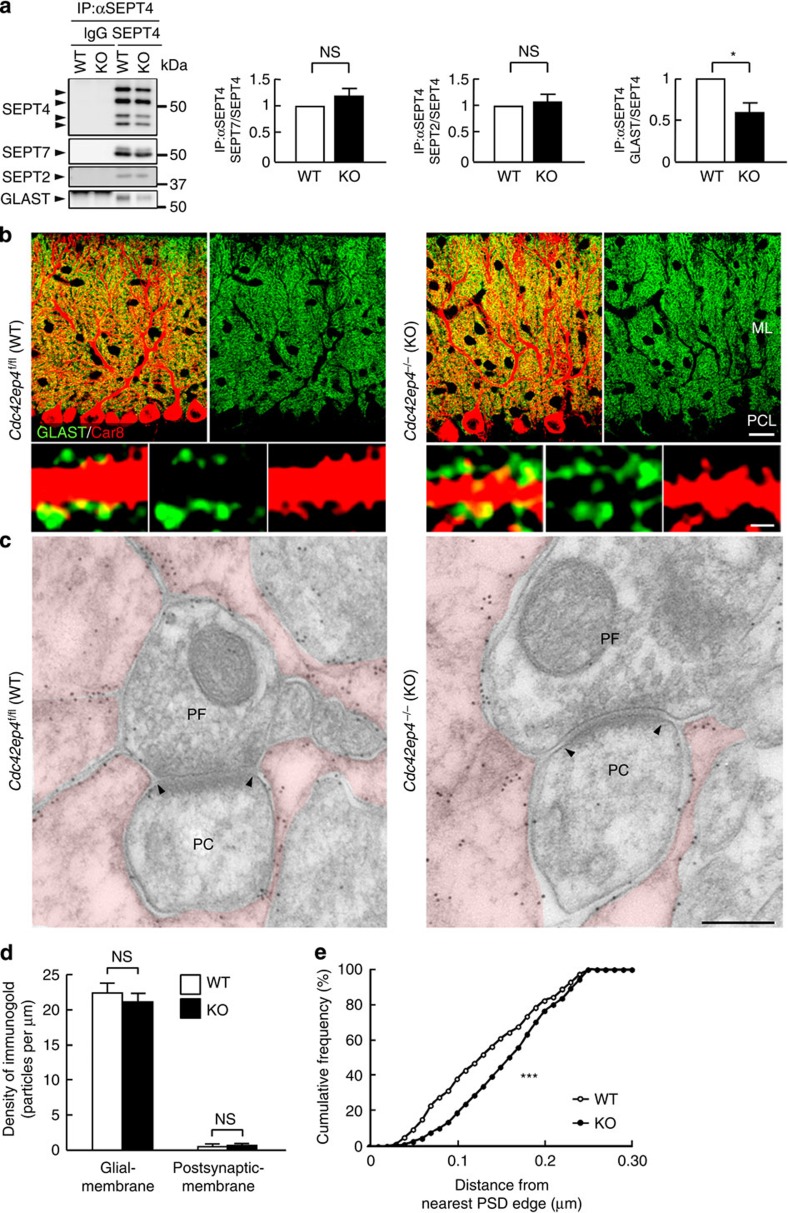
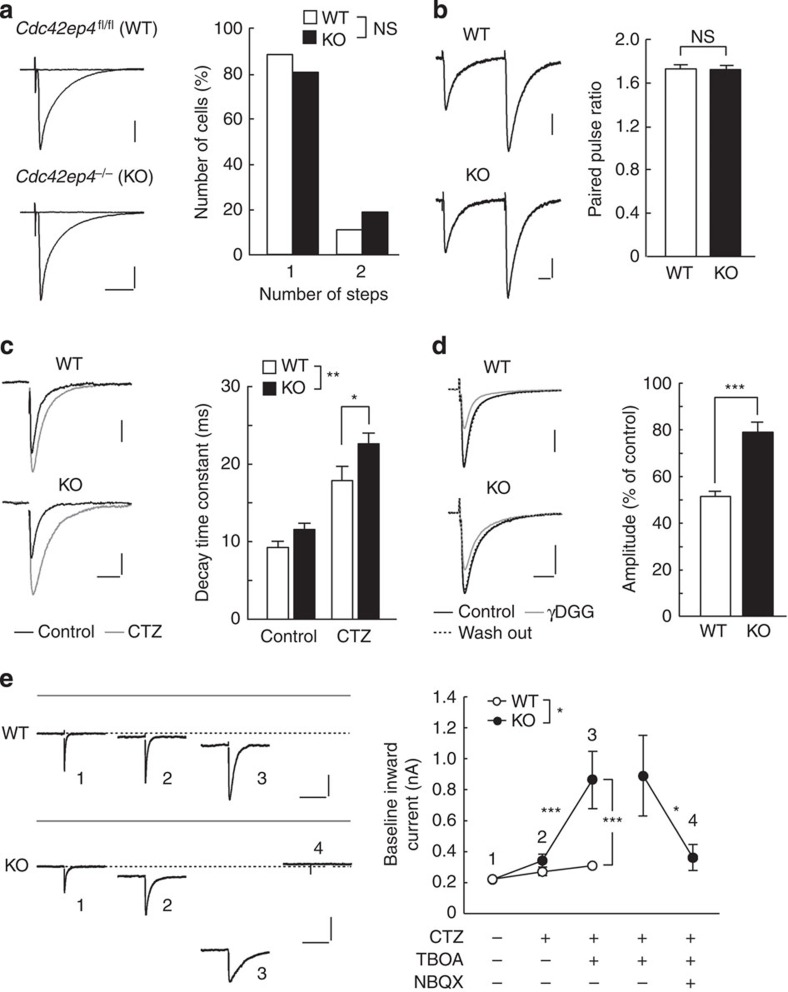
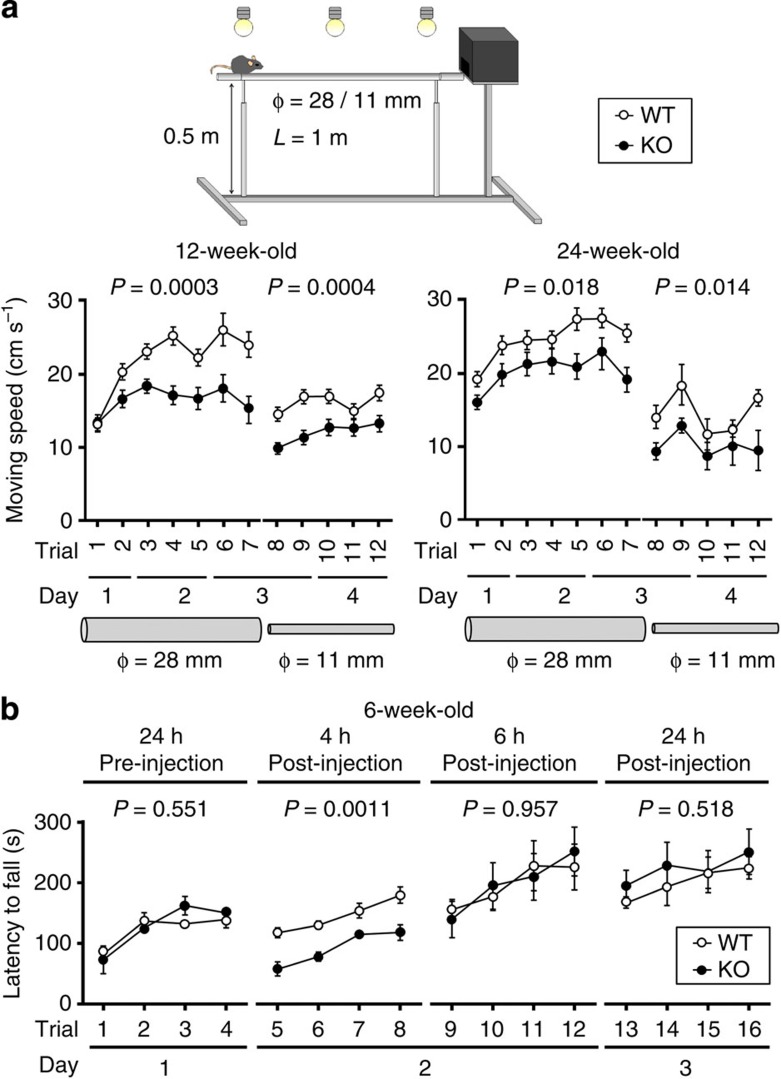
The small GTPase-effector proteins CDC42EP1-5/BORG1-5 interact reciprocally with CDC42 or the septin cytoskeleton. Here we show that, in the cerebellum, CDC42EP4 is exclusively expressed in Bergmann glia and localizes beneath specific membrane domains enwrapping dendritic spines of Purkinje cells. CDC42EP4 forms complexes with septin hetero-oligomers, which interact with a subset of glutamate transporter GLAST/EAAT1. In Cdc42ep4(-/-) mice, GLAST is dissociated from septins and is delocalized away from the parallel fibre-Purkinje cell synapses. The excitatory postsynaptic current exhibits a protracted decay time constant, reduced sensitivity to a competitive inhibitor of the AMPA-type glutamate receptors (γDGG) and excessive baseline inward current in response to a subthreshold dose of a nonselective inhibitor of the glutamate transporters/EAAT1-5 (DL-TBOA). Insufficient glutamate-buffering/clearance capacity in these mice manifests as motor coordination/learning defects, which are aggravated with subthreshold DL-TBOA. We propose that the CDC42EP4/septin-based glial scaffold facilitates perisynaptic localization of GLAST and optimizes the efficiency of glutamate-buffering and clearance.


Figures

Figure 1
Figure 1. Bergmann glia-selective expression and unique perisynaptic localization of CDC42EP4.
(a) The CDC42EP/BORG family and gene expression pattern in the mouse. Each CDC42EP contains a set of basic-CRIB-BD domains. Anti-CDC42EP4 antibody was raised against a region between the CRIB and BD3 (septin-binding) domains. The numbers denote amino-acid residues. CDC42EP1/2/3/4/5, respectively, corresponds to BORG5/1/2/4/3. (b) Lysates from adult mouse tissues (50 μg total protein per lane) were immunoblotted for CDC42EP4 and were reprobed for β-actin as a loading control. The major ∼39-kDa band was most abundant in the cerebellum. (c) FISH for Cdc42ep4 mRNA in the adult mouse cerebellum. (Left) Labels for Cdc42ep4 (green) highlighted the PC layer in a parasagittal section. (Top) Double-label FISH for mRNAs for Cdc42ep4 and a PC marker calbindin (red). Cdc42ep4 mRNA was excluded from PCs (*). (Bottom) Double-label FISH for Cdc42ep4 and Glast (red) mRNAs, and TOTO-3 stain for DNA (blue). The two mRNA signals overlapped in all (n=115) Bergmann glial cells identified in a representative section. Scale bars, 1mm and 20 μm. (d) (Left and centre) Double-label IF for CDC42EP4 (red) and calbindin (green) in the cerebellar cortex. The diffuse granular signals for CDC42EP4 distributed throughout the molecular layer and in the PC layer, which were excluded from PCs and the granule cell layer. (Right) At a higher magnification, CDC42EP4-positive puncta were interspersed and aligned along PC dendrites. Scale bars, 20 and 5 μm. (e) Double-label IF for CDC42EP4 (red) and a Bergmann glial marker Phgdh (green). The limited overlap in Bergmann glial cell bodies (arrowheads) indicated selective localization of CDC42EP4 in glial processes. Scale bar, 5 μm. (f) (Left) Immunoelectron microscopy image for CDC42EP4 in the molecular layer. Gold particles for CDC42EP4 were found as submembranous clusters in terminal processes of Bergmann glia (tinted), each surrounding a dendritic spine (Sp) of a PC. PF, parallel fibre terminal. Scale bar, 200 nm. (Right) Quantification of glia-selective localization of CDC42EP4. Data represented as mean±s.e.m. (g) Histogram showing a gradient of CDC42EP4 signals relative to the geometry of dendritic spines of PCs; higher in regions facing spine base (arrows in f) than in regions facing the spine head.
Figure 2
Figure 2. Generation of Cdc42ep4−/− mice and morphology of the major neuronal components.
(a) The KO strategy of the Cdc42ep4 gene. A schematic diagram showing the wild-type (Cdc42ep4+), floxed (Cdc42ep4fl) and null (Cdc42ep4) alleles, and the targeting vector. Note that Cre-mediated loxP recombination leaves no coding exon. The restriction sites for Sac I (S), EcoR V (E) and Hinc II (H), three probes (grey bars) used for Southern blot analysis and three PCR primer sites are indicated. Signs; coding region (grey box), untranslated region (open box), loxP (black triangle), frt (open half-circle), neomycin resistance cassette (Neo), diphtheria toxin A-chain cassette (DT). (b) Southern blot analysis. Genomic DNAs purified from WT and the chimera (Cdc42ep4+/+;Cdc42ep4fl/+) mice were digested with the restriction enzymes and hybridized with the probes as indicated. The band patterns, as seen in preceding Southern blot analysis of ES cell clones, reconfirmed successful homologous recombination of the clone. See Methods for details. (c) PCR genotyping. Two sets of primers discriminated genomic DNAs from Cdc42ep4+/+, Cdc42ep4fl/fl (WT), Cdc42ep4fl/− and Cdc42ep4−/− (KO) mice. (d) Expression and extractability of CDC42EP4 in the adult mouse cerebellum. The pellet/supernatant assay showed that CDC42EP4 is partitioned mostly to the detergent-extractable, supernatant (s) fraction but not to the inextractable, pellet (p) fraction. CDC42EP4 was absent from KO tissues. α-Tubulin was used as a loading control. (e) IF for CDC42EP4 on parasagittal brain sections of adult male littermate WT and KO mice. The molecular layer of the WT cerebellum (Cb) was intensely labelled for CDC42EP4, which was absent from the KO brain. The faint, diffuse labelling of the entire brain is attributed to astrocytes. These results are consistent with the immunoblot data (Figs 1b and 2d) and warrant the specificity (high signal-to-noise ratio) of the antibody. Scale bar, 1 mm. UTR, untranslated repeat.
Figure 3
Figure 3. Morphological analysis of the neuronal and glial components in Cdc42ep4fl/fl and Cdc42ep4−/− cerebellar cortices.
(a) Double-label IF of WT and KO cerebellar cortices for a Purkinje cell marker Car8 (red) and a parallel fibre (that is, granule cell) marker VGluT1 (top, green) or a climbing fibre marker VGluT2 (bottom, green). No obvious morphological anomaly, including aberrant CF–PC innervation, was found in the major neuronal components of KO-derived samples. Scale bar, 20 μm. (b) Transmission electron microscopy images of WT and KO molecular layers. No obvious ultrastructural difference was found between the genotypes. PF, parallel fibre terminal or bouton. PC, dendritic spine of Purkinje cell. Bergmann glial processes are tinted. Scale bar, 200 nm. (c) Cumulative histogram of PSD length of the PF–PC synapses, showing no significant difference between the genotypes (n=92 synapses from two littermates for each genotype, NS, P>0.05 by Kolmogorov–Smirnov test). (d) Quantitative immunoblot of WT and KO cerebellar PSD fractions for GluA1, GluA2 and GluA4 (the major subunits of the AMPARs), each normalized with PSD-95. There was no significant quantitative difference by genotype (n=3, NS, P>0.05 by t-test).
Figure 4
Figure 4. Biochemical analysis of binding partners of CDC42EP4 in Cdc42ep4fl/fl and Cdc42ep4−/− cerebella.
(a) Co-IP/IB assay of CDC42EP4 with representative septin subunits and GLAST from WT and KO cerebellar lysates. (Input) IB for SEPT4, SEPT7, SEPT2 and GLAST, respectively, detected a quadruplet of 54, 52, 48 and 44 kDa, a doublet of 51 and 48 kDa, a single 42 kDa band and a broad 55 kDa band in the cerebellar lysate. (IP) Anti-CDC42EP4 antibody pulled down SEPT4, SEPT7, SEPT2 and GLAST only from WT cerebellar lysate. The graphs show densitometric quantification of the yield (n=3, ***P<0.001, **P<0.01, *P<0.05, NS, P>0.05 by one-way ANOVA with post hoc Tukey test). (Note: the extraction condition including the lysis buffer composition was optimized to detect GLAST, which was distinct from the one used mainly for the proteomic analysis (Table 1). See Methods.) (bd) Pellet/supernatant assay results on the quantity and extractability of SEPT7, SEPT4 and GLAST in WT and KO cerebella. There was no significant difference in their amount and partitioning by genotype (n=3, NS, P>0.05 by t-test). The same membranes were reprobed for α-tubulin as a loading control, which was used for normalization. (e) Double-label IF for GLAST (green) and CDC42EP4 (red) in WT cerebellar cortex showing their partial co-localization in Bergmann glial processes. Scale bars, 20 and 5 μm.
Figure 5
Figure 5. Loss of CDC42EP4 dissociates the GLAST–septin interaction and delocalizes GLAST away from synapses.
(a) Quantitative co-IP/IB assay between SEPT4 and SEPT7, SEPT2 or GLAST in WT and KO cerebellar lysates. While the interaction among the septin subunits did not differ, the relative amount of GLAST pulled down with SEPT4 from KO lysate was significantly less than that from WT (n=3, *P<0.05, NS, P>0.05 by t-test), indicating that septin–GLAST interaction depends on CDC42EP4. See Fig. 4a–d for the comparable amount and solubility of these proteins in WT and KO cerebella. (b) Double-label IF for GLAST (green) and a Purkinje cell marker Car8 (red) in WT and KO cerebellar cortices. Genetic loss of CDC42EP4 caused no recognizable difference in the distribution of GLAST up to the resolution. Scale bars, 20 and 1 μm. (c) Immunoelectron microscopy images for GLAST in WT and KO molecular layers. PF, parallel fibre terminal or bouton. PC, dendritic spine of Purkinje cell. Bergmann glial processes are tinted. The pattern of GLAST distribution appears comparable to that of a previous study. Scale bar, 200 nm. (d) Quantitative analysis of immunoelectron microscopy data. Bergmann glia selectivity and labelling density of GLAST were comparable between WT and KO mice: Bergmann glia; 22.4±1.3/21.1±1.2 particles per μm (n=519/467 particles from two littermate pairs, NS, P>0.05 by Mann–Whitney U-test). Postsynaptic membrane; 0.50±0.21/0.68±0.24 particles per μm (n=5/8 particles, P=0.68 by Mann–Whitney U-test; cf. Figs 4d and 5a–c). (e) Cumulative histogram of the distance of GLAST measured from the nearest PSD edge (for example, arrowheads in c). A significant right shift of the curve for KO mice demonstrates delocalization of GLAST away from PSDs of PF–PC synapses (median, WT=0.27 μm, KO=0.31 μm from the nearest edge of PSD; n=22/19 synapses from two littermates for each genotype, ***P<0.001 by Kolmogorov–Smirnov test).
Figure 6
Figure 6. Cdc42ep4−/− mice exhibit insufficient glutamate-buffering/clearance capacity.
(a; Left) Sample traces of CF-EPSCs. Two to three traces were superimposed. Scale bars, 10 ms and 500 pA. (Right) Summary histogram showing the number of CF-EPSC steps (n=21/18, P=0.513 by Mann–Whitney U-test). Holding potential was −10 mV in a and −70 mV in be. (b; Left) PF-EPSCs in response to paired stimuli at 50 ms intervals. Scale bars, 10 ms and 100 pA. (Right) Summary graph of the paired-pulse ratio (n=22/19, P=0.824 by Mann–Whitney U-test). (c; Left) Sample traces of PF-EPSCs with (grey) or without (black) 100 μM CTZ in a WT and a KO mice. Scale bars, 25 ms and 50 pA. (Right) The decay time constant of PF-EPSCs. Although CTZ prolonged the decay time constant both in WT and KO (n=11/17, WT, from 9.3±0.8 to 17.9±1.8 ms, ***P<0.001; KO, from 11.6±0.8 to 22.6±1.3 ms; ***P<0.001), the effect was significantly larger in KO than in WT (**P=0.006 by two-way ANOVA with post hoc Tukey test), which resulted in more protracted postsynaptic response in KO PCs (*P=0.010). (d) (Left) PF-EPSCs before (black), in the presence of 1 mM γDGG (grey), and after washout (dashed). Scale bars, 10 ms and 200 pA. (Right) Summary histogram showing the effects of γDGG. KO PF-EPSCs were significantly more insensitive to γDGG than WT ones (n=7/7, ***P<0.001 by Mann–Whitney U-test). (e; Left) Sample traces of PF-EPSCs in a WT and a KO mice in control ACSF (1), in the presence of CTZ (2), CTZ plus 50 μM TBOA (3), CTZ, TBOA plus 10 μM NBQX (4). Grey and dashed lines, respectively, indicate the zero offset level and baseline holding current level in the control ACSF. Scale bars, 200 ms and 100 pA. (Right) The summary graph showing the holding current. The effects of CTZ plus TBOA was significantly larger on KO than on WT (n=11/12, ***P<0.001 by two-way repeated measures ANOVA with post hoc Tukey test). (Two right plots) Additional application of NBQX significantly diminished the inward current by TBOA (n=7, *P=0.016 by Wilcoxon signed-rank test).
Figure 7
Figure 7. Motor coordination and motor learning defects in Cdc42ep4−/− mice.
(a; Top) Set-up for the balance beam test. The height (0.5 m above the floor) and illumination (100 lux) motivate mice to escape by traversing along a horizontal rod (1 m × 28 or 11 mm) into a dark box. (Bottom) The learning curves of a cohort of WT and KO mice measured at 3 and 6 months of age. The moving speeds are plotted for seven trials with a 28-mm rod and subsequent five trials with an 11-mm rod over 4 days. The motor coordination defects in KO mice remained uncompensated up to 6 months of age (n=13/13 and 12/12, P=0.0003, 0.0004, 0.018, 0.014 by two-way repeated measures ANOVA). (b) The learning curves of 6-week-old WT and KO littermate mice assessed by the rota-rod test before and after direct cerebellar cortical injection of CTZ plus DL-TBOA (100 μM each per 10 μl). The local inhibition of EAATs with the subthreshold dose of DL-TBOA elicited a significant motor coordination defects transiently (around 4 h post-injection) and only in KO mice (n=5/4, P=0.551, 0.0011, 0.957, 0.518 by two-way repeated measures ANOVA). The aberrant hypersensitivity of KO mice indicates their glutamate clearance deficit that is adaptively compensated.

References

    1. Tzingounis A. V. & Wadiche J. I. Glutamate transporters: confining runaway excitation by shaping synaptic transmission. Nat. Rev. Neurosci. 8, 935–947 (2007) . - PubMed
    1. Bergles D. E., Dzubay J. A. & Jahr C. E. Glutamate transporter currents in bergmann glial cells follow the time course of extrasynaptic glutamate. Proc. Natl Acad. Sci. USA 94, 14821–14825 (1997) . - PMC - PubMed
    1. Dzubay J. A. & Jahr C. E. The concentration of synaptically released glutamate outside of the climbing fiber-Purkinje cell synaptic cleft. J. Neurosci. 19, 5265–5274 (1999) . - PMC - PubMed
    1. Chaudhry F. A. et al. Glutamate transporters in glial plasma membranes: highly differentiated localizations revealed by quantitative ultrastructural immunocytochemistry. Neuron 15, 711–720 (1995) . - PubMed
    1. Takayasu Y., Iino M., Takatsuru Y., Tanaka K. & Ozawa S. Functions of glutamate transporters in cerebellar Purkinje cell synapses. Acta Physiol. 197, 1–12 (2009) . - PubMed

Publication types

MeSH terms

LinkOut - more resources