. 2015 Dec 14:5:18034.
doi: 10.1038/srep18034.

Differential Plasmodium falciparum surface antigen expression among children with Malarial Retinopathy

Affiliations

Differential Plasmodium falciparum surface antigen expression among children with Malarial Retinopathy

Abdirahman I Abdi et al. Sci Rep. .

Abstract

Retinopathy provides a window into the underlying pathology of life-threatening malarial coma ("cerebral malaria"), allowing differentiation between 1) coma caused by sequestration of Plasmodium falciparum-infected erythrocytes in the brain and 2) coma with other underlying causes. Parasite sequestration in the brain is mediated by PfEMP1; a diverse parasite antigen that is inserted into the surface of infected erythrocytes and adheres to various host receptors. PfEMP1 sub-groups called "DC8" and "DC13" have been proposed to cause brain pathology through interactions with endothelial protein C receptor. To test this we profiled PfEMP1 gene expression in parasites from children with clinically defined cerebral malaria, who either had or did not have accompanying retinopathy. We found no evidence for an elevation of DC8 or DC13 PfEMP1 expression in children with retinopathy. However, the proportional expression of a broad subgroup of PfEMP1 called "group A" was elevated in retinopathy patients suggesting that these variants may play a role in the pathology of cerebral malaria. Interventions targeting group A PfEMP1 may be effective at reducing brain pathology.


Figures

Figure 1
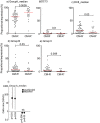
Figure 1. var transcript quantity and retinopathy.
Dot plots showing the transcript quantity of different var subsets and Pfsir2 in parasites from children with cerebral malaria either without or with retinopathy (CM-R and CM-R+). Each dot represents a single isolate. GroupA_median = is the median transcript quantity obtained with primers gpA1 and gpA2 (Table S1). DC8_median is the median transcript quantity obtained with the four-dc8 targeting primers. Group B and C represent the transcript quantity obtained with the primers b1 and c2 (Table S1). The red horizontal bar is the overall median. Significance of difference between CM-R and CM-R+ are indicated as p values calculated using the Mann-whitney U test.
Figure 2
Figure 2. var transcript proportional expression and retinopathy.
(ae) are dot plots showing the proportional expression of broad classes of var genes in relation to retinopathy status. Each dot represents a parasite isolate from a child. Group A and DC8 proportional expression represented the proportions of the total measured var transcript contributed by groupA_median and DC8_median. GroupA median and DC8_median are defined in Fig.1 above but calculated in this case as Tus = 2(5-∆ct). (f) Shows a plot of odds ratio and 95%CI of logistic regression models predicting retinopathy. Shown on the left is the association between Group A proportional expression and retinopathy with and without adjusting for admission hemoglobin level. Also shown (on the right) is the association between admission hemoglobin and retinopathy with and without adjusting for group A proportional expression.
Figure 3
Figure 3. Correlation matrix and Principal factor analysis.
(a) A correlation matrix: Shown are Spearman’s correlation coefficients of the associations between the variables (N = 62). The background shading is based on the p value of the associations. The darker the background colors the smaller the p value ; dark red = p < 0.0005, mid red = p < 0.005 - ≥ 0.0005, light red = p < 0.05 - ≥ 0.005. mid blue = p < 0.005 - ≥ 0.0005, light blue = p < 0.05 - ≥ 0.005. Red background indicates positive associations and blue background indicate negative associations. (b) The relationship between factor scores derived from principal factor analysis and retinopathy: A plot of odds ratio and 95% CI of three logistic regression models predicting retinopathy using either factor 1 factor 2 or factor 3 scores as sole explanatory variables. More details of these factors are shown in Table 2.

References

    1. Marsh K. et al. Indicators of life-threatening malaria in African children. N Engl J Med 332, 1399–1404 10.1056/NEJM199505253322102 (1995). - DOI - PubMed
    1. MacPherson G. G., Warrell M. J., White N. J., Looareesuwan S. & Warrell D. A. Human cerebral malaria. A quantitative ultrastructural analysis of parasitized erythrocyte sequestration. Am J Pathol 119, 385–401 (1985). - PMC - PubMed
    1. Silamut K. et al. A quantitative analysis of the microvascular sequestration of malaria parasites in the human brain. Am J Pathol 155, 395–410 10.1016/S0002-9440(10)65136-X (1999). - DOI - PMC - PubMed
    1. Taylor T. E. et al. Differentiating the pathologies of cerebral malaria by postmortem parasite counts. Nat Med 10, 143–145 10.1038/nm986(2004) . - DOI - PubMed
    1. Lewallen S. et al. Clinical-histopathological correlation of the abnormal retinal vessels in cerebral malaria. Arch Ophthalmol 118, 924–928 ecs90324 (2000). - PubMed

Publication types