. 2016 Jan;22(1):72-7.
doi: 10.1038/nm.4008. Epub 2015 Dec 14.

Early-life compartmentalization of human T cell differentiation and regulatory function in mucosal and lymphoid tissues

Affiliations

Early-life compartmentalization of human T cell differentiation and regulatory function in mucosal and lymphoid tissues

Joseph J C Thome et al. Nat Med. 2016 Jan.

Abstract

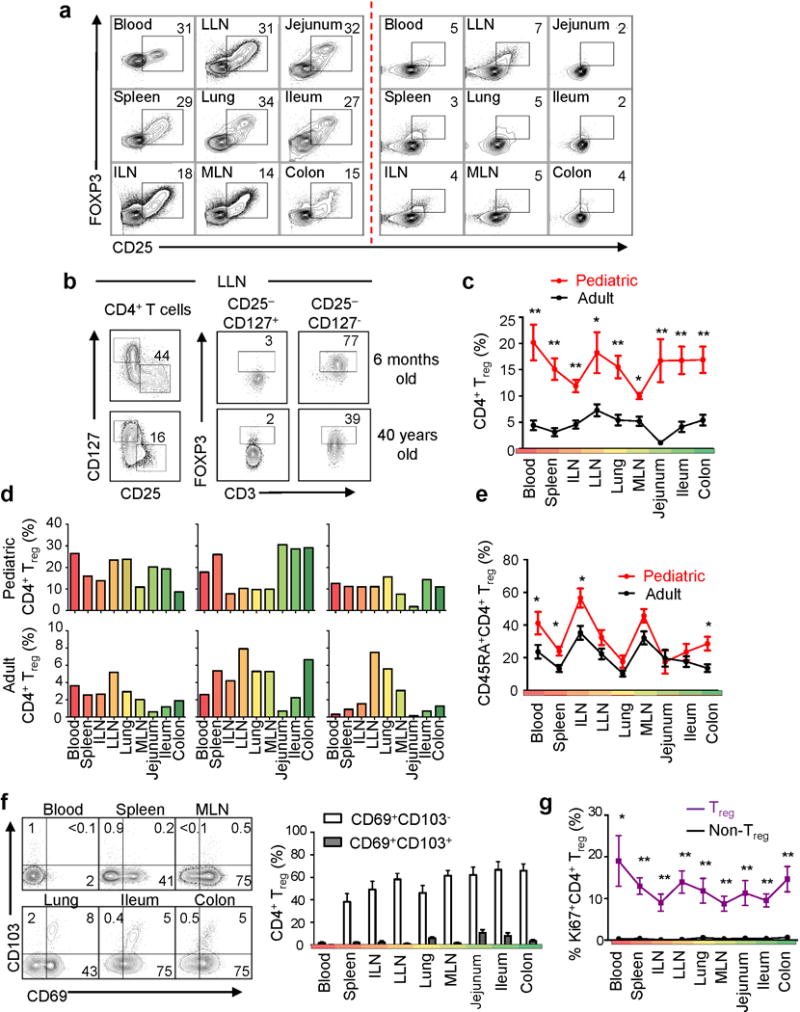
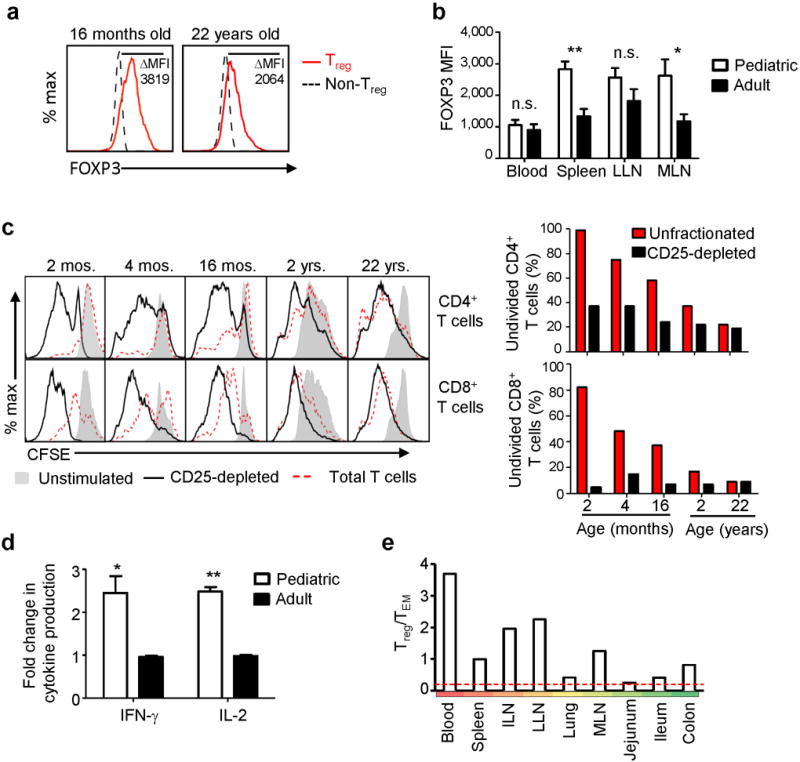
It is unclear how the immune response in early life becomes appropriately stimulated to provide protection while also avoiding excessive activation as a result of diverse new antigens. T cells are integral to adaptive immunity; mouse studies indicate that tissue localization of T cell subsets is important for both protective immunity and immunoregulation. In humans, however, the early development and function of T cells in tissues remain unexplored. We present here an analysis of lymphoid and mucosal tissue T cells derived from pediatric organ donors in the first two years of life, as compared to adult organ donors, revealing early compartmentalization of T cell differentiation and regulation. Whereas adult tissues contain a predominance of memory T cells, in pediatric blood and tissues the main subset consists of naive recent thymic emigrants, with effector memory T cells (T(EM)) found only in the lungs and small intestine. Additionally, regulatory T (T(reg)) cells comprise a high proportion (30-40%) of CD4(+) T cells in pediatric tissues but are present at much lower frequencies (1-10%) in adult tissues. Pediatric tissue T(reg) cells suppress endogenous T cell activation, and early T cell functionality is confined to the mucosal sites that have the lowest T(reg):T(EM) cell ratios, which suggests control in situ of immune responses in early life.


Conflict of interest statement

Disclosure:

The authors declare no competing financial interests with regard to this study.

Figures

Figure. 1
Figure. 1. Naïve T cells predominate in infant tissues with TEM cells confined to mucosal sites
(a) Flow cytometry plots of CD45RA/CCR7 expression by CD4+ and CD8+ T cells in pediatric blood and tissues from a representative infant (left, donor 118, 2 months) and older baby (right, donor 213, 2 yrs). (b) Mean frequency ± SEM of each T cell subset (naïve, TCM, TEM, TEMRA) expressed as a percent of CD4+ (top) or CD8+ (bottom) T cells in circulation, lymphoid, and mucosal tissue (ordered from circulation, red; to mucosal sites, green) separated by age group (pediatric (0–2 years) 15 donors, red; young adult (15–25 years), 9 donors, black). (c) Graph showing mean frequency ± SEM of CD31 expression by total CD4 T cells (top) and naive CD4+ T cells (bottom) from 8 pediatric and 9 young adult donors as in (b). (d) Representative staining of CD4+ and CD8+ T cell populations in thymic tissue of an infant (top, donor 107, 4 months) and young adult (bottom, donor 102, 22 yrs) and compiled frequencies of CD4+CD8+ (double positive, DP) cells in thymii of 6 pediatric and 5 young adult donors. Statistical significance represents comparisons between the indicated frequencies in pediatric and young adult donors in the same tissue sites measured by multiple t tests adjusted for multiple comparisons indicated as *P < 0.05; **P < 0.001. Individual donors used, descriptive statistics and individual p-values are shown in (Supplementary Tables 2, 3 and 4).
Figure. 2
Figure. 2. Distinct properties of early tissue memory T cells in lymphoid and mucosal sites
(a) Representative histograms of CD69 expression by naïve (red) and TEM (blue) CD4+ (top) and CD8+ (bottom) T cells from an infant donor (donor 127, 16 months). (b) Mean frequencies ± SEM of CD69 CD4+ (top) or CD8+ (bottom) TEM cells from 15 pediatric (0–2 years, red) or 9 young adults (15–25 years, black). (c) Representative flow cytometry plots of CD69 and CD103 expression on CD8+ TEM cells from a pediatric donor (top, donor 63, 26 months) and a young adult donor (bottom, donor 105, 20 years). (d) Mean frequencies ± SEM of CD69+CD103+ CD8+ (left) and CD69+CD103 (right) TEM in 9 pediatric (white) and 8 young adult (black) donors. Statistical significance for each site indicated as *P < 0.05; ** P < 0.001. (e) Cytokine content in culture supernatants (pg/ml, mean ±SEM) of infant (n=4, white) and adult (n=3, black) MLN T cells following stimulation with anti-CD2/CD3/CD28-coupled beads for four days. Unstimulated cells produced <1pg/ml cytokines (data not shown). Statistical significance indicated as *P < 0.05. (f) Average IFN-γ production from indicated tissues of 5 pediatric donors and 3 adult donors stimulated with PMA/ionomycin for 4 h. (g) IFN-γ production versus CD45RA expression from CD3+ T cells of donor 213 (2 years) stimulated with PMA/ionomycin for 4 hours. Individual donors used, descriptive statistics and individual P values are shown in (Supplementary Tables 2 and 3).
Figure. 3
Figure. 3. Elevated frequency and broad tissue distribution of Treg cells in pediatric as compared to adult tissues
(a) Frequency of CD25+FOXP3+CD4+ T cells in tissues from an infant (donor 118, 2 months) and adult (donor 105, 20 years). (b) Gating strategy for Treg cells from pediatric (top, donor 68, 6 months) and adult (bottom, donor 110, 40 yrs) LLN showing and initial CD25+CD127 gate (left) subsequently gated on FOXP3 expression, versus non-Treg (CD25CD127+) cells as a control. (c) Treg cell frequency (mean±SEM) in tissues from 13 pediatric (red) and 24 adult (black) donors expressed as percent CD25+CD127FOXP3+ cells from total CD4+ T cells (left). Statistical significance indicated as *P < 0.05; **P < 0.001. (d) Treg cell tissue distribution in pediatric and adult donors. Graphs show Treg cell frequency tissues from pediatric (top row, 2 months, 4 months, 1 year) and adult (lower, 20 years, 38 years, 51 years) donors. (e) CD45RA expression by Treg cells from 13 pediatric (red) and 24 adult (black) donors, with * P < 0.05. (f) CD69 and CD103 expression on Treg cells shown as representative flow cytometry plots(left) and compiled percentages (mean±SEM) of CD69+CD103 (white) and CD69+CD103+ (grey) populations from 16 donors (right). (g) Percent Ki67 expression (mean±SEM) by Treg (purple) and non-Treg (CD4+CD25CD127+) cells (black) in blood and tissues from 12 donors. Statistical significance indicated as *P < 0.05; **P < 0.001. Individual donors used, descriptive statistics and P values are shown in (Supplementary Tables 2, 4 and 5).
Figure. 4
Figure. 4. Pediatric tissue Treg cells suppress endogenous T cell proliferation and function
(a) FOXP3 expression by pediatric and adult Treg cells. Representative FOXP3 expression by MLN CD4+CD25+CD127 cells (red) compared to CD25CD127+FOXP3 cells (black dashed) from a pediatric (16 months, left) and adult (22 yrs, right) donor. ΔMFI = MFI(Treg cells)–MFI(control non-Treg cells). (b) Normalized FOXP3 MFI as in (a) of Treg cells from blood and lymphoid tissues of 10 pediatric (white) and 17 adult (black) donors. *P < 0.05; **P < 0.001; n.s.: not significant. (c) Proliferation of unfractionated T cells (red dotted) or CD25-depleted T cells (black), isolated from pediatric and adult MLN of indicated ages following anti-CD3/CD28 stimulation. Left: CFSE dilution of activated compared to unstimulated (grey shaded) CD4+ (top) and CD8+ (bottom) T cells. Right: Percent of CFSE+ (undivided) CD4+ (top) or CD8+ (bottom) T cells stimulated with or without CD25-depletion for each individual infant and adult donor. (d) Cytokine production in the presence or absence of Treg cells. Spleen and MLN T cells from pediatric and adult tissues were activated as in (c) with or without CD25 depletion and IFN-γ and IL-2 in supernatants was measured after 48 hours Graph shows fold change of cytokine production by the CD25-depleted versus unfractionated pediatric (white, n=4) and adult (black, n=4) T cells, with *P < 0.05; **P < 0.001. (e) Average Treg:TEM cell ratios in tissues from pediatric donors (0–2 yrs, n=17). Red dashed line indicates the maximum Treg:TEM cell ratio in adult tissues.

References

    1. Mueller SN, Gebhardt T, Carbone FR, Heath WR. Memory T cell subsets, migration patterns, and tissue residence. Annu Rev Immunol. 2013;31:137–161. - PubMed
    1. Schenkel JM, et al. T cell memory. Resident memory CD8 T cells trigger protective innate and adaptive immune responses. Science. 2014;346:98–101. - PMC - PubMed
    1. Teijaro JR, et al. Cutting edge: tissue-retentive lung memory CD4 T cells mediate optimal protection to respiratory virus infection. J Immunol. 2011;187:5510–5514. - PMC - PubMed
    1. Gebhardt T, et al. Memory T cells in nonlymphoid tissue that provide enhanced local immunity during infection with herpes simplex virus. Nat Immunol. 2009;10:524–530. - PubMed
    1. Burzyn D, Benoist C, Mathis D. Regulatory T cells in nonlymphoid tissues. Nat Immunol. 2013;14:1007–1013. - PMC - PubMed

Publication types

MeSH terms