. 2015 Dec 11;11(12):e1004634.
doi: 10.1371/journal.pcbi.1004634. eCollection 2015 Dec.

MIiSR: Molecular Interactions in Super-Resolution Imaging Enables the Analysis of Protein Interactions, Dynamics and Formation of Multi-protein Structures

Affiliations

MIiSR: Molecular Interactions in Super-Resolution Imaging Enables the Analysis of Protein Interactions, Dynamics and Formation of Multi-protein Structures

Fabiana A Caetano et al. PLoS Comput Biol. .

Abstract

Our current understanding of the molecular mechanisms which regulate cellular processes such as vesicular trafficking has been enabled by conventional biochemical and microscopy techniques. However, these methods often obscure the heterogeneity of the cellular environment, thus precluding a quantitative assessment of the molecular interactions regulating these processes. Herein, we present Molecular Interactions in Super Resolution (MIiSR) software which provides quantitative analysis tools for use with super-resolution images. MIiSR combines multiple tools for analyzing intermolecular interactions, molecular clustering and image segmentation. These tools enable quantification, in the native environment of the cell, of molecular interactions and the formation of higher-order molecular complexes. The capabilities and limitations of these analytical tools are demonstrated using both modeled data and examples derived from the vesicular trafficking system, thereby providing an established and validated experimental workflow capable of quantitatively assessing molecular interactions and molecular complex formation within the heterogeneous environment of the cell.


Conflict of interest statement

The authors have declared that no competing interests exist.

Figures

Fig 1
Fig 1. MIiSR graphical user interfaces and work flow.
(A) Image of the MIiSRconvert GUI, which is used to convert microscope position files from a manufacturer’s format into a MIiSR-compatible format. A complete description of use of the GUI can be found in its help file. The example GUI has had multiple Leica SR GSD position files loaded into the queue for processing. (B) Image of the MIiSR GUI, which is used to perform the analyses described in this paper on super-resolution position files generated by MIiSRconvert. Four ROIs from the current image have been added to the queue. A complete description of the use of the GUI can be found in its help file, and all assays are described in this paper. (C) Workflow of MIiSR analysis. Solid arrows indicate mandatory steps, dotted arrows and italicized text indicate optional steps.
Fig 2
Fig 2. Validation of Spatial Association Analysis (SAA) using defined-length DNA oligomers.
(A) SAA histogram plotting the distance between non-complementary 30-mer DNA oligomers 5’ labeled with Cy3 and Cy5. The vertical dotted line indicates the Colocalization Distance Criterion (CDC), the separation distance below which molecules are potentially interacting. To determine if the degree of colocalization is significant the positions of the Cy5-labeled molecules were randomized using a Monte Carlo approach and the SAA measurement repeated (SRP). (B) SAA histogram plotting the distance between annealed, complementary 30-mer DNA oligomers 5’ labeled with Cy3 and Cy5. (C) Measured and predicted intermolecular distances between Cy3 and Cy5 on differing length complementary DNA oligos 5’ labeled with Cy3 and Cy5 deposited on coverslips at equimolar concentration. N/C indicates the measured distance of non-complementary Cy3 and Cy5 labeled oligos deposited at the same concentration. (D) Impact of partial intermolecular interactions on SAA analysis, determined by annealing complementary 30-mer DNA oligomers 5’ labeled with Cy3 and Cy5 at differing ratios. SRP = Simulated Random Positions. A-B: Representative histograms, C-D: Data are presented as mean ± SEM. n = 3, minimum of 5 images per experiment. n.s. = not significantly different, paired t-test, † = p < 0.05 compared to SRP, * = p < 0.05 compared to Cy5:Cy3 at a 1:1 ratio.
Fig 3
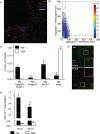
Fig 3. Quantification of intermolecular interactions between Nef, PACS-1, AP-1 and the Golgi, using Spatial Association Analysis.
(A) Representative image of GFP-Nef, PACS-1-mCherry and Golgin97 staining in a CD4+ HeLa cell 48 hours post-transfection. (B) SAA histogram of panel A, plotting the distance between each Nef molecule and the nearest PACS-1 and nearest Golgin97. Horizontal and vertical dotted lines indicate the CDC below which molecules are potentially colocalized. (C) Quantification of Nef colocalization patterns with Golgin97 and PACS-1, with the fraction of Nef colocalized with both Golgin97 and PACS-1, associated with either Golgin97 or PACS-1, or not colocalized with either molecule indicated. (D) Images of and (E) quantification of AP-1 and Nef colocalization patterns during the endocytosis-targeting (16 hrs) and Golgi-targeting (48 hrs) phases of Nef activity. SRP = Simulated Random Positions. A,D are representative images of, and B,C,E quantify 3 experiments, 5 images per experiment. Data are presented as mean ± SEM, † = p < 0.05 compared to SRP, * p < 0.05 compared to NEF-Golgin97-PACS-1 (C) or 16 hrs (E). Scale bars 2.5 μm, inserts are 3.5 μm x 3.5 μm.
Fig 4
Fig 4. Quantifying co-clustering using the radial distribution function and Ripley’s K function.
(A) The β2-adrenergic receptor (β2-AR, Green), β-arrestin-1 (βarr1, Red) and Clathrin (Blue) form an internalization complex after stimulation of the β2-adrenergic receptor in HEK293 cells with 10 μM isoproterenol. (B-C) Quantification of co-clustering of the β2-adrenergic receptor with β-arrestin-1 by (D) RDF analysis and (E) Ripley’s H-function, before (0 min) and 1 and 5 minutes post-stimulation with isoproterenol. (D-E) Quantification of β2-adrenergic receptor co-clustering with clathrin coated pits by (D) RDF analysis and (E) Ripley’s H-function, before (0 min) and 1 and 5 minutes post-stimulation with isoproterenol. (F) Self-clustering of the tetraspanin CD81 induced by the use of polyvalent versus mono/divalent labeling reagents. Ab = antibody. All images are representative of, and graphs quantify, 3 experiments with a minimum of 5 images per experiment. Data are presented as mean ± SEM, * = p < 0.05, n.s. = not significantly different, ANOVA with Bonferroni correction. Scale bar (A) is 2.5 μm, inserts are 1.47 μm x 1.47 μm. D-E: Arrows indicate mean cluster size, as determined by the radius of maximum H(r).
Fig 5
Fig 5. Quantification of the lysosomal marker LAMP1 in APP vesicles using the DBSCAN algorithm.
(A) GSDM image analyzed in panels B-D. All analyses are performed on the region within the insert. (B) Identification of clusters using the DBSCAN algorithm using two different values for minimum cluster size (k) and neighbourhood size (ε), with individual clusters identified by color. (C) Top: Regions of Interest (ROIs) defined by the edge points of APP clusters identified using DBSCAN values of k = 10 and ε = 100; individual clusters are identified by color. Bottom: APP-defined ROIs overlaid on LAMP1 staining. (D) Quantification of LAMP1 density inside of APP clusters versus APP cluster sizes. Images are representative of, and graph quantifies, images from 3 experiments with a minimum of 4 images per experiment. Data is presented as mean ± SEM.
Fig 6
Fig 6. Identification of lysosomes and multivesicular bodies using the OPTICS algorithm.
(A) Top: APP clusters were identified as “valleys” between RD “peaks” exceeding a static RD value (dotted line), and Bottom: LAMP1 clusters identified using a hierarchal segmentation approach. Select clusters are highlighted by colored region of the RD plots (left) and are circled by equivalent colored lines in the GSDM images (right). (B) A full hierarchal segmentation of the red LAMP1 cluster from panel A, demonstrating the nested hierarchal structure typical of multivesicular bodies. Insert plots the position of individual LAMP1 molecules within the cluster; colored circles correspond to putative intraluminal vesicles identified by the equivalent colored regions in the segmented RD plot, red arrow indicates where the RD plot joins the larger RD plot from panel A. (C) Comparison of APP cluster size and the association of APP clusters with LAMP1. (D) Quantification of APP density in LAMP1 clusters identified by OPTICS and separated based on whether the APP was associated with MVB-like, small lysosomal, or LAMP1-negative vesicles. (E) Quantification of APP density in the total (Bounding MVB) and intraluminal vesicle (ILV) portions of the MVB-like LAMP1 clusters. All images are representative of three experiments, a minimum of 4 images per experiment. Data are presented as mean ± SEM, scale bars are 500 nm (A) and 150 nm (B). * = p < 0.05 compared to MVB-like, n.s. = not significantly different.
Fig 7
Fig 7. Combining multiple analyses to characterize inter-protein interactions.
(A) Conventional microscopy images of dimerized Nef, detected by bimolecular fluorescence complementation (Nef, red) and the Golgi trafficking regulator TGN46 (green). ROI has a Mander’s colocalization ratio (Nef:TGN46) of 0.842. (B) GSDM image of the ROI indicated in panel A. (C-D) SAA plots and (E) quantification of Nef interactions with TGN46 (C, E) and the reverse quantification of TGN46 interaction with Nef (D,E). (F) Ripley’s H function analysis of Nef:TGN46 co-clustering. (G) TGN46 density in Nef-containing vesicles of increasing size. Nef-containing vesicles were identified using the OPTICS algorithm, and the density of TGN46 in each Nef-containing vesicle quantified. (H) Fraction of total detected TGN46 in small (<60 nm) and large (>60 nm) Nef vesicles. Images are representative of, and graphs quantify, 8 images collected in two experiments. Data are presented as mean ± SEM (E,H) or are representative plots from single images (C,D,F,G). Scale bars are 2.5 μm (A) or 0.5 μm (B), ROI (A) is 3.94 μm x 3.94 μm. SRP = Simulated Random Positions. * = p<0.05 compared to SRP, paired t-test (E) or vesicles <60nm, Students t-test (H).

References

    1. Fairn GD, Grinstein S. How nascent phagosomes mature to become phagolysosomes. Trends Immunol. Elsevier Ltd; 2012; 1–9. - PubMed
    1. Huotari J, Helenius A. Endosome maturation. EMBO J. Nature Publishing Group; 2011;30: 3481–500. 10.1038/emboj.2011.286 - DOI - PMC - PubMed
    1. Hutagalung AH, Novick PJ. Role of Rab GTPases in membrane traffic and cell physiology. Physiol Rev. 2011;91: 119–49. 10.1152/physrev.00059.2009 - DOI - PMC - PubMed
    1. Santiago-Tirado FH, Bretscher A. Membrane-trafficking sorting hubs: cooperation between PI4P and small GTPases at the trans-Golgi network. Trends Cell Biol. Elsevier Ltd; 2011;21: 515–525. 10.1016/j.tcb.2011.05.005 - DOI - PMC - PubMed
    1. Epp N, Rethmeier R, Krämer L, Ungermann C. Membrane dynamics and fusion at late endosomes and vacuoles—Rab regulation, multisubunit tethering complexes and SNAREs. Eur J Cell Biol. Elsevier GmbH.; 2011;90: 779–85. 10.1016/j.ejcb.2011.04.007 - DOI - PubMed

Publication types

Substances

LinkOut - more resources