. 2016 Apr 20;44(7):3031-44.
doi: 10.1093/nar/gkv1348. Epub 2015 Dec 10.

Integrin α4β1 controls G9a activity that regulates epigenetic changes and nuclear properties required for lymphocyte migration

Affiliations

Integrin α4β1 controls G9a activity that regulates epigenetic changes and nuclear properties required for lymphocyte migration

Xiaohong Zhang et al. Nucleic Acids Res. .

Abstract

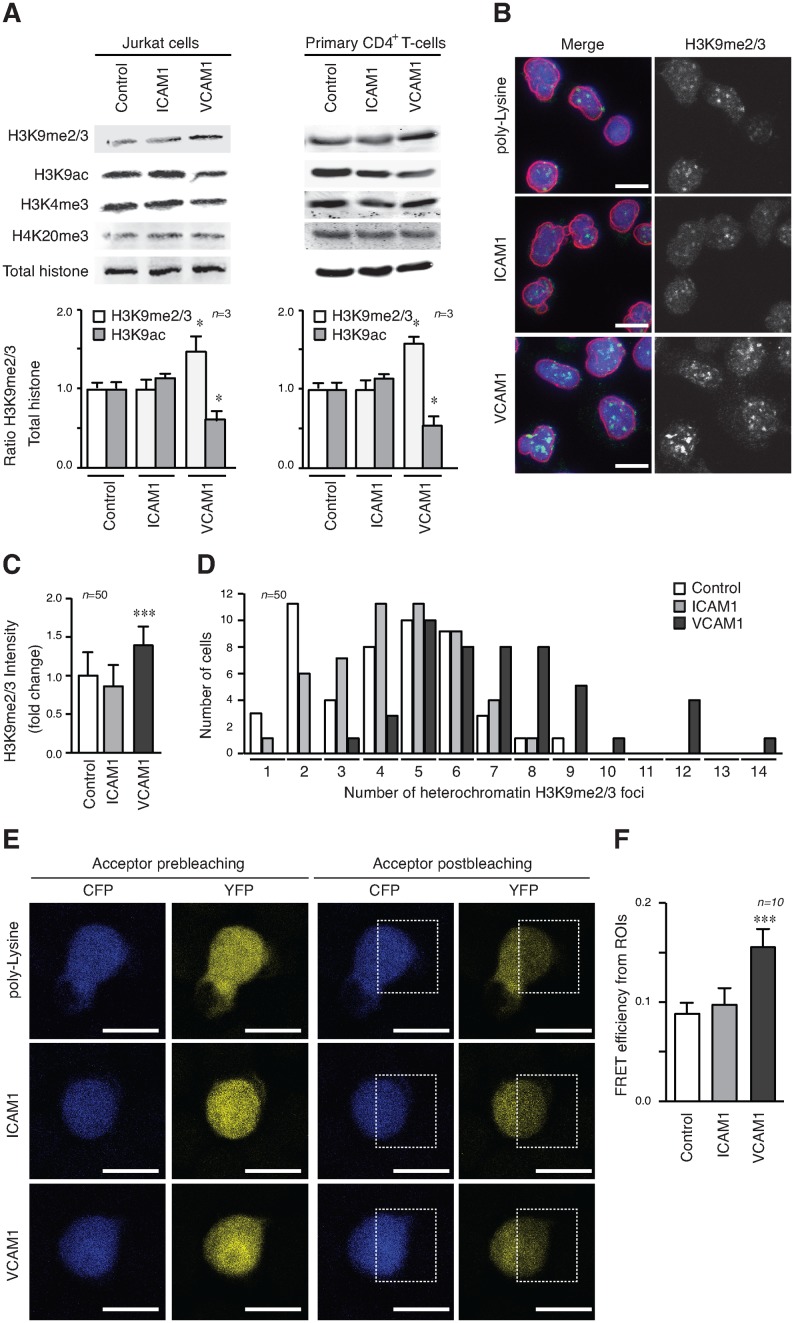
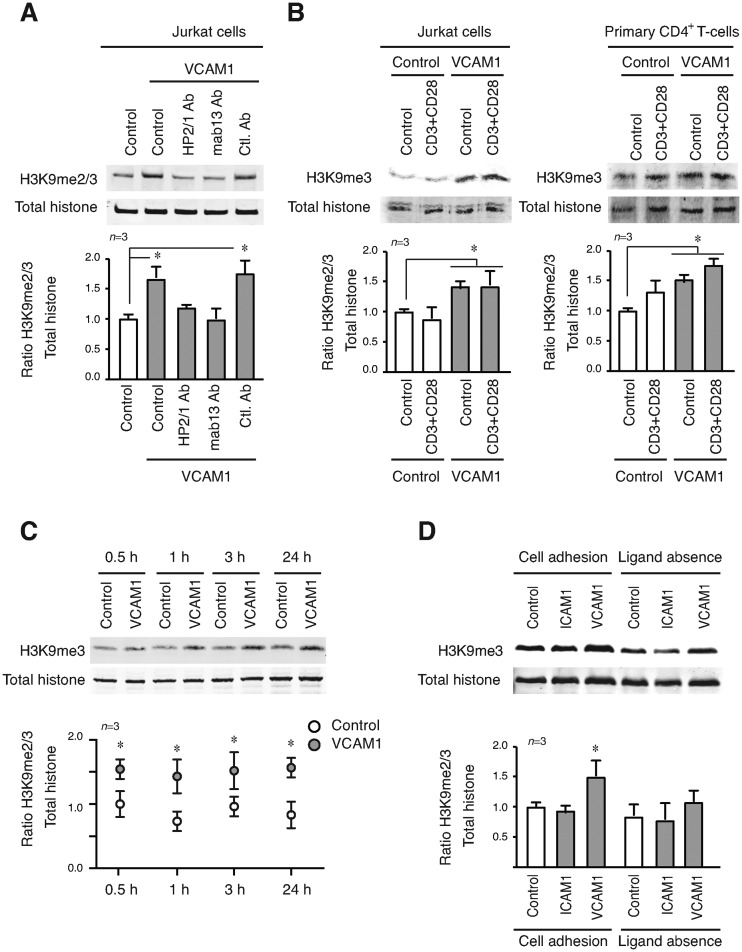
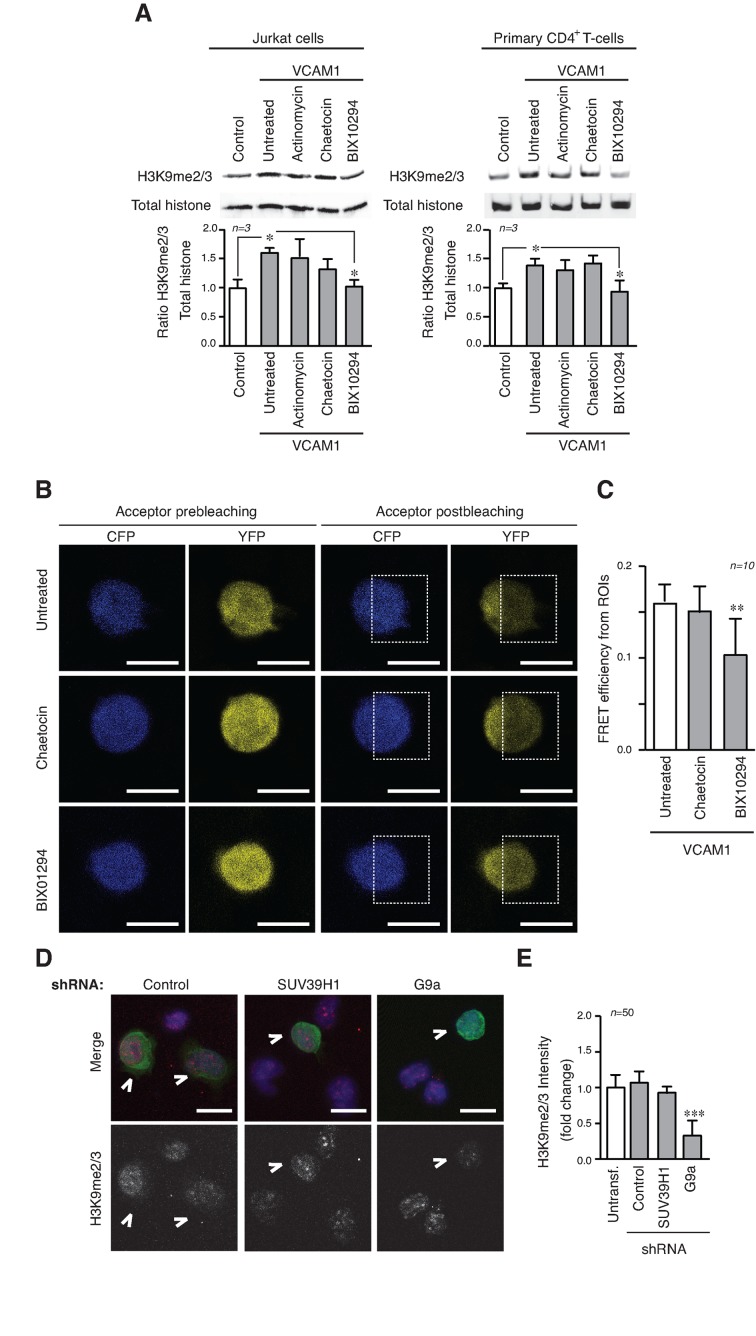
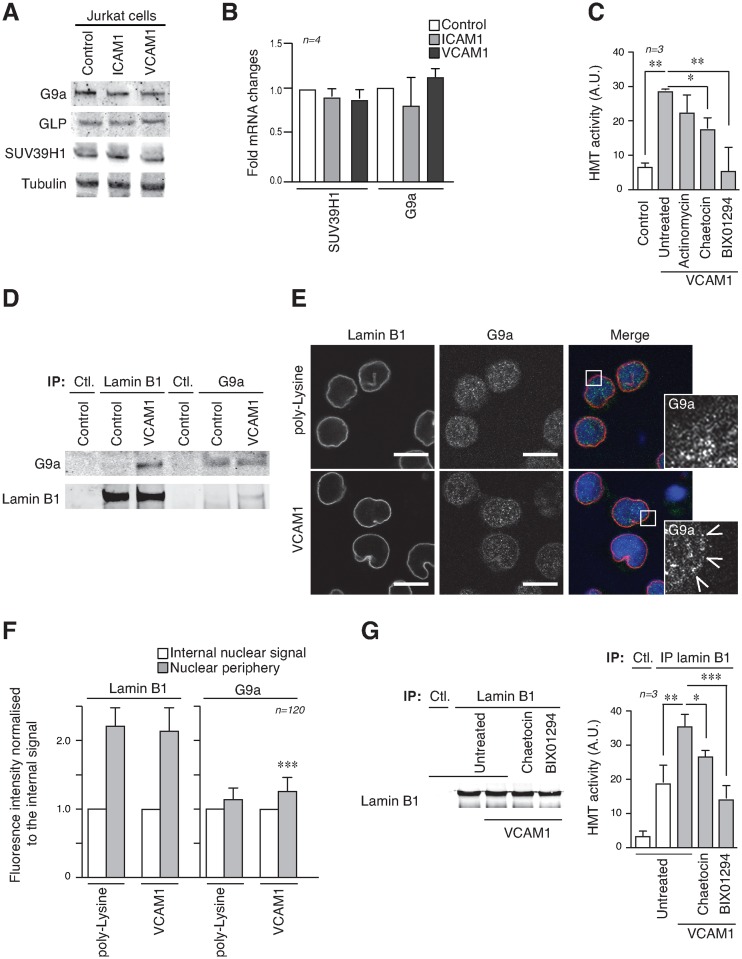
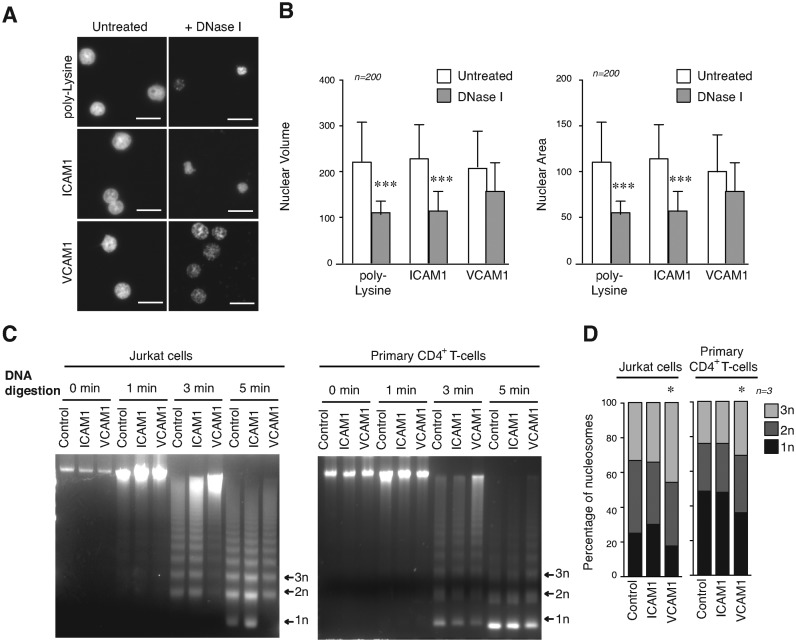
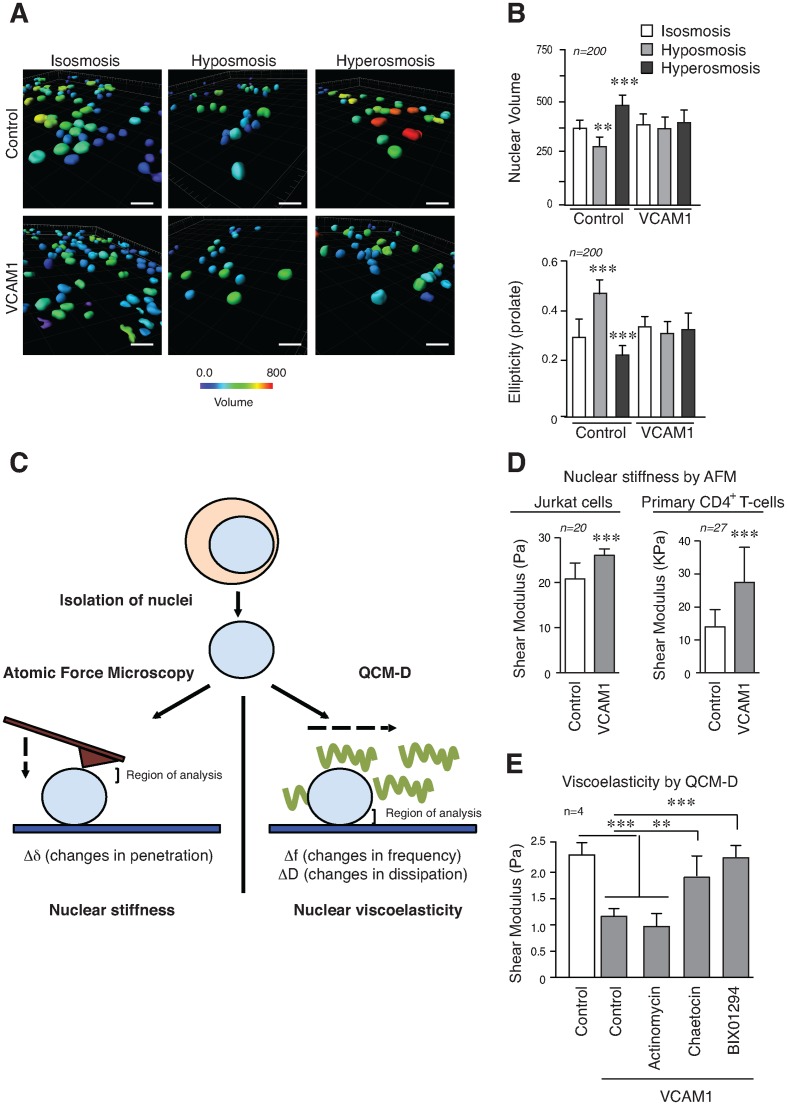
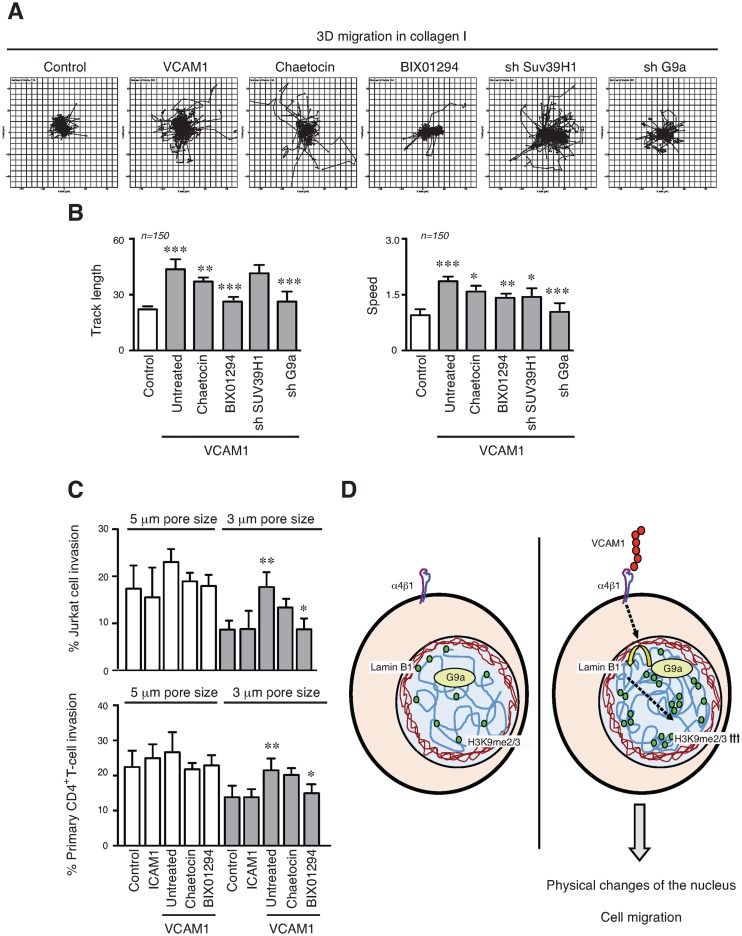
The mechanical properties of the cell nucleus change to allow cells to migrate, but how chromatin modifications contribute to nuclear deformability has not been defined. Here, we demonstrate that a major factor in this process involves epigenetic changes that underpin nuclear structure. We investigated the link between cell adhesion and epigenetic changes in T-cells, and demonstrate that T-cell adhesion to VCAM1 via α4β1 integrin drives histone H3 methylation (H3K9me2/3) through the methyltransferase G9a. In this process, active G9a is recruited to the nuclear envelope and interacts with lamin B1 during T-cell adhesion through α4β1 integrin. G9a activity not only reorganises the chromatin structure in T-cells, but also affects the stiffness and viscoelastic properties of the nucleus. Moreover, we further demonstrated that these epigenetic changes were linked to lymphocyte movement, as depletion or inhibition of G9a blocks T-cell migration in both 2D and 3D environments. Thus, our results identify a novel mechanism in T-cells by which α4β1 integrin signaling drives specific chromatin modifications, which alter the physical properties of the nucleus and thereby enable T-cell migration.


Figures

Figure 1.
Figure 1.
T-cell adhesion to VCAM1 induces H3K9 methylation. (A) Jurkat (left panel) or primary CD4+ T-cells (right panel) were cultured in suspension (Control), on ICAM1 (5 μg/ml) and VCAM1 (5 μg/ml) for 24 h and lysates analysed by Western blotting. Graphs show the ratio of H3K9me2/3 versus total histone and normalised respect to control cells. (B) Jurkat cells cultured on poly-Lysine, ICAM1 or VCAM1 (all at 5 μg/ml) were fixed and stained with Hoechst (DNA, blue), anti-lamin B1 (nuclear envelope, red) and anti-H3K9me2/3 (heterochromatin, green). Bar 10 μm. (C) Graph shows the quantification of H3K9me2/3 fluorescence intensity of cells in (B). (D) Quantification of the increase of heterochromatin foci, as seen by number of H3K9me2/3 foci counted per nucleus in (B). (E) Jurkat cells transfected with a FRET-H3K9 methylation biosensor and were cultured on poly-Lysine, ICAM1 or VCAM1. Images show the CFP and YFP signals before and after YFP photobleaching at 514 nm in the area delineated (ROI, region of interest). Bar 10 μm. (F) Graph represents the quantification of FRET efficiency from the pre- and post-donor fluorescence intensities in the photobleached area (ROI). The average FRET efficiency is expressed as the mean ± S.E. From 10 cells. *P < 0.05; **P < 0.01; ***P < 0.001.
Figure 2.
Figure 2.
α4β1 integrin-VCAM1 interaction is essential for the epigenetic changes induced upon T-cell adhesion. (A) Jurkat were preincubated with blocking antibodies against -α4 (HP2/1) and -β1 (mab13) integrin subunits; or a control antibody (all of them at 10 μg/ml), 30 min prior cell culture onto VCAM1. Cells were lysed after 24 h and protein expression analysed by Western blotting. (B) Jurkat (left panel) or primary CD4+ T-cells (right panel) were cultured for 24 h in the presence of anti-CD3 and anti-CD28 antibodies. Epigenetic changes were analysed by Western blotting. (C) Jurkat cells were cultured in suspension or on VCAM1 at different times, lysed and H3K9me2/3 levels quantified by western blotting. (D) Jurkat cells were cultured on different conditions for 24 h, collected and cultured for an additional 24 h in the absence of any ligand. Lysates were analysed by Western blotting and quantified. *P < 0.05.
Figure 3.
Figure 3.
The activity of the HMT G9a is required for the epigenetic changes induced by α4β1 adhesion. (A) Jurkat (left panel) or primary CD4+ T-cells (right panel) were cultured on VCAM1 in the presence of actinomycin (transcriptional inhibitor), chaetocin (Suv39H inhibitor) or BIX01294 (G9a/GLP inhibitor). After 24 h, cells were lysed and proteins levels analysed by Western blotting. (B) Jurkat cells transfected with the H3K9 FRET methylation biosensor were cultured as in (A). CFP and YFP signals were measured pre- (left panels) and post-YFP photobleaching (right panels) at 514 nm in the area delineated. Bar 10 μm. (C) Graph represents the FRET efficiency mean calculated from the pre- and post-donor fluorescence intensities in the photobleached area. (D) Untransfected or stable GFP+ shRNA for G9a, SUV39H1 and control Jurkat cells were mixed and cultured on VCAM1. After 24 h, cells were fixed and stained with Hoechst (blue) and anti-H3K9me2/3 (red). The arrows mark stable transfected cells. Bar 10 μm. (E) Graph shows the quantification of H3K9me2/3 fluorescence intensity of cells in (D). *P < 0.05; **P < 0.01; ***P < 0.001.
Figure 4.
Figure 4.
Cell adhesion controls G9a activity and its interaction with the nuclear envelope. (A) Jurkat cells were cultured on different substrates and protein expression analysed by Western blotting. (B) RNA was isolated from Jurkat cells as in (A). RT-qPCR analysis was performed using primers directed at specific genes, as indicated. Values were calculated as the mean relative expression after normalization to two housekeeping genes 6 SEM. (C) In vitro H3K9 HMT enzymatic assay from nuclear fractions of Jurkat cells cultured in suspension or on VCAM1 in the presence or not of different inhibitors. (D) Complexes (IP) were precipitated from Jurkat cells cultured in suspension or on VCAM1 for 24 h with anti-lamin B1 and anti-G9a antibodies and probed with different antibodies. (E) Jurkat cells were cultured on poly-Lysine or VCAM1 and then fixed and stained with Hoechst (blue), anti-lamin B1 (red) and anti-G9a (green). Arrows indicate G9a localisation at the nuclear envelope. Bar 10 μm. (F) Lamin B1 and G9a signals were quantified at the nuclear periphery or inside the nucleus. (G) Lamin B1 fractions immunoprecipitated from Jurkat cells cultured under different conditions were resolved by Western blotting. Graph shows the HMT activity associated to lamin B1 immune complexes. *P < 0.05; **P < 0.01; ***P < 0.001.
Figure 5.
Figure 5.
Cell adhesion through α4β1 regulates global chromatin conformation. (A) Jurkat cells were cultured on poly-Lysine, ICAM1 or VCAM1 for 24 h. Cytoskeleton was removed by extensive CSK buffer washes and DNA was digested by DNaseI before fixation. Remaining DNA was stained with Hoechst. Bar 10 μm. (B) Graphs show the quantification of the nuclear volume and area from cells in (A). (C) Jurkat (left panel) or primary CD4+ T-cells (right panel) were cultured in suspension, on ICAM1 and VCAM1 for 24 h. Then, cells were digested with micrococcal nuclease at indicated times. DNA fragments were purified and resolved in agarose gel. (D) Nucleosomal releasing from cells in (C) was analysed after micrococcal digestion and the mononucleosomes (1n), dinuclueosomes (2n) and trinucleosomes (3n) quantified. *P < 0.05; ***P < 0.001.
Figure 6.
Figure 6.
Epigenetic changes induced by α4β1 contribute to nuclear stiffness and viscoelasticity. (A) Jurkat cells were cultured on poly-Lysine or VCAM1 for 24 h and then medium was changed for isotonic, hypotonic or hypertonic medium to induced osmotic stress. Cells were fixed, stained with Hoechst and analysed by confocal microscopy. Reconstruction of nuclei was done from images and changes in the nuclear volume analysed. Bar 10 μm. (B) The graphs illustrate the quantification of the nuclear volume and ellipticity (prolate) from cells in (A). (C) Schematic representation of different technical approaches used to determine the nuclear stiffness and viscoelasticity of isolated nuclei. The regions of interest analysed in each technique (the top region for AFM (Atomic Force Microscopy), and bottom form QCM-D) are indicated. (D) Isolated nuclei from Jurkat or primary CD4+ T-cells cultured in suspension and on VCAM1 were sedimented onto poly-Lysine coated slides, fixed with formaldehyde and analysed by AFM. Values from nine different points of each nucleus were taken. (E) Nuclei isolated as in (C) were attached to a quartz chip coated in poly-Lysine. The viscoelastic properties of the layer at confluence were calculated using the Voigt–Kelvin approximation. ** P < 0.01; ***P < 0.001.
Figure 7.
Figure 7.
Epigenetic changes enhance the T-cell migration. (A) Jurkat cells were cultured for 24 h on VCAM1 in the presence or not of inhibitors. Depleted cells for suv39H and G9a were analysed. Then cells were labelled, collected and mixed in a 3D collagen matrix (1.7 mg/ml). Panels show results of cell trajectory plots. (B) Track length and velocities of migrating cells in collagen gel were quantified. (C) Jurkat cells (upper panel) or primary CD4+ T-cells (lower panel) were cultured on VCAM1 for 24 h in the presence or not of chaetocin or BIX01294. Then, cells were collected and migration quantified across Transwell filters (3- or 5-μm pore sizes). The cell migration was induced with 100 ng/ml CXCL12. Data are expressed as a percentage of input cells. (D) Schematic representation showing how in T-cells α4β1 integrin, upon adhesion to its ligand VCAM1, induces G9a recruitment at the nuclear envelope, resulting in upregulation of H3K9me2/3 levels. This leads changes in the chromatin structure, which contribute to the physical properties of the nucleus. These epigenetic changes induced by the integrin promote cell migration even through narrow spaces where high nuclear plasticity is required. *P < 0.05; **P < 0.01; ***P < 0.001.

Similar articles

Cited by

References

    1. Lauffenburger D.A., Horwitz A.F. Cell migration: a physically integrated molecular process. Cell. 1996;84:359–369. - PubMed
    1. Ridley A.J., Schwarts M.A., Burridge K., Firtel R.A., Ginsberg M.H., Borisy G., Parsons J.T., Horwitz A.R. Cell migration: integrating signals from front to back. Science. 2003;302:1704–1709. - PubMed
    1. Friedl P., Sahai E., Weiss S., Yamada K.M. New dimensions in cell migration. Nat. Rev. Mol. Cell Biol. 2012;13:743–747. - PubMed
    1. Wolf K., Te Lindert M., Krause M., Alexander S., Te Riet J., Willis A.L., Hoffman R.M., Figdor C.G., Weiss S.J., Friedl P. Physical limits of cell migration: control by ECM space and nuclear deformation and tuning by proteolysis and traction force. J. Cell Biol. 2013;201:1069–1084. - PMC - PubMed
    1. You J.S., Jones P.A. Cancer genetics and epigenetics: two sides of the same coin. Cancer Cell. 2012;22:9–20. - PMC - PubMed

Publication types

MeSH terms