. 2015 Dec 11;11(12):e1004648.
doi: 10.1371/journal.pcbi.1004648. eCollection 2015 Dec.

Simple Plans or Sophisticated Habits? State, Transition and Learning Interactions in the Two-Step Task

Affiliations

Simple Plans or Sophisticated Habits? State, Transition and Learning Interactions in the Two-Step Task

Thomas Akam et al. PLoS Comput Biol. .

Abstract

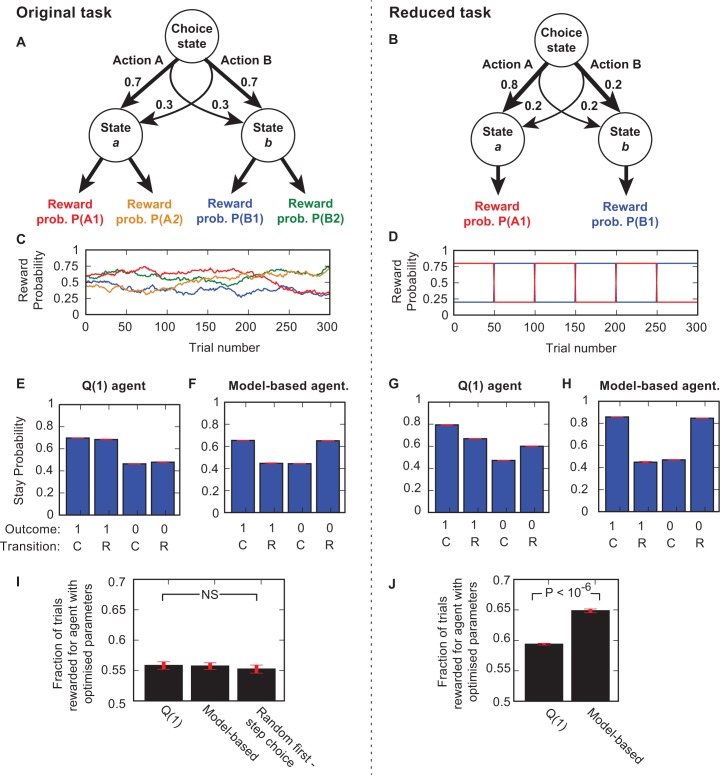
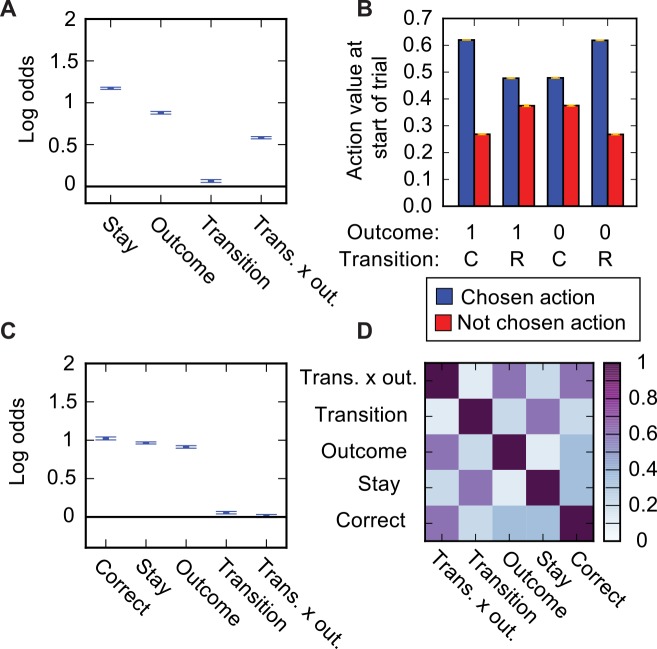
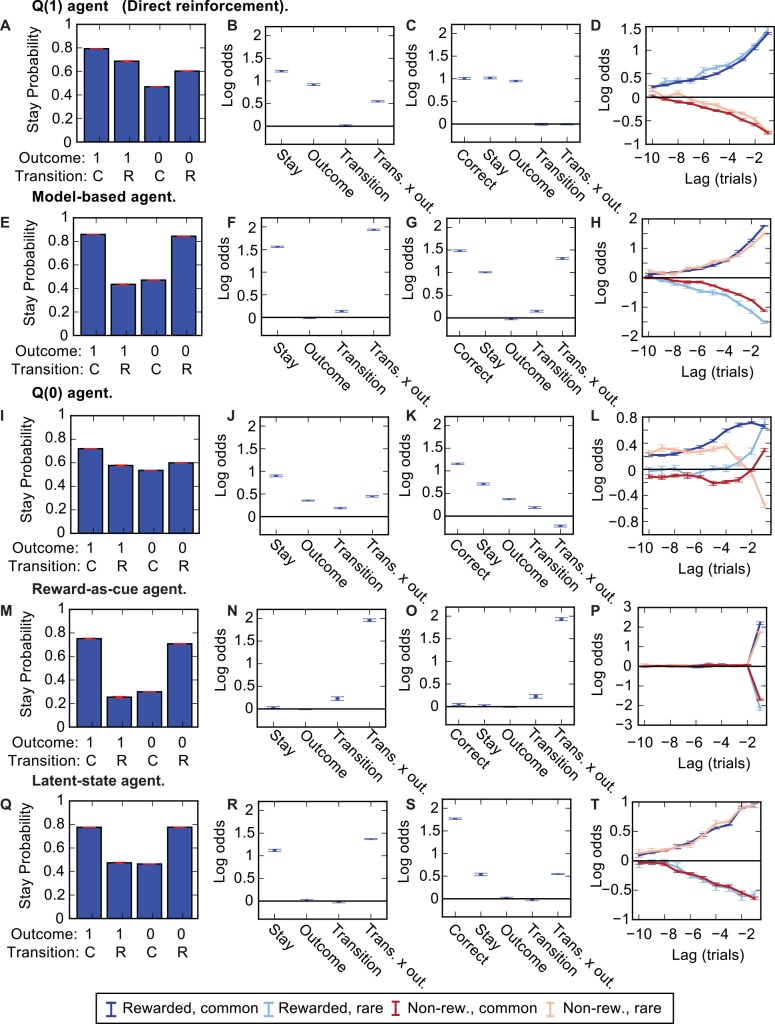
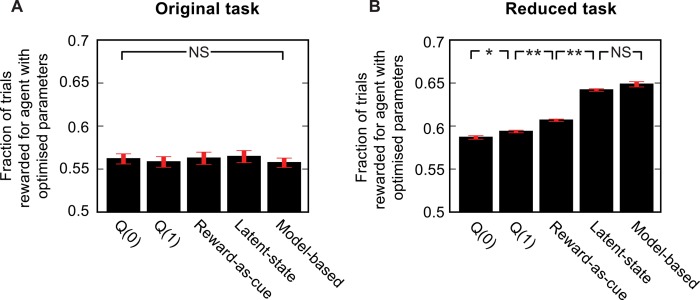
The recently developed 'two-step' behavioural task promises to differentiate model-based from model-free reinforcement learning, while generating neurophysiologically-friendly decision datasets with parametric variation of decision variables. These desirable features have prompted its widespread adoption. Here, we analyse the interactions between a range of different strategies and the structure of transitions and outcomes in order to examine constraints on what can be learned from behavioural performance. The task involves a trade-off between the need for stochasticity, to allow strategies to be discriminated, and a need for determinism, so that it is worth subjects' investment of effort to exploit the contingencies optimally. We show through simulation that under certain conditions model-free strategies can masquerade as being model-based. We first show that seemingly innocuous modifications to the task structure can induce correlations between action values at the start of the trial and the subsequent trial events in such a way that analysis based on comparing successive trials can lead to erroneous conclusions. We confirm the power of a suggested correction to the analysis that can alleviate this problem. We then consider model-free reinforcement learning strategies that exploit correlations between where rewards are obtained and which actions have high expected value. These generate behaviour that appears model-based under these, and also more sophisticated, analyses. Exploiting the full potential of the two-step task as a tool for behavioural neuroscience requires an understanding of these issues.


Conflict of interest statement

The authors have declared that no competing interests exist.

Figures

Fig 1
Fig 1. Original and reduced versions of the two-step task.
(A, B) Diagram of task structure for original (A) and reduced (B) two step tasks. (C, D) Example reward probability trajectories for the second-step actions in each task. (E—H) Stay probability plots for Q(1) (E,G) and model-based (F, H) agents on the two task versions. Plots show the fraction of trials on which the agent repeated its choice following rewarded and non-rewarded trials with common and rare transitions (SEM error bars shown in red). (I, J) Performance (fraction of trials rewarded) achieved by Q(1) and model based agents, and by an agent which chooses randomly at the first step. Agent parameters in (I,J) have been optimised to maximise the fraction of rewarded trials.
Fig 2
Fig 2. Stay probability transition-outcome interaction for Q(1) agent due to trial start action values.
(A) Predictor loadings for logistic regression model predicting whether the Q(1) agent will repeat the same choice as a function of 4 predictors; Stay–a tendency to repeat the same choice irrespective of trial events, Outcome–a tendency to repeat the same choice following a rewarded trial, Transition—a tendency to repeat the same choice following common transitions, Transition x outcome interaction–a tendency to repeat the same choice dependent on the interaction between transition (common/rare) and outcome (rewarded/not). (B) Action values at the start of the trial for the chosen and not chosen action shown separately for trials with different transitions (common or rare) and outcomes (rewarded or not). Yellow error bars show SEM across sessions. (C) Predictor loadings for logistic regression model with additional predictor capturing tendency to repeat correct choices, i.e. choices whose common transition lead to the state which currently has high reward probability. (D) Across trial correlation between predictors in logistic regression analysis shown in (C).
Fig 3
Fig 3. Comparison of agents’ behaviour–reduced task.
Comparison of the behaviour of all agents types discussed in the paper on the reduced task. Far left panels–Stay probability plots. Centre left panels—Predictor loadings for logistic regression model predicting whether the agent will repeat the same choice as a function of 4 predictors; Stay–a tendency to repeat the same choice irrespective of trial events, Outcome–a tendency to repeat the same choice following a rewarded trial, Transition—a tendency to repeat the same choice following common transitions, Transition x outcome interaction–a tendency to repeat the same choice dependent on the interaction between transition (common/rare) and outcome (rewarded/not). Centre right panels–Predictor loadings for logistic regression analysis with additional ‘correct’ predictor which captures a tendency to repeat correct choices. Right panels—Predictor loadings for lagged logistic regression model. The model uses a set of 4 predictors at each lag, each of which captures how a given combination of transition (common/rare) and outcome (rewarded/not) predicts whether the agent will repeat the choice a given number of trials in the future, e.g, the ‘rewarded, rare’ predictor at lag -2 captures the extent to which receiving a reward following a rare transition predicts that the agent will choose the same action two trials later. Legend for right panels is at bottom of figure. Error bars in all plots show SEM across sessions. Agent types: (A-D) Q(1), (E-H) Model-based, (I-L) Q(0), (M-P) Reward-as-cue, (Q-T) Latent-state.
Fig 4
Fig 4. Comparison of agents’ performance.
Performance achieved by different agent types in the original (A) and reduced (B) tasks, with parameter values optimised to maximise the fraction of trials rewarded. For the reward as cue agent, performance is shown for a fixed strategy of choosing action A (B) following reward in state a (b) and action B (A) following non-reward in state a (b). SEM error bars shown in red. Significant differences indicated by *: 5 < 0.05, ** P < 10−5.
Fig 5
Fig 5. Likelihood comparison.
Data likelihood for maximum likelihood fits of different agent types (indicated by x-axis labels; MB–Model based, RC–Reward-as-cue, LS–Latent-state) to data simulated from each agent type (indicted by labels above axes) on the reduced (A-E) and original (F-J) tasks. All differences in data likelihood between different agents fit to the same data are significant at P < 10−4 except for that between the fit of the reward-as-cue and latent-state agents to data simulated from the reward-as-cue agent which is significant at P = 0.027.

References

    1. Balleine BW, Dickinson A. Goal-directed instrumental action: contingency and incentive learning and their cortical substrates. Neuropharmacology. 1998;37: 407–419. - PubMed
    1. Dolan RJ, Dayan P. Goals and Habits in the Brain. Neuron. 2013;80: 312–325. 10.1016/j.neuron.2013.09.007 - DOI - PMC - PubMed
    1. Sutton RS, Barto AG. Reinforcement learning: An introduction The MIT press; 1998.
    1. Daw ND, Niv Y, Dayan P. Uncertainty-based competition between prefrontal and dorsolateral striatal systems for behavioral control. Nat Neurosci. 2005;8: 1704–11. doi:nn1560 - PubMed
    1. Gläscher J, Daw N, Dayan P, O’Doherty JP. States versus Rewards: Dissociable Neural Prediction Error Signals Underlying Model-Based and Model-Free Reinforcement Learning. Neuron. 2010;66: 585–595. 10.1016/j.neuron.2010.04.016 - DOI - PMC - PubMed

Publication types

LinkOut - more resources