

Circulating protein synthesis rates reveal skeletal muscle proteome dynamics
- PMID: 26657858
- PMCID: PMC4701543
- DOI: 10.1172/JCI79639
Circulating protein synthesis rates reveal skeletal muscle proteome dynamics
Abstract
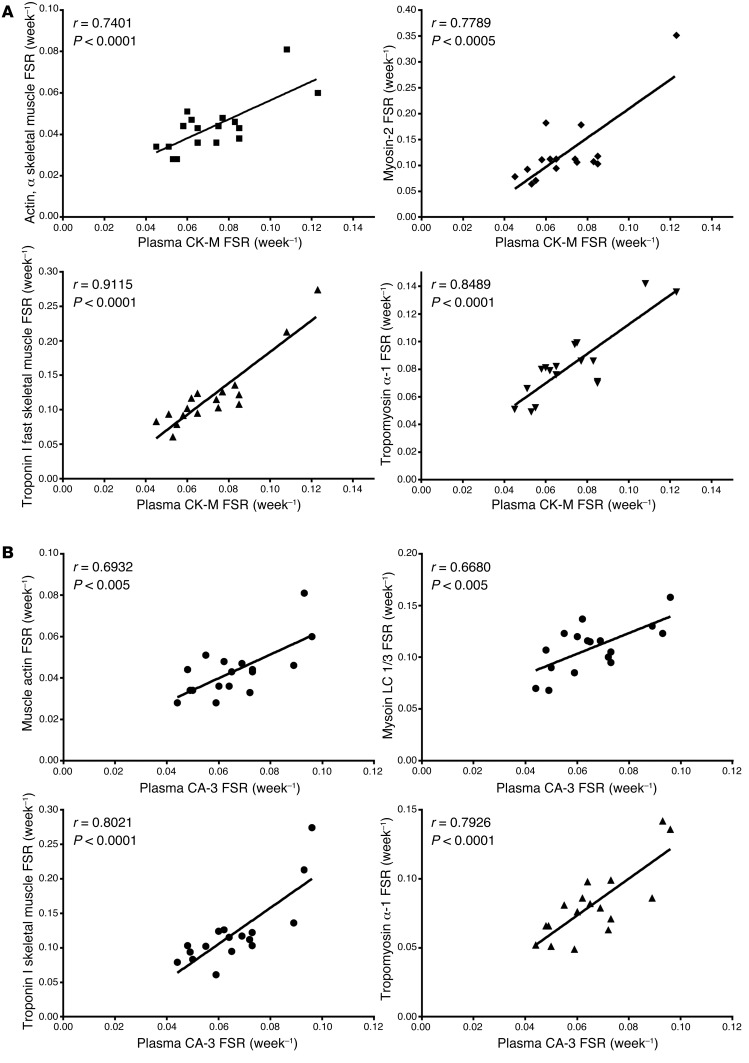
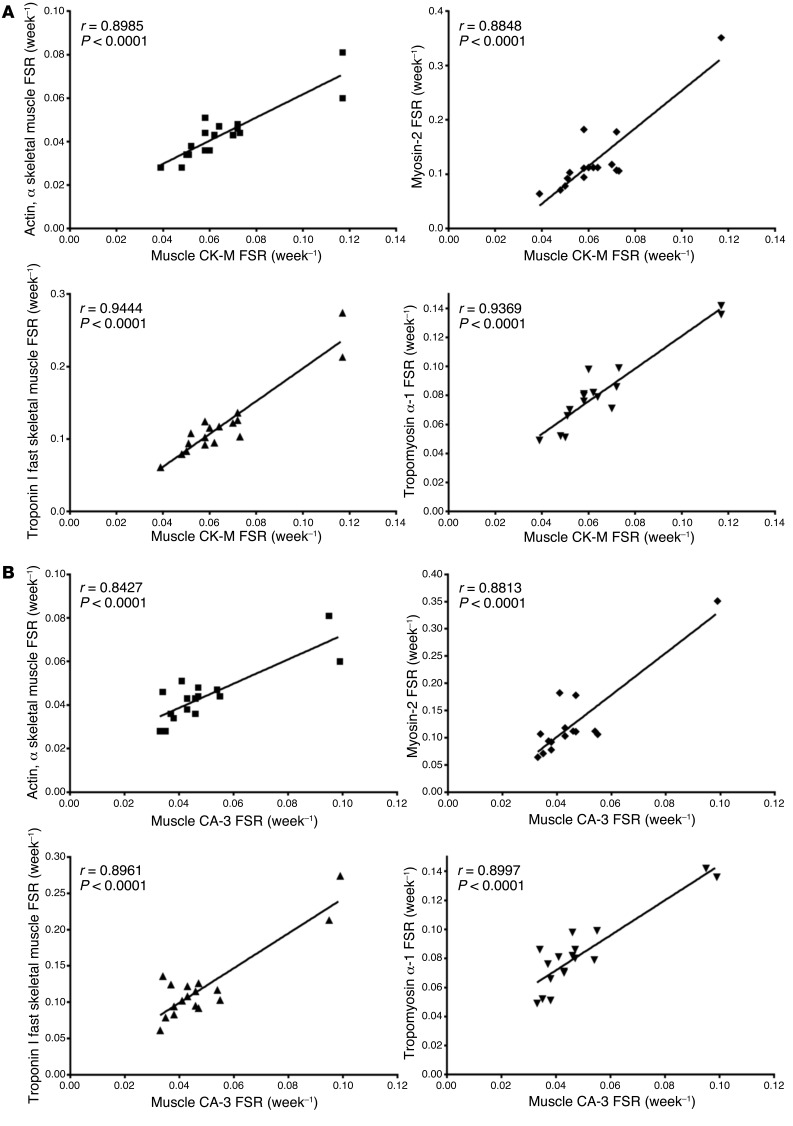
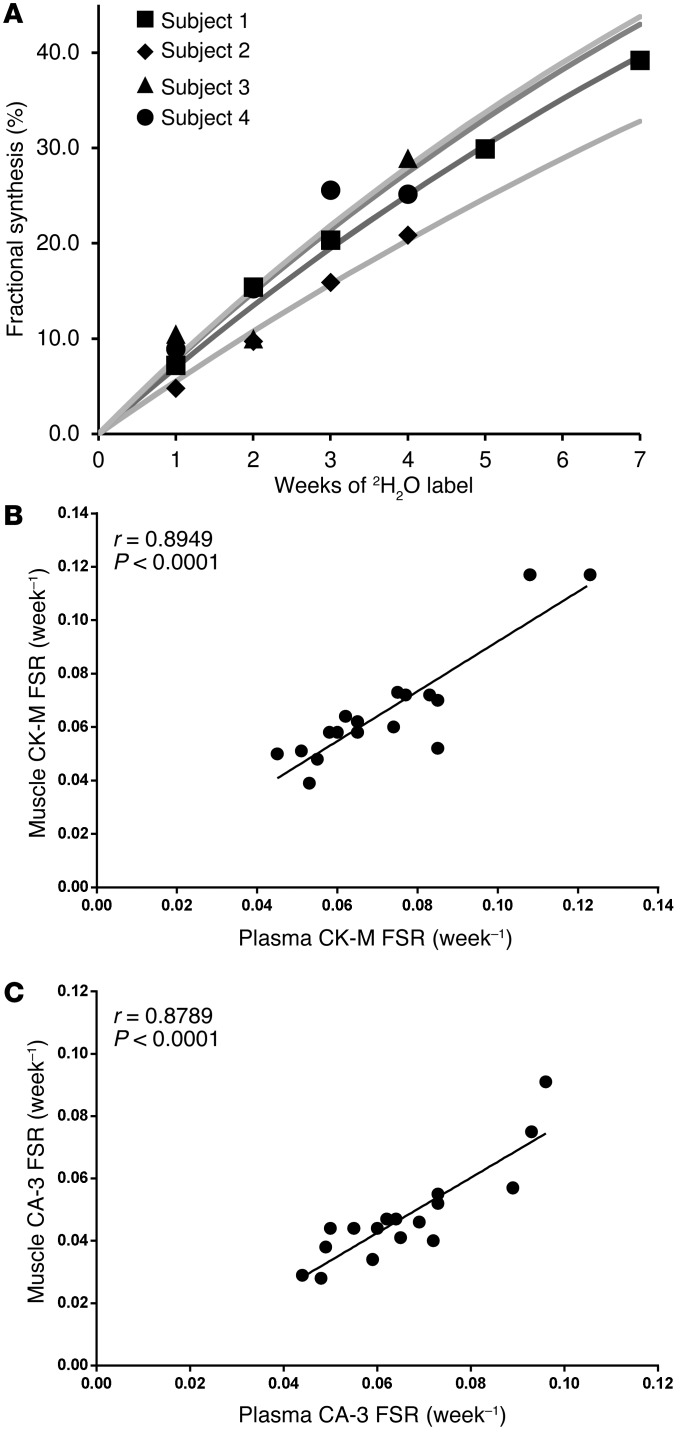
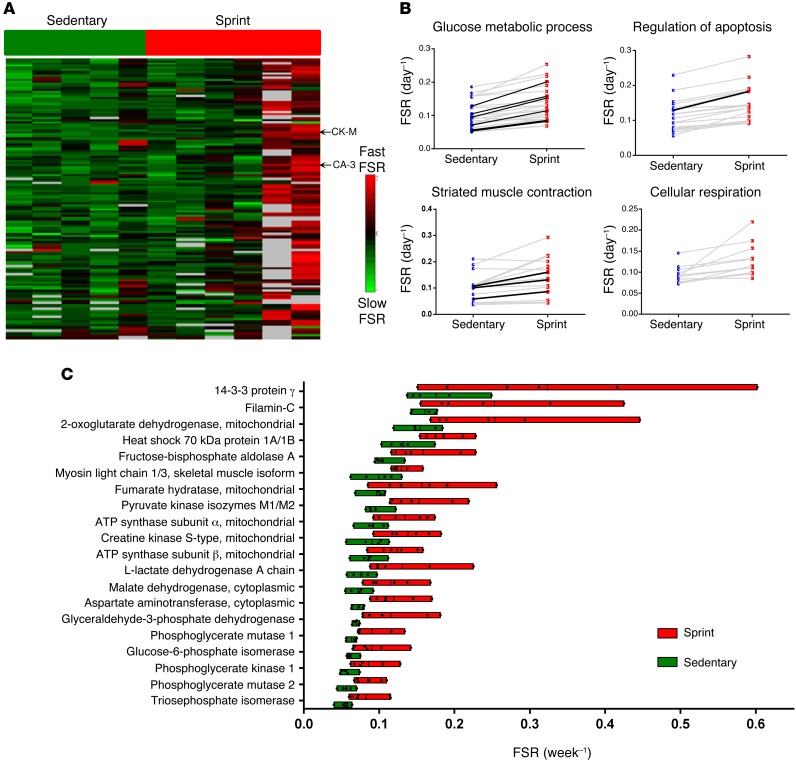
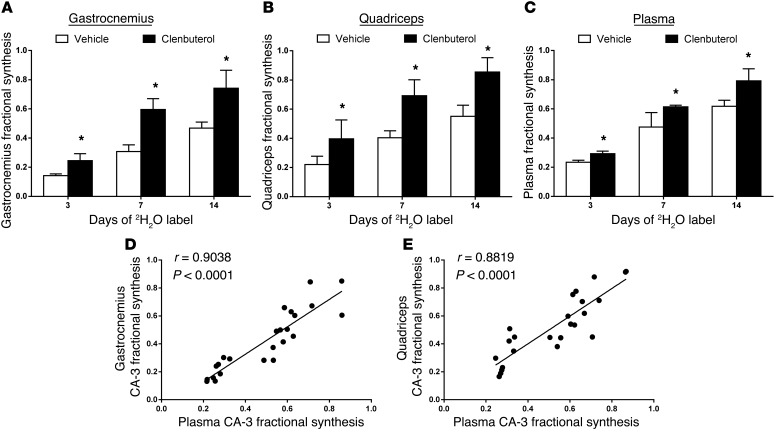
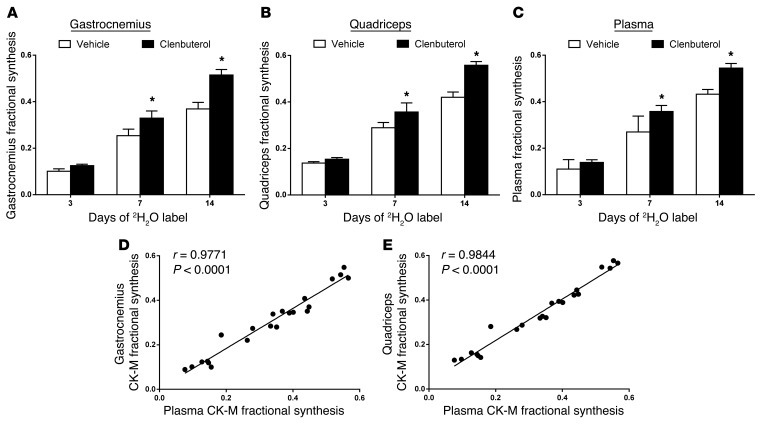
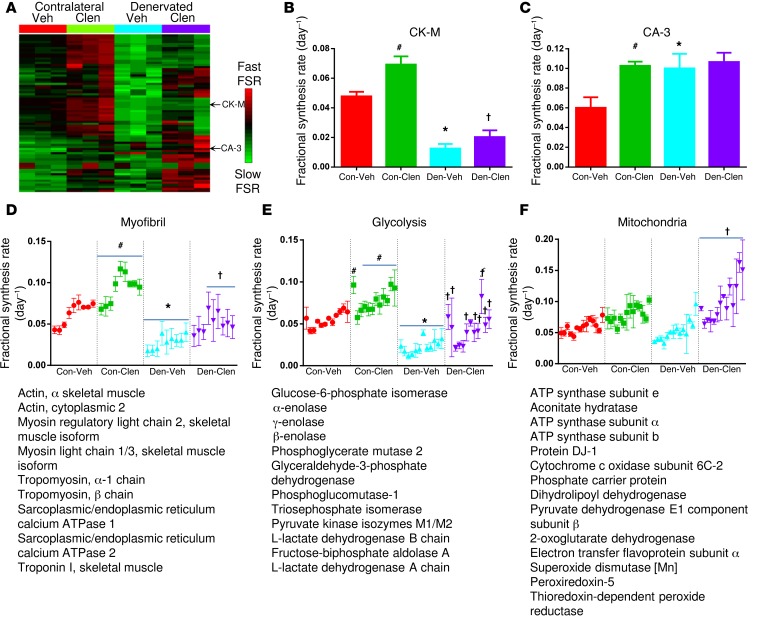
Here, we have described and validated a strategy for monitoring skeletal muscle protein synthesis rates in rodents and humans over days or weeks from blood samples. We based this approach on label incorporation into proteins that are synthesized specifically in skeletal muscle and escape into the circulation. Heavy water labeling combined with sensitive tandem mass spectrometric analysis allowed integrated synthesis rates of proteins in muscle tissue across the proteome to be measured over several weeks. Fractional synthesis rate (FSR) of plasma creatine kinase M-type (CK-M) and carbonic anhydrase 3 (CA-3) in the blood, more than 90% of which is derived from skeletal muscle, correlated closely with FSR of CK-M, CA-3, and other proteins of various ontologies in skeletal muscle tissue in both rodents and humans. Protein synthesis rates across the muscle proteome generally changed in a coordinate manner in response to a sprint interval exercise training regimen in humans and to denervation or clenbuterol treatment in rodents. FSR of plasma CK-M and CA-3 revealed changes and interindividual differences in muscle tissue proteome dynamics. In human subjects, sprint interval training primarily stimulated synthesis of structural and glycolytic proteins. Together, our results indicate that this approach provides a virtual biopsy, sensitively revealing individualized changes in proteome-wide synthesis rates in skeletal muscle without a muscle biopsy. Accordingly, this approach has potential applications for the diagnosis, management, and treatment of muscle disorders.
Figures
Similar articles
-
Proteome-wide muscle protein fractional synthesis rates predict muscle mass gain in response to a selective androgen receptor modulator in rats.Am J Physiol Endocrinol Metab. 2016 Mar 15;310(6):E405-17. doi: 10.1152/ajpendo.00257.2015. Epub 2015 Dec 29. Am J Physiol Endocrinol Metab. 2016. PMID: 26714847
-
Effect of resistance training and protein intake pattern on myofibrillar protein synthesis and proteome kinetics in older men in energy restriction.J Physiol. 2018 Jun;596(11):2091-2120. doi: 10.1113/JP275246. Epub 2018 Apr 17. J Physiol. 2018. PMID: 29532476 Free PMC article.
-
Recent advances for measurement of protein synthesis rates, use of the 'Virtual Biopsy' approach, and measurement of muscle mass.Curr Opin Clin Nutr Metab Care. 2017 May;20(3):191-200. doi: 10.1097/MCO.0000000000000370. Curr Opin Clin Nutr Metab Care. 2017. PMID: 28257333 Review.
-
Profoundly lower muscle mass and rate of contractile protein synthesis in boys with Duchenne muscular dystrophy.J Physiol. 2021 Dec;599(23):5215-5227. doi: 10.1113/JP282227. Epub 2021 Oct 11. J Physiol. 2021. PMID: 34569076
-
Human muscle protein turnover--why is it so variable?J Appl Physiol (1985). 2011 Feb;110(2):480-91. doi: 10.1152/japplphysiol.00125.2010. Epub 2010 Nov 25. J Appl Physiol (1985). 2011. PMID: 21109595 Free PMC article. Review.
Cited by
-
Tracing metabolic flux to assess optimal dietary protein and amino acid consumption.Exp Mol Med. 2022 Sep;54(9):1323-1331. doi: 10.1038/s12276-022-00817-w. Epub 2022 Sep 8. Exp Mol Med. 2022. PMID: 36075948 Free PMC article. Review.
-
Understanding Muscle Protein Dynamics: Technical Considerations for Advancing Sarcopenia Research.Ann Geriatr Med Res. 2020 Sep;24(3):157-165. doi: 10.4235/agmr.20.0041. Epub 2020 Aug 4. Ann Geriatr Med Res. 2020. PMID: 32752586 Free PMC article.
-
Plasma Proteomics Study Between the Frequent Exacerbation and Infrequent Exacerbation Phenotypes of Chronic Obstructive Pulmonary Disease.Int J Chron Obstruct Pulmon Dis. 2023 Aug 9;18:1713-1728. doi: 10.2147/COPD.S408361. eCollection 2023. Int J Chron Obstruct Pulmon Dis. 2023. PMID: 37581107 Free PMC article.
-
Metabolomic and proteomic applications to exercise biomedicine.Transl Exerc Biomed. 2024 Mar 21;1(1):9-22. doi: 10.1515/teb-2024-2006. eCollection 2024 May. Transl Exerc Biomed. 2024. PMID: 38660119 Free PMC article. Review.
-
In Vivo and In Vitro Quantification of Glucose Kinetics: From Bedside to Bench.Endocrinol Metab (Seoul). 2020 Dec;35(4):733-749. doi: 10.3803/EnM.2020.406. Epub 2020 Dec 23. Endocrinol Metab (Seoul). 2020. PMID: 33397035 Free PMC article. Review.
References
-
- Hairi NN, et al. Loss of muscle strength, mass (sarcopenia), and quality (specific force) and its relationship with functional limitation and physical disability: the Concord Health and Ageing in Men Project. J Am Geriatr Soc. 2010;58(11):2055–2062. doi: 10.1111/j.1532-5415.2010.03145.x. - DOI - PubMed
Publication types
MeSH terms
Substances
Grants and funding
LinkOut - more resources
Full Text Sources
Research Materials
Miscellaneous
