
Memory T cell-driven differentiation of naive cells impairs adoptive immunotherapy

Christopher A Klebanoff et al. J Clin Invest. 2016 Jan.

Abstract

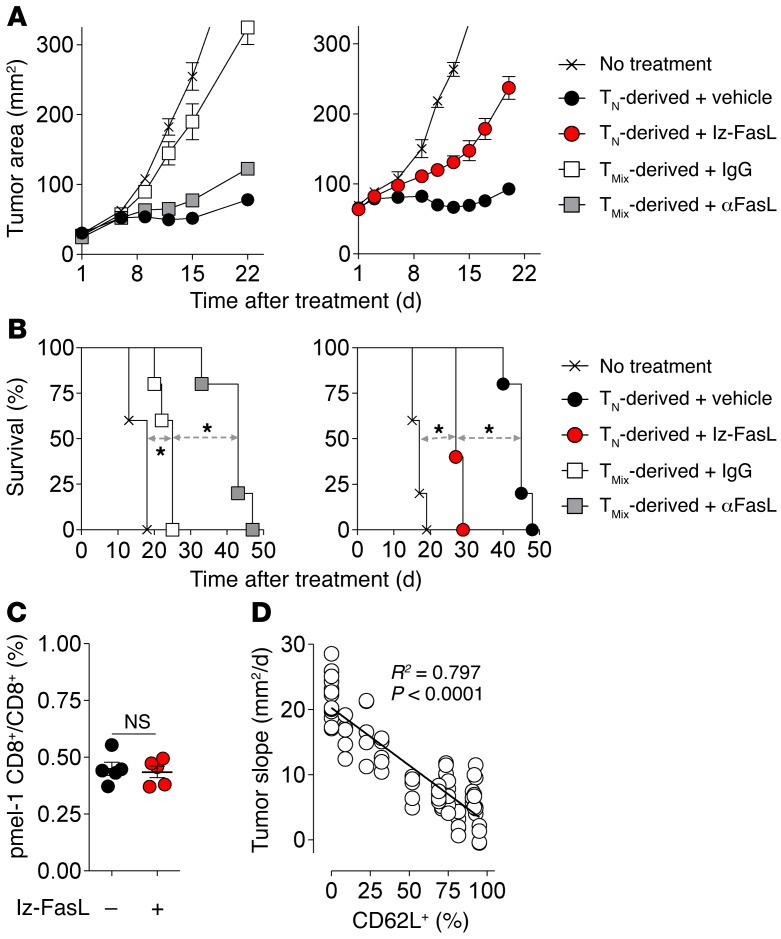
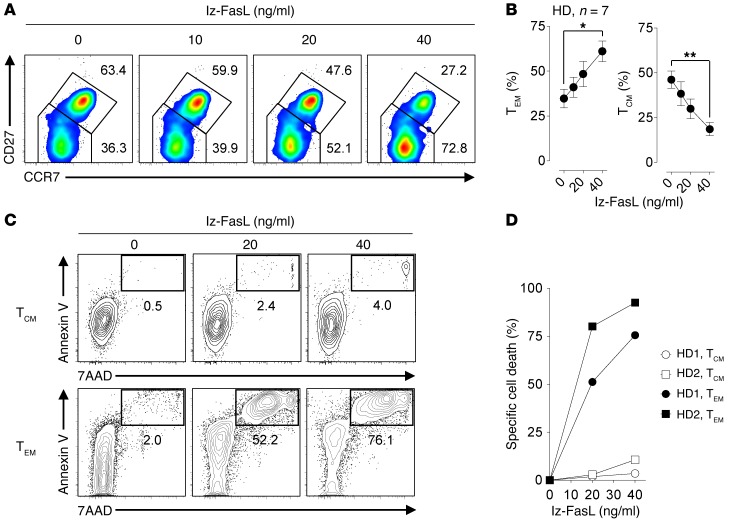
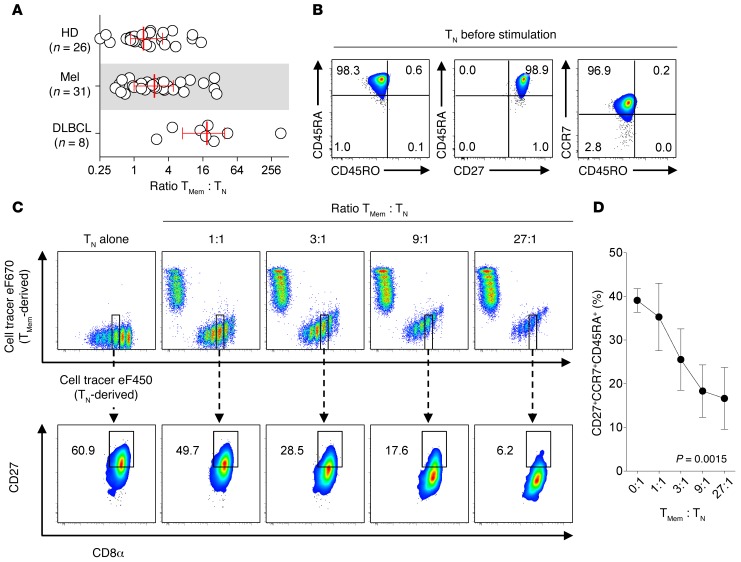
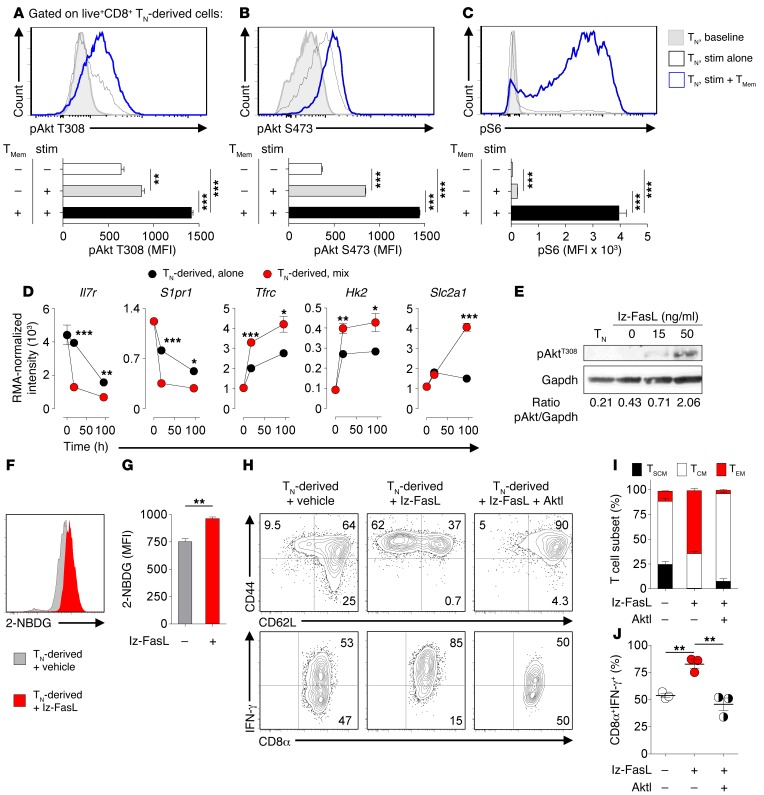
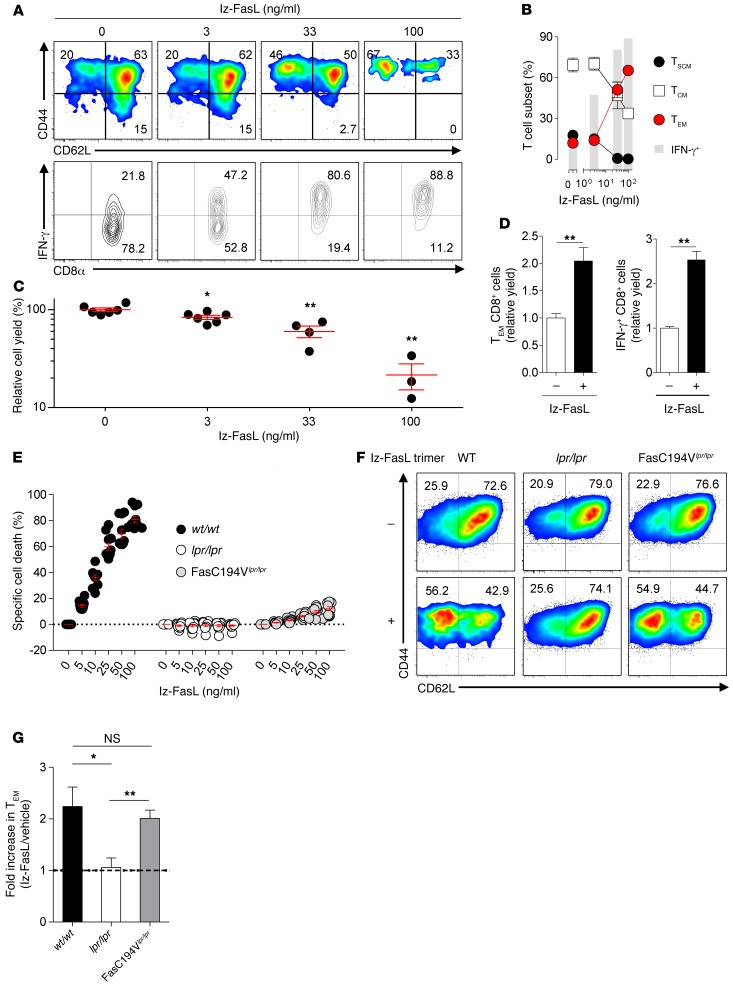
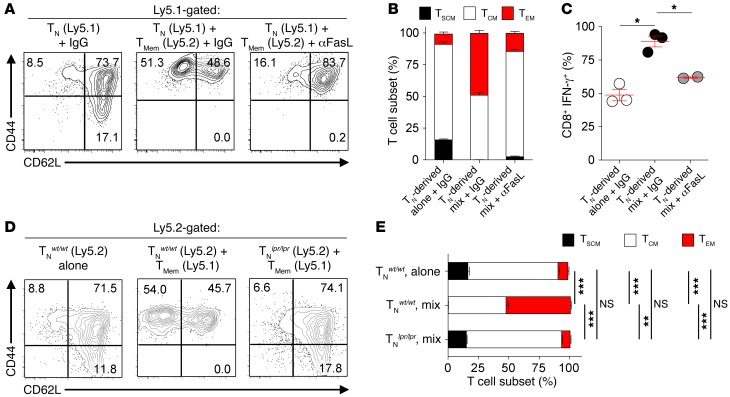
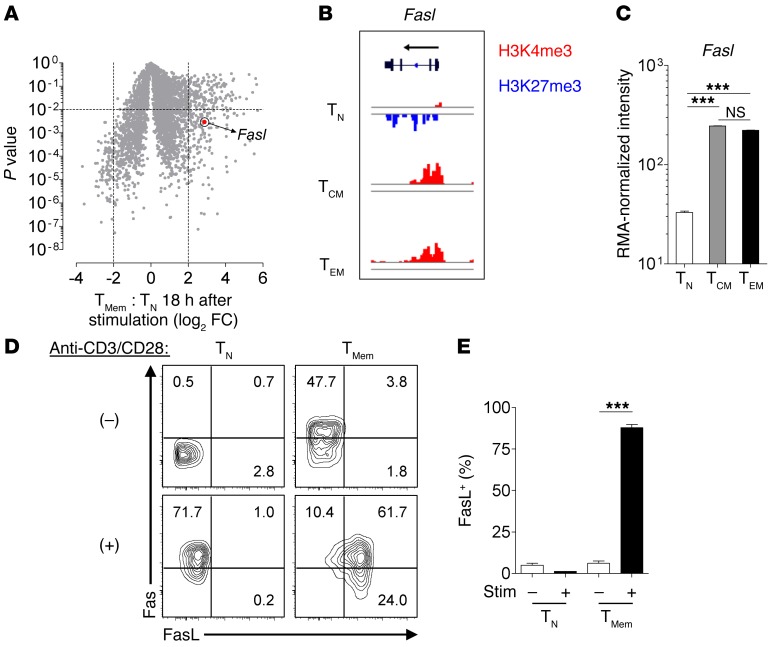
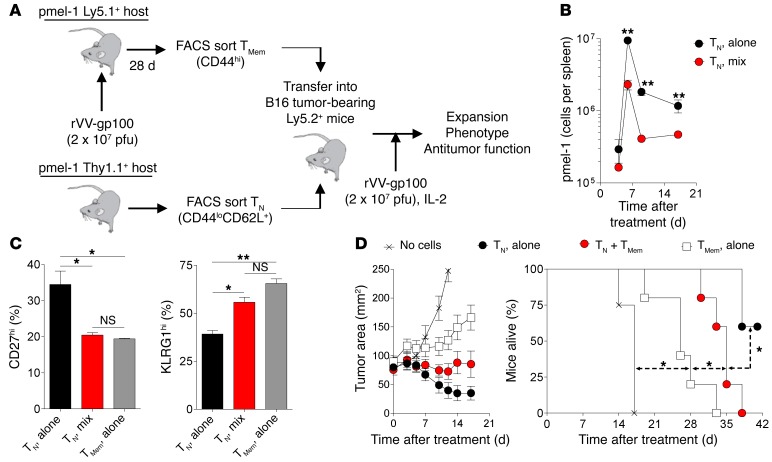
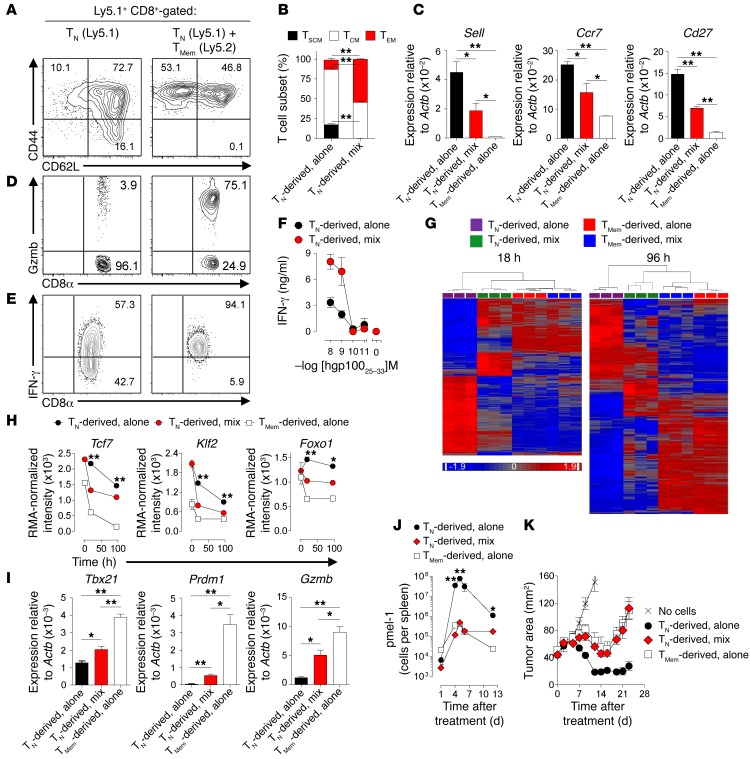
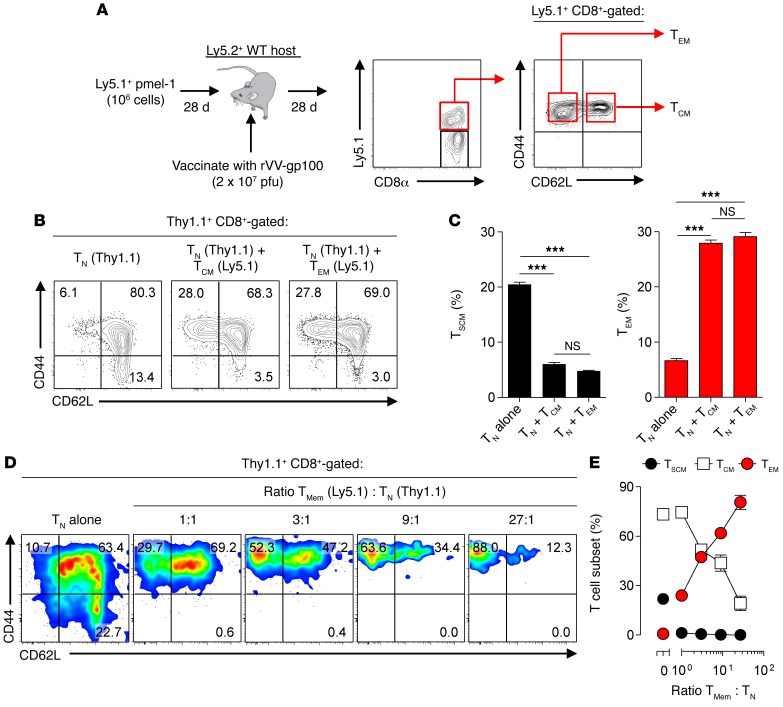
Adoptive cell transfer (ACT) of purified naive, stem cell memory, and central memory T cell subsets results in superior persistence and antitumor immunity compared with ACT of populations containing more-differentiated effector memory and effector T cells. Despite a clear advantage of the less-differentiated populations, the majority of ACT trials utilize unfractionated T cell subsets. Here, we have challenged the notion that the mere presence of less-differentiated T cells in starting populations used to generate therapeutic T cells is sufficient to convey their desirable attributes. Using both mouse and human cells, we identified a T cell-T cell interaction whereby antigen-experienced subsets directly promote the phenotypic, functional, and metabolic differentiation of naive T cells. This process led to the loss of less-differentiated T cell subsets and resulted in impaired cellular persistence and tumor regression in mouse models following ACT. The T memory-induced conversion of naive T cells was mediated by a nonapoptotic Fas signal, resulting in Akt-driven cellular differentiation. Thus, induction of Fas signaling enhanced T cell differentiation and impaired antitumor immunity, while Fas signaling blockade preserved the antitumor efficacy of naive cells within mixed populations. These findings reveal that T cell subsets can synchronize their differentiation state in a process similar to quorum sensing in unicellular organisms and suggest that disruption of this quorum-like behavior among T cells has potential to enhance T cell-based immunotherapies.


Figures

Figure 10
Figure 10. Fas signaling controls T cell differentiation and influences adoptive immunotherapy efficacy.
(A) Tumor regression and (B) animal survival of mice bearing 10-day established s.c. B16 melanomas treated with 2.5 × 10⁵ TN-derived pmel-1 cells primed alone, with lz-FasL (50 ng/ml), or with TMem in the presence of αFasL or IgG control. Viable cells were isolated using a density separation media before infusion. All treated mice received 6 Gy irradiation prior to cell infusion in addition to i.v. rVV-gp100 and 3 days of i.p. IL-2. Tumor treatment experiments performed with n = 5 mice/group. TMix, TN cells primed with TMem cells in a 1:1 mixture. (C) Engraftment efficiency of Thy1.1+ TN-derived pmel-1 cells (3 × 10⁵) primed alone or with lz-FasL 18 hours following i.v. adoptive transfer into nonirradiated Ly5.2+ hosts; n = 5 mice/group. (D) Correlation between the slope of tumor growth and CD62L expression at the time of cell transfer on TN-derived pmel-1 cells primed alone with either lz-FasL (50 ng/ml), vehicle control, or with TMem and either αFasL or IgG. Pooled results from 2 independently performed experiments displayed using n = 4–10 mice per condition. Statistical comparisons performed using an unpaired 2-tailed Student’s t test or log-rank test for animal survival. *P < 0.05. Data shown are representative of 2 independent experiments with results displayed as mean ± SEM.
Figure 9
Figure 9. Fas signaling promotes the differentiation of human CD8+ T cells.
(A) Representative FACS plots and (B) summary graph showing the distribution of CD8+ T cell subsets 7 to 10 days after peripheral blood CD8+ T cells from HD were stimulated with CD3/CD28-specific antibodies, IL-2, and indicated concentrations of lz-FasL. Results shown after gating on viable CD8+ lymphocytes from n = 7 HD. TCM = CD8+CD45RO+CCR7+CD27+, TEM = CD8+CD45RO+CCR7CD27. (C) Representative FACS plots and (D) summary graph displaying the induction of lz-FasL specific cell death after gating on TCM and TEM cells stimulated with indicated concentrations of lz-FasL for 12 hours. Cells that coordinately stained for 7-AAD and annexin V were considered apoptotic. Statistical comparisons performed using an unpaired 2-tailed Student’s t test corrected for multiple comparisons by a Bonferroni adjustment. *P < 0.05; **P < 0.01. Data shown are representative of 7 (A and B) and 2 (C and D) independently performed experiments with results displayed as mean ± SEM.
Figure 8
Figure 8. Human TMem cells induce precocious differentiation of TN-derived cells.
(A) Ratio of memory (CD3+CD8+CD45RO+) to naive (CD3+CD8+CD45ROCD45RA+CCR7+) CD8+ T cells in the peripheral circulation of HDs (n = 26), Mel patients (n = 31), or DLBCL patients (n = 8). Results shown as the median ± interquartile range. (B) Representative FACS plots demonstrating the surface phenotype of isolated TN cells after membrane labeling with cell tracer eF450 but before stimulation. (C) Representative FACS plots demonstrating the gating strategy used to assess the division-normalized phenotype of human TN-derived progeny 4 days following activation alone or in the presence of titrated ratios with TMem cells. Naive and TMem cells were labeled with cell tracer eF450 or eF670, respectively, and stimulated at indicated ratios using CD3/CD28-specific antibodies and IL-2. Naive-derived cells were subsequently analyzed for the coordinate expression of CD27, CCR7, and CD45RA using Boolean gating after gating on TN cells that had diluted an equivalent amount of the cell tracer eF450 dye. (D) Summary graph demonstrating the frequency of TN cells that coordinately express the markers CD27+CCR7+CD45RA+ after undergoing a normalized number of cell divisions plotted as a function of the ratio of TMem to TN cells. Results shown as mean ± SEM for each condition for n = 3 independently evaluated donors. P = 0.0015 (repeated measures 1-way ANOVA).
Figure 7
Figure 7. Precocious differentiation is associated with augmented Akt signaling.
Representative FACS histograms and summary bar graphs demonstrating the mean fluorescence intensity of (A) pAkt T308, (B) pAkt S473, and (C) pS6 in Ly5.2+CD8+ TN cells at rest or 24 hours after stimulation with CD3/CD28-specific antibodies alone or in a 1:1 mixture with Ly5.1+ TMem cells. Data shown after gating on live+Ly5.2+CD8+ cells. (D) RMA-normalized intensity showing expression of Il7ra, S1pr1, Tfrc, Hk2, and Slc2a1 in resting TN cells, TN cells primed alone, and TN cells primed in a 1:1 mixture with TMem cells. (E) Western blot and densitometry analysis of pAkt T308 and GAPDH in resting TN or TN cells primed for 24 hours with CD3/CD28-specific antibodies and titrated doses of lz-FasL. (F) Representative FACS plot and (G) summary scatter plot showing 2-NBDG expression in TN cells primed alone for 6 days with CD3/CD28-specific antibodies, IL-2, and lz-FasL (50 ng/ml) or vehicle control. Data shown after gating on live+CD8+ lymphocytes. (H) Representative FACS plots, (I) summary bar graph demonstrating the frequency of CD8+ T cell subsets, and (J) scatter plots showing IFN-γ production in TN cells primed with CD3/CD28-specific antibodies, IL-2, and lz-FasL (50 ng/ml) in the presence or absence of an inhibitor of Akt1/2 (AktI) for 6 days. Statistical comparisons performed using an unpaired 2-tailed Student’s t test corrected for multiple comparisons by a Bonferroni adjustment. *P < 0.05; **P < 0.01; ***P < 0.001. All data shown are displayed as mean ± SEM. Experiments performed with n = 3 per condition/time point in AD and FJ. All data shown are representative of 2 independently conducted experiments.
Figure 6
Figure 6. Precocious differentiation is mediated by nonapoptotic Fas signaling.
(A) Representative FACS plots and (B) bar graph summarizing the distribution of T cell subsets and IFN-γ production in isolated TN cells primed with CD3/CD28-specific antibodies, IL-2, and indicated doses of lz-FasL for 6 days prior to analysis. Data shown are based on n = 3 independently maintained cultures/condition. (C) Relative overall cell yield and (D) relative cell yield of TEM or IFN-γ+ cells, normalized to no lz-FasL treatment, of TN-derived cells grown in the presence of titrated amounts of lz-FasL (C) or 33 ng/ml lz-FasL (D); data shown in C and D are based on n = 3–6 and n = 3 independently maintained cultures/condition, respectively. (E) Specific cell death of activated CD8+ T cells derived from WT (WT/WT), Lpr (lpr/lpr), and FasC194Vlpr/lpr mice following exposure to titrated amounts of lz-FasL or a vehicle control; n = 11 per condition/cell type. (F) Representative FACS plots demonstrating the frequency of TN-derived cell subsets and (G) bar graph demonstrating fold increase in TEM phenotype cells after WT/WT, lpr/lpr, or FasC194Vlpr/lpr CD8+ T cells were expanded with CD3/CD28-specific antibodies and IL-2 alone or with 40 ng/ml of lz-FasL for 6 days; n = 6–9 independently maintained cultures/cell type. Statistical comparisons performed using an unpaired 2-tailed Student’s t test corrected for multiple comparisons by a Bonferroni adjustment. *P < 0.05; **P < 0.01. Results are representative of 6 (A), 2 (CE), and 4 (F and G) independently performed experiments and are displayed as mean ± SEM.
Figure 5
Figure 5. FasL-Fas interactions mediate precocious differentiation.
(A) Representative FACS plots, (B) summary bar graph, and (C) scatter plot demonstrating T cell subset frequencies or percentage of IFN-γ+CD8+ T cells 6 days following priming of Ly5.1+ TN alone or in a 1:1 mixture with Ly5.2+ TMem with CD3/CD28-specific antibodies, IL-2, and a blocking antibody against FasL (αFasL) or isotype (IgG) control. (D) FACS analysis and (E) bar graph summarizing the distribution of CD8+ T cell subsets 6 days following priming of Ly5.2+ WT TN pmel-1 (TNWT/WT) or lpr/lpr TN pmel-1 (TNlpr/lpr) cells alone or in the presence of a 1:1 mixture with WT Ly5.1+ TMem. All results shown as mean ± SEM with n = 2–3 per indicated condition or cell type. Statistical comparisons performed using an unpaired 2-tailed Student’s t test corrected for multiple comparisons by a Bonferroni adjustment. *P < 0.05; **P < 0.01; ***P < 0.001. Data shown are representative of 14 (A and B), 4 (C), and 3 (D and E) independently performed experiments.
Figure 4
Figure 4. FasL is poised for rapid surface expression in TMem cell subsets but not TN cells.
(A) Volcano plot indicating differentially expressed genes in TMem cells versus TN cells 18 hours after stimulation with CD3/CD28-specific antibodies and IL-2. Dashed lines, P < 0.01 and FC > 2. (B) Pattern of activating H3K4me3 and repressive H3K27me3 epigenetic marks within the promoter and gene body of Fasl and (C) RMA-normalized expression intensity of Fasl in resting FACS-sorted TN, TCM, and TEM cell subsets. (D and E) Fas and FasL surface expression on TN and TMem cells at rest or 18 hours after stimulation with CD3/CD28-specific antibodies. All bar graphs shown as mean ± SEM with n = 3 per indicated cell type or condition. Statistical comparisons performed using an unpaired 2-tailed Student’s t test corrected for multiple comparisons by a Bonferroni adjustment. ***P < 0.001. Data shown in CE are representative of 2 independently performed experiments.
Figure 3
Figure 3. TMem cells cause precocious differentiation of TN cells in vivo.
(A) Experimental schema showing the generation, isolation, and transfer of Thy1.1+ pmel-1 TN cells (CD44loCD62L+) alone or in combination with FACS-sorted, vaccine-induced Ly5.1+ pmel-1 TMem cells (CD44hi) into Ly5.2+ hosts. (B) In vivo expansion and persistence of 1 × 10⁵ adoptively transferred Thy1.1+ TN cells injected alone or in combination with 3 × 10⁵ Ly5.1+ TMem cells into Ly5.2+ WT mice bearing 10-day established B16 melanomas. (C) FACS analysis on day 17 of CD27 and KLRG1 expression on CD8+Thy1.1+ TN-derived or CD8+Ly5.1+ TMem-derived cells. (D) Tumor regression and survival of mice bearing 10-day established B16 melanoma tumors who received 1 × 10⁵ TN cells alone, in combination with 3 × 10⁵ TMem cells, or 3 × 10⁵ TMem cells alone. All treated mice received 6 Gy irradiation, i.v. rVV-gp100, and 3 days of i.p. IL-2. n = 3 mice/group/time point (B and C) or n = 5 mice per group (D). Results are displayed as mean ± SEM with statistical comparisons performed using an unpaired 2-tailed Student’s t test corrected for multiple comparisons by a Bonferroni adjustment or log-rank test for animal survival. *P < 0.05; **P < 0.01. Data shown are representative of 2 independently performed experiments.
Figure 2
Figure 2. TMem cause precocious differentiation of naive cells.
(A) Representative FACS and (B) bar graph summarizing the distribution of Ly5.1+CD8+ TN-derived cell subsets 6 days following priming with CD3/CD28-specific antibodies and IL-2 alone or with Ly5.2+CD8+ TMem cells. Data shown after gating on Ly5.1+CD8+cells. (C) qPCR analysis of Sell, Ccr7, and Cd27 expression in FACS-sorted reisolated TN cells primed alone, TN cells primed with TMem cells, or TMem cells primed alone. (D) Granzyme B and (E) IFN-γ intracellular staining in TN-derived cells stimulated with PMA/ionomycin following expansion alone or with TMem cells. (F) IFN-γ ELISA of supernatants from reisolated TN-derived cells expanded alone or with TMem cells 6 days prior to overnight stimulation with hgp10025–33 peptide. (G) Heat maps of differentially expressed genes (1-way ANOVA, pFDR < 5%) among TN-derived cells expanded alone or with TMem cells at 18 and 96 hours. (H) RMA-normalized intensity of selected TN-associated genes. (I) Expression of effector cell–associated factors assessed by qPCR at 96 hours from FACS reisolated TN-derived progeny expanded with or without TMem cells or TMem cells expanded alone. (J) In vivo expansion and (K) tumor regression following i.v. adoptive transfer of TN-derived progeny expanded alone or with TMem cells, or TMem cells grown alone in combination with 6 Gy irradiation, i.v. rVV-hgp100, and 3 days of i.p. IL-2. n = 3 independently maintained cultures/condition or time point for experiments shown in B, C, and FI. K was performed with n = 5 mice per group. All results shown as mean ± SEM. Statistical comparisons performed using an unpaired 2-tailed Student’s t test corrected for multiple comparisons by Bonferroni adjustment. *P < 0.05; **P < 0.01. Data are representative of 16 (A and B), 3 (D and E), and 2 (C, F, and IK) independent experiments.
Figure 1
Figure 1. TMem cells augment naive cell phenotypic maturation during priming.
(A) Experimental design and representative FACS plot showing the generation and isolation of vaccine-induced pmel-1 Ly5.1+CD8+ TCM (CD44+CD62L+) and TEM (CD44+CD62L) cell subsets by adoptive transfer of pmel-1 cells (106) into Ly5.2+ WT hosts followed by rVV-gp100 vaccination (2 × 10⁷ pfu). (B) Representative FACS plots and (C) summary bar graphs demonstrating the distribution of Thy1.1+ TN-derived TSCM (CD44loCD62L+Sca1+CD122+) and TEM cell subsets 6 days following ex vivo expansion alone or in the presence of a 1:1 mixture with Ly5.2+ TCM or TEM cells using CD3/CD28-specific antibodies and IL-2. (D) Representative FACS plots and (E) summary graph demonstrating the distribution of Thy1.1+ TN-derived subsets 6 days following ex vivo expansion alone or in the presence of titrated ratios with Ly5.1+ bulk (CD44+) TMem cells using CD3/CD28-specific antibodies and IL-2. Results in AE are shown after gating on live+CD8+Thy1.1+ lymphocytes and are representative of 2 independently performed experiments. Results in C and E are presented as mean ± SEM with n = 3 per condition. Statistical comparisons performed using an unpaired 2-tailed Student’s t test corrected for multiple comparisons by a Bonferroni adjustment. ***P < 0.001.

Comment in

Similar articles

Cited by

References

    1. Maus MV, Fraietta JA, Levine BL, Kalos M, Zhao Y, June CH. Adoptive immunotherapy for cancer or viruses. Annu Rev Immunol. 2014;32:189–225. doi: 10.1146/annurev-immunol-032713-120136. - DOI - PMC - PubMed
    1. Jensen MC, Riddell SR. Design and implementation of adoptive therapy with chimeric antigen receptor-modified T cells. Immunol Rev. 2014;257(1):127–144. doi: 10.1111/imr.12139. - DOI - PMC - PubMed
    1. Rosenberg SA, Restifo NP. Adoptive cell transfer as personalized immunotherapy for human cancer. Science. 2015;348(6230):62–68. doi: 10.1126/science.aaa4967. - DOI - PMC - PubMed
    1. Sadelain M. T-cell engineering for cancer immunotherapy. Cancer J. 2009;15(6):451–455. doi: 10.1097/PPO.0b013e3181c51f37. - DOI - PubMed
    1. Leen AM, Heslop HE, Brenner MK. Antiviral T-cell therapy. Immunol Rev. 2014;258(1):12–29. doi: 10.1111/imr.12138. - DOI - PMC - PubMed

Publication types