
CDK4 is an essential insulin effector in adipocytes

Sylviane Lagarrigue et al. J Clin Invest. 2016 Jan.

Erratum in

  • CDK4 is an essential insulin effector in adipocytes.
    Lagarrigue S, Lopez-Mejia IC, Denechaud PD, Escoté X, Castillo-Armengol J, Jimenez V, Chavey C, Giralt A, Lai Q, Zhang L, Martinez-Carreres L, Delacuisine B, Annicotte JS, Blanchet E, Huré S, Abella A, Tinahones FJ, Vendrell J, Dubus P, Bosch F, Kahn CR, Fajas L. Lagarrigue S, et al. J Clin Invest. 2022 Jul 1;132(13):e162359. doi: 10.1172/JCI162359. J Clin Invest. 2022. PMID: 35775487 Free PMC article. No abstract available.

Retraction in

  • CDK4 is an essential insulin effector in adipocytes.
    Lagarrigue S, Lopez-Mejia IC, Denechaud PD, Escoté X, Castillo-Armengol J, Jimenez V, Chavey C, Giralt A, Lai Q, Zhang L, Martinez-Carreres L, Delacuisine B, Annicotte JS, Blanchet E, Huré S, Abella A, Tinahones FJ, Vendrell J, Dubus P, Bosch F, Kahn CR, Fajas L. Lagarrigue S, et al. J Clin Invest. 2023 Mar 15;133(6):e170315. doi: 10.1172/JCI170315. J Clin Invest. 2023. PMID: 36919703 Free PMC article. No abstract available.

Abstract

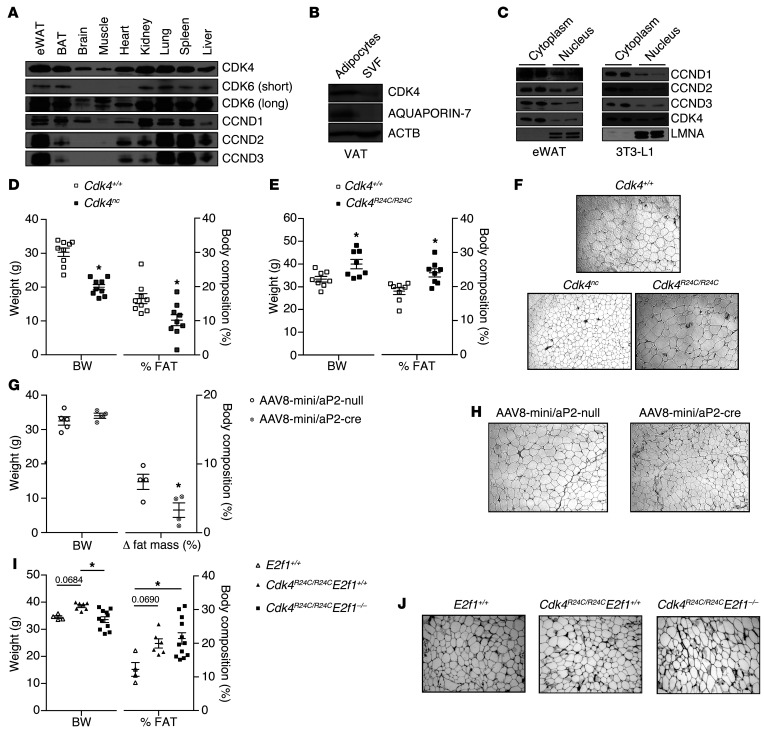
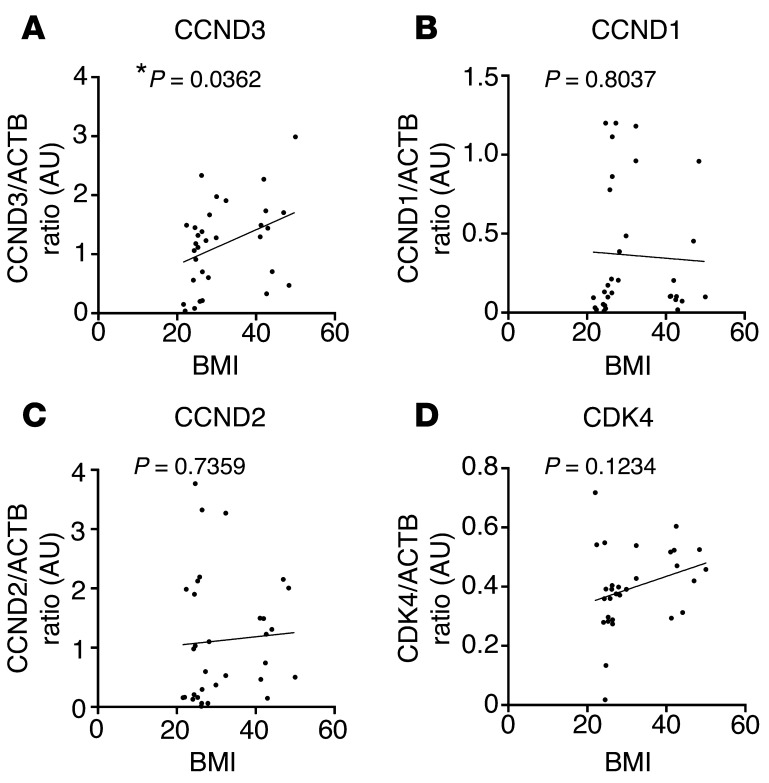
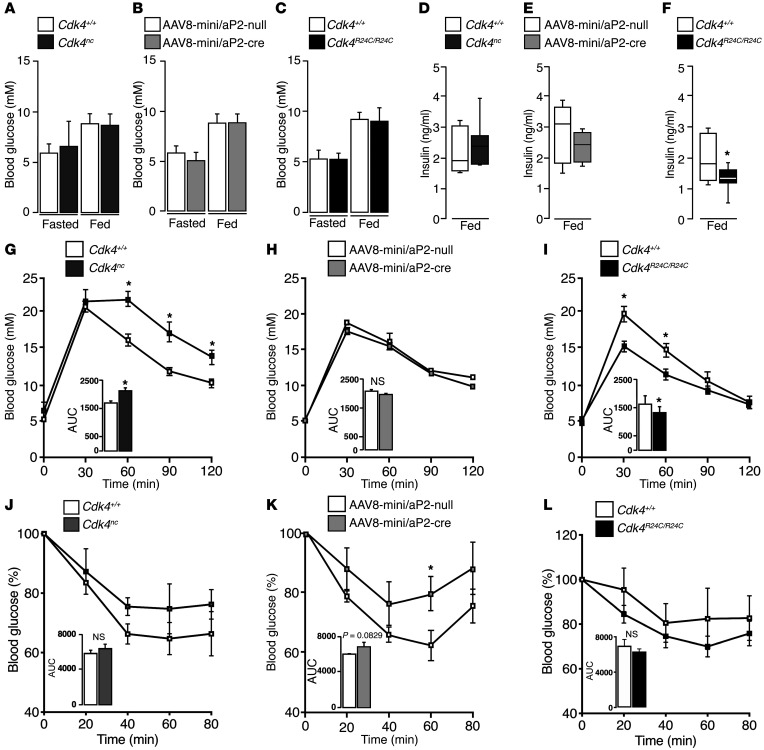
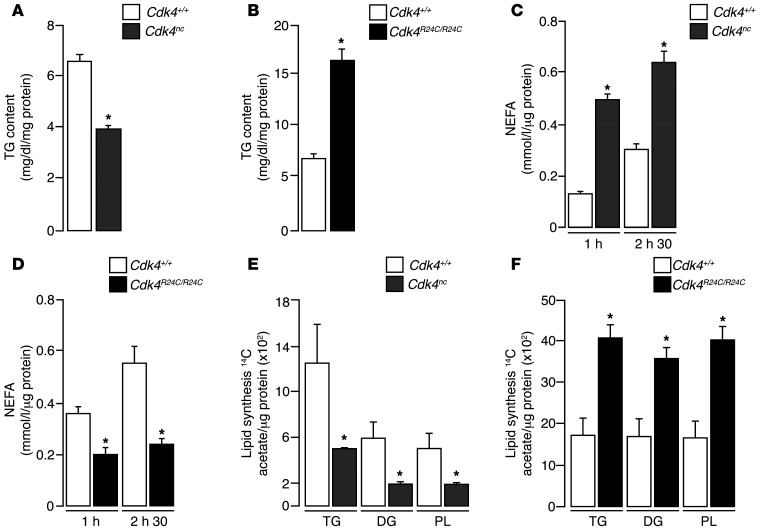
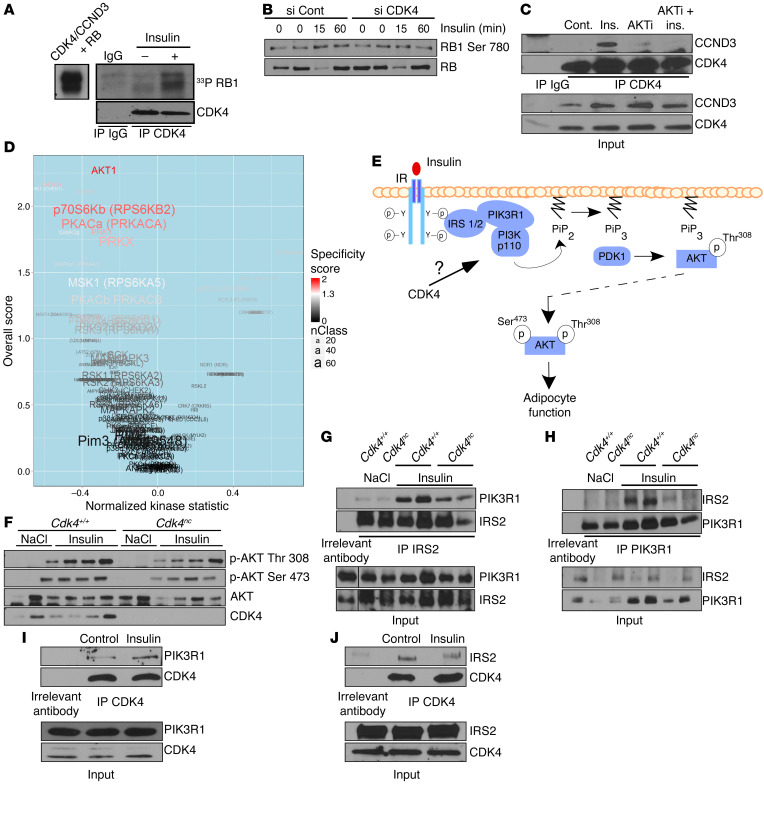
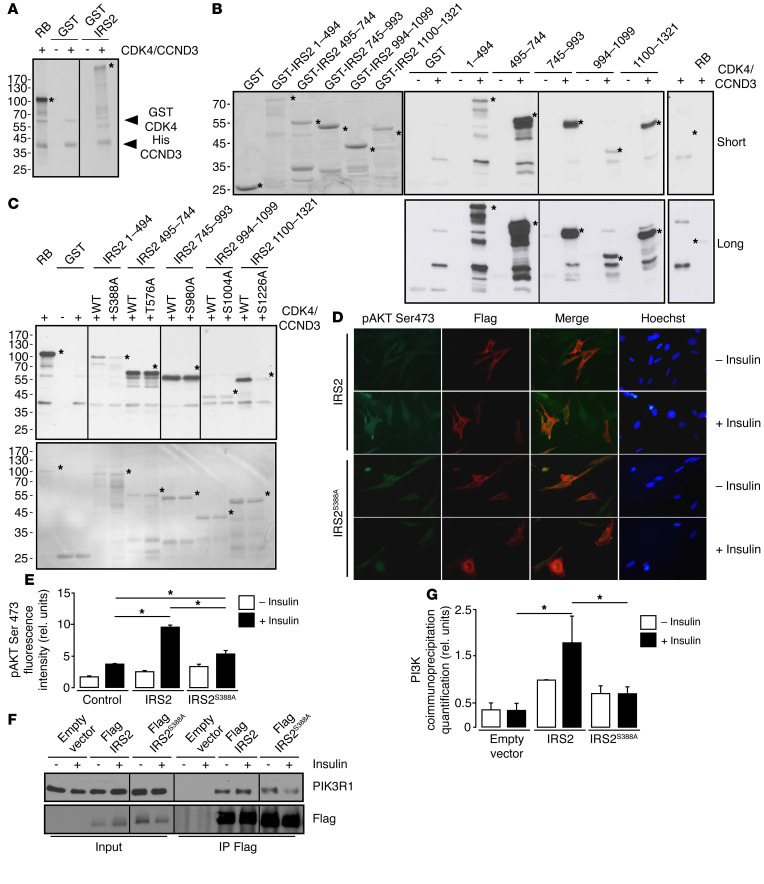
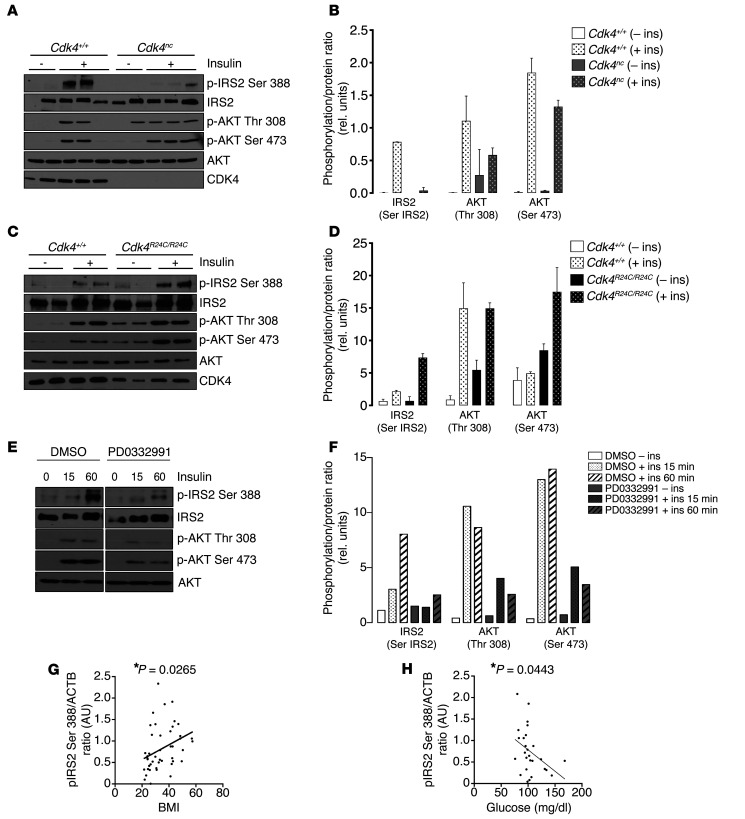
Insulin resistance is a fundamental pathogenic factor that characterizes various metabolic disorders, including obesity and type 2 diabetes. Adipose tissue contributes to the development of obesity-related insulin resistance through increased release of fatty acids, altered adipokine secretion, and/or macrophage infiltration and cytokine release. Here, we aimed to analyze the participation of the cyclin-dependent kinase 4 (CDK4) in adipose tissue biology. We determined that white adipose tissue (WAT) from CDK4-deficient mice exhibits impaired lipogenesis and increased lipolysis. Conversely, lipolysis was decreased and lipogenesis was increased in mice expressing a mutant hyperactive form of CDK4 (CDK4(R24C)). A global kinome analysis of CDK4-deficient mice following insulin stimulation revealed that insulin signaling is impaired in these animals. We determined that insulin activates the CCND3-CDK4 complex, which in turn phosphorylates insulin receptor substrate 2 (IRS2) at serine 388, thereby creating a positive feedback loop that maintains adipocyte insulin signaling. Furthermore, we found that CCND3 expression and IRS2 serine 388 phosphorylation are increased in human obese subjects. Together, our results demonstrate that CDK4 is a major regulator of insulin signaling in WAT.


Figures

Figure 1
Figure 1. Positive correlation between CDK4 activity and WAT mass.
(A) Expression levels of CCND1, CCND2, CCND3, CDK4, and CDK6 proteins in mouse eWAT, BAT, brain, muscle, heart, kidney, lung, spleen, and liver. Representative blot of several animals analyzed is shown. (B) CDK4 protein level in the SVF and mature adipocytes isolated from VAT. (C) Subcellular localization of CCND1, CCND2, CCND3, and CDK4 proteins in cytoplasm and nuclear fractions of eWAT and mature 3T3-L1 adipocytes. LMNA was used as a control for the nuclear fraction. (B and C) Representative blots out of 3 independent experiments are shown. (D and E) Body weight and percentage of fat mass of 20-week-old Cdk4+/+ and Cdk4nc mice (n = 9) (D) and 30-week-old Cdk4+/+ and Cdk4R24C/R24C mice (n = 8) (E) as obtained using EchoMRI technology. (F) H&E staining of eWAT sections from Cdk4+/+ (23 week old), Cdk4nc (29 week old), and Cdk4R24C/R24C (54 week old) mice. (G) Body weight, Δ to fat mass of 14- to 16-week-old Cdk4flox/flox mice infected with AAV8-mini/aP2-null (n = 5) or AAV8-mini/aP2-cre (n = 4) analyzed by EchoMRI technology (we show the difference between the percentage of fat before and the percentage of fat 3 weeks after infection). (H) H&E staining of eWAT sections from 16-to 18-week-old Cdk4flox/flox mice infected with AAV8-mini/aP2-null or AAV8-mini/aP2-cre. (I) Body weight and percentage of fat mass of 30-week-old E2f1+/+ (n = 4), Cdk4R24C/R24C E2f1+/+ (n = 6), and Cdk4R24C/R24C E2f1–/– mice (n = 12). (J) H&E staining of eWAT sections from 33-week-old E2f1+/+, Cdk4R24C/R24C E2f1+/+, and Cdk4R24C/R24C E2f1–/– mice. Statistically significant differences were determined with unpaired 2-tailed Student’s t tests (D, E, and G) or 1-way ANOVA followed by Tukey’s multiple comparisons test (I). *P < 0.05. Original magnification, ×100.
Figure 2
Figure 2. Positive correlation between CCND3 expression and human VAT mass.
(AD) Correlation between the CCND3/ACTB ratio (n = 32, Pearson’s r = 0.3717, P < 0.05) (A), the CCND1/ACTB ratio (n = 32, Pearson’s r = –0.04574, P < 0.05) (B), the CCND2/ACTB ratio (n = 32, Pearson’s r = 0.06203, P < 0.05) (C), and the CDK4/ACTB ratio (n = 30, Pearson’s r = 0.2875, P < 0.05) (D) and BMI in VAT of human subjects. Data are normalized to ACTB. *P < 0.05.
Figure 3
Figure 3. CDK4 promotes insulin sensitivity in vivo.
(AC) Fasting glycemia of 17- to 21-week-old Cdk4+/+ and Cdk4nc (n = 8) mice (A), 15- to 17-week-old Cdk4flox/flox mice infected with AAV8-mini/aP2-null (n = 5) or AAV8-mini/aP2-cre virus (n = 4) (B), and 33- to 36-week-old Cdk4+/+ and Cdk4R24C/R24C mice (n = 12) (C). (DF) Fed serum insulin of 21-week-old Cdk4+/+ and Cdk4nc mice (n = 7) (D), 15- to 17-week-old Cdk4flox/flox mice infected with AAV8-mini/aP2-null (n = 5) or AAV8-mini/aP2-cre virus (n = 4) (E), and 29- to 33-week-old Cdk4+/+ and Cdk4R24C/R24C mice (n = 8) (F). (GI) GTT of 20- to 23-week-old Cdk4+/+ and Cdk4nc mice (n = 7) (G), 15-to 17-week-old Cdk4flox/flox mice infected with AAV8-mini/aP2-null (n = 5) or AAV8-mini/aP2-cre (n = 4) (H), and 36-week-old Cdk4+/+ and Cdk4R24C/R24C mice (n = 6) (I). (JL) ITT of 24-week-old Cdk4+/+ and Cdk4nc mice (n = 5) (J), 14- to 16-week-old Cdk4flox/flox mice infected with AAV8-mini/aP2-null (n = 5) or AAV8-mini/aP2-cre virus (n = 4) (K), and 30-week-old Cdk4+/+ and Cdk4R24C/R24C mice (n = 5–11) (L). AUC for GTT and ITT was analyzed and is shown below the curves. Data were expressed as mean ± SEM. Statistically significant differences were determined with unpaired 2-tailed Student’s t tests. *P < 0.05.
Figure 4
Figure 4. CDK4 represses lipolysis and is a positive modulator of lipogenesis.
(A) Quantification of triglyceride content of eWAT from 23-week-old Cdk4+/+ and Cdk4nc mice (n = 3). (B) Quantification of triglyceride content of eWAT from 27-week-old Cdk4+/+ and Cdk4R24C/R24C mice (n = 3). (C) Rate of NEFA release in eWAT explants from 23-week-old fasting Cdk4+/+ and Cdk4nc mice (n = 3). (D) Rate of NEFA release in eWAT explants from 28-week-old fasting Cdk4+/+ and Cdk4R24C/R24C mice (n = 6). (E) Ex vivo lipogenesis experiments in eWAT explants using labeled 14C acetate incorporation to detect TG, DG, and PL synthesis of 22-week-old Cdk4+/+ and Cdk4nc mice (n = 3). (F) Ex vivo lipogenesis experiments in eWAT explants of 27-week-old Cdk4+/+ and Cdk4R24C/R24C mice. 14C-acetate incorporation was used to detect TG, DG, and PL synthesis by TLC (n = 3). Data are expressed as mean ± SEM. Statistically significant differences were determined with unpaired 2-tailed Student’s t tests. *P < 0.05.
Figure 5
Figure 5. CDK4 is activated by insulin and translates insulin signaling in adipocytes.
(A) CDK4 activity in vivo. SDS-PAGE autoradiography showing RB1 phosphorylation by CDK4 immunoprecipitated from 3T3-L1 mature adipocytes after insulin stimulation. The left panel shows RB1 phosphorylation by recombinant CDK4 used as a positive control. (B) Western blot analysis showing the inhibition of insulin-induced RB1 phosphorylation on Ser780 by CDK4 knockdown in mature 3T3-L1 adipocytes. (C) CCND3 and CDK4 association is increased upon insulin stimulation, but decreased upon cotreatment with insulin and AKT inhibitor in mature 3T3-L1 adipocytes. (D) Volcano plot showing differences in putative kinase activities between 22-week-old control and Cdk4nc mice injected (portal vein) with insulin for 3 minutes (n = 4). Kinases with a positive kinase statistic show higher activity in Cdk4nc samples compared with control samples, whereas kinases with negative kinase statistic show lower activity in Cdk4nc samples compared with control samples. (E) Based on the upstream kinase activity (D) results and on the GeneGO analysis of the PamGene experiment, the putative role of CDK4 upstream of AKT in the insulin signaling pathway is represented. (F) Immunoblot showing AKT phosphorylation on Thr308 and Ser473 in response to insulin injection (3 minutes) in 22-week-old fasted control and Cdk4nc mice (n = 2 for NaCl and n = 4 for insulin treatment). (G and H) Coimmunoprecipitation experiments showing the interaction between endogenous IRS2 and PIK3R1. IRS2 (G) and PI3Kp85A (H) were immunoprecipitated and the presence of PI3K p85A (G) and IRS2 (H) was detected by Western blot analysis from 23-week-old Cdk4+/+ and Cdk4nc mice treated with insulin for 3 minutes. (n = 2 for NaCl and n = 3 for insulin treatment). (I and J) Coimmunoprecipitation experiments showing the interaction between endogenous PIK3R1 or IRS2 and CDK4. CDK4 was immunoprecipitated and the presence of PIK3R1 (n = 3) (I) and IRS2 (n = 1) (J) was detected by Western blot analysis in 3T3-L1 mature adipocytes treated with insulin. A representative Western blot is shown. Unless specified otherwise, all experiments are representative of 3 independent experiments.
Figure 6
Figure 6. CDK4 phosphorylates IRS2.
(A) CCND3-CDK4 complex directly phosphorylates full-length GST-IRS2 in vitro (n = 3). (B) In vitro phosphorylation of GST-IRS2 fragments (1–494aa, 495–744aa, 745–993aa, 994–1099aa, 1100–1321aa) by CCND3/CDK4. Left panel, SDS-PAGE stained with Coomassie blue for the loading control. Middle panels, autoradiography of the SDS-PAGE gels containing the different GST-IRS2 fragments, incubated with CCND3/CDK4. Right panel, RB1 recombinant protein was used as a positive control (n = 3). (C) Defective IRS2S388A and IRS2S1226A phosphorylation by CCND3-CDK4. Upper panel, autoradiography; lower panel, SDS-PAGE gel stained with Coomassie blue for the loading control. (n = 2). (D) Decrease in pAKT Ser473 phosphorylation in Flag-IRS2S388A electroporated Irs2–/– cells upon insulin stimulation, compared with the WT Flag-IRS2–transfected cells (n = 3). Original magnification, ×400. (E) Quantification of pAKT Ser473 fluorescence intensity for untransfected, Flag-IRS2–transfected, and Flag-IRS IRS2S388A electroporated Irs2–/– preadipocytes was performed with ImageJ software (http://imagej.nih.gov/ij/). At least 100 cells were quantified per condition. (F) Representative Western blot analysis showing impaired interaction between PIK3R1 and Flag-IRS2S388A mutant after insulin stimulation compared with cells transfected with Flag-IRS2 in 293T cells. (G) Quantification of the blot shown in F. A representative Western blot is shown. Data are expressed as mean ± SEM. Statistically significant differences were determined with 2-way ANOVA followed by Tukey’s multiple comparisons test (EG). *P < 0.05.
Figure 7
Figure 7. CDK4 phosphorylates in vivo the IRS2 protein at the Ser388.
(AD) Immunoblot analysis of IRS2 phosphorylation on Ser388 and AKT phosphorylation on Thr308 and Ser473 of 27-week-old control and Cdk4nc mice (n = 2 starved/3 insulin for Cdk4+/+ and n = 2 starved/3 insulin for Cdk4nc) (A). (B) Quantification of the blot showed in A using ImageJ software. Please note that the mouse in lane 5 was not considered for analysis, since this control mouse was not responsive to insulin. CdkR24C/R24C (n = 2 starved/3 insulin for both Cdk4+/+ and CdkR24C/R24C) (40 weeks old). (C) Mice were treated for 50 minutes with insulin. (D) Quantification of the blot shown in C using ImageJ software. (E) Immunoblot analysis of IRS2 phosphorylation on Ser388 and AKT phosphorylation on Thr308 and Ser473 in 3T3-L1 mature adipocytes during a time course insulin stimulation with or without PD0332991 (n = 1). (F) Quantification of the blot shown in E using ImageJ software. (G) Correlation between the pIRS2 Ser388/ACTB ratio in VAT and the BMI of the subjects (n = 45, Pearson’s r = 0.3307, P < 0.05). (H) Correlation between the pIRS2 Ser388/ACTB ratio in VAT and the glycemia of the subjects (n = 27, Pearson’s r = –0.3900, P < 0.05). Data are expressed as mean ± SEM. Statistically significant differences were determined with 2-way ANOVA followed by Tukey’s multiple comparisons test (BD). *P < 0.05.

References

    1. Saltiel AR, Kahn CR. Insulin signalling and the regulation of glucose and lipid metabolism. Nature. 2001;414(6865):799–806. doi: 10.1038/414799a. - DOI - PubMed
    1. White MF. Insulin signaling in health and disease. Science. 2003;302(5651):1710–1711. doi: 10.1126/science.1092952. - DOI - PubMed
    1. Rask-Madsen C, Kahn CR. Tissue-specific insulin signaling, metabolic syndrome, and cardiovascular disease. Arterioscler Thromb Vasc Biol. 2012;32(9):2052–2059. doi: 10.1161/ATVBAHA.111.241919. - DOI - PMC - PubMed
    1. Vazquez-Vela ME, Torres N, Tovar AR. White adipose tissue as endocrine organ and its role in obesity. Arch Med Res. 2008;39(8):715–728. doi: 10.1016/j.arcmed.2008.09.005. - DOI - PubMed
    1. Koch L, et al. Central insulin action regulates peripheral glucose and fat metabolism in mice. J Clin Invest. 2008;118(6):2132–2147. - PMC - PubMed

Publication types