. 2015 Dec 10:6:10163.
doi: 10.1038/ncomms10163.

Presynaptic hyperpolarization induces a fast analogue modulation of spike-evoked transmission mediated by axonal sodium channels

Affiliations

Presynaptic hyperpolarization induces a fast analogue modulation of spike-evoked transmission mediated by axonal sodium channels

Sylvain Rama et al. Nat Commun. .

Abstract

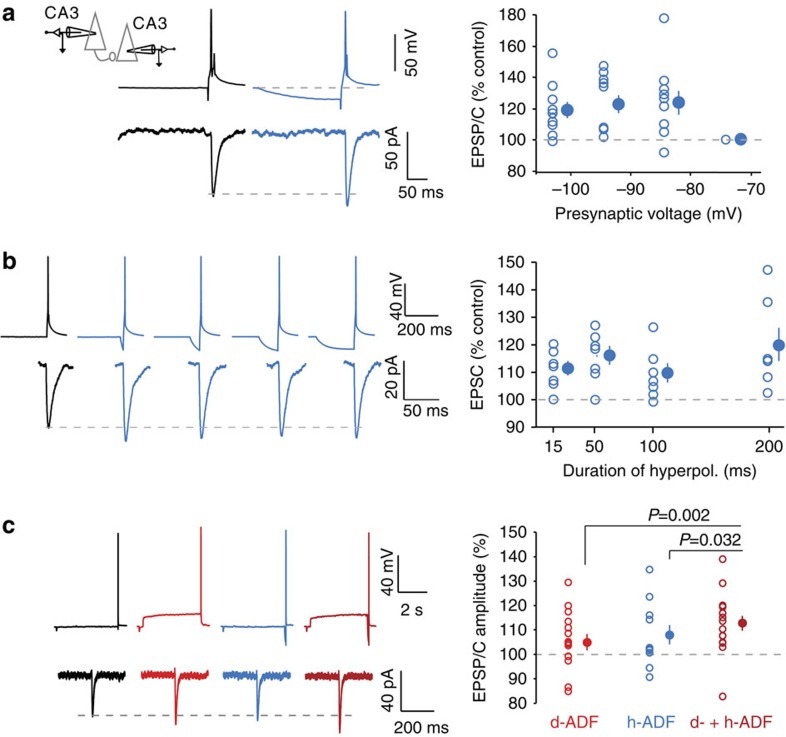
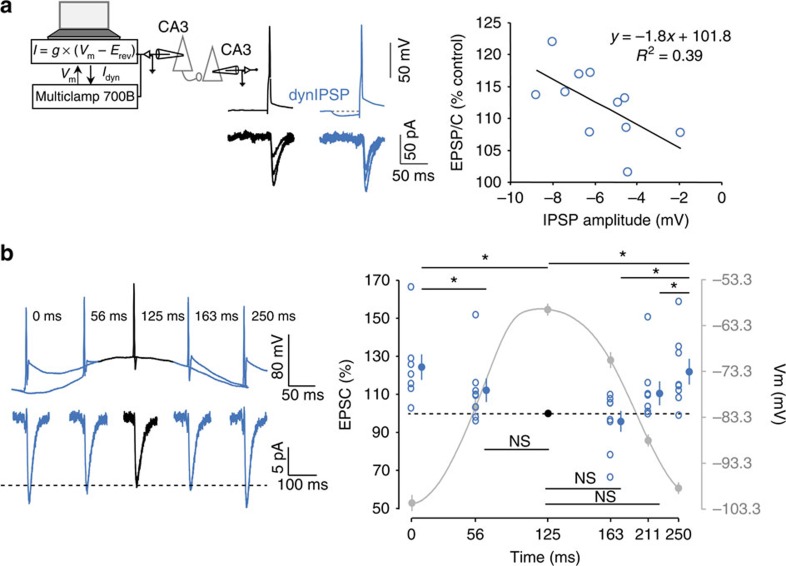
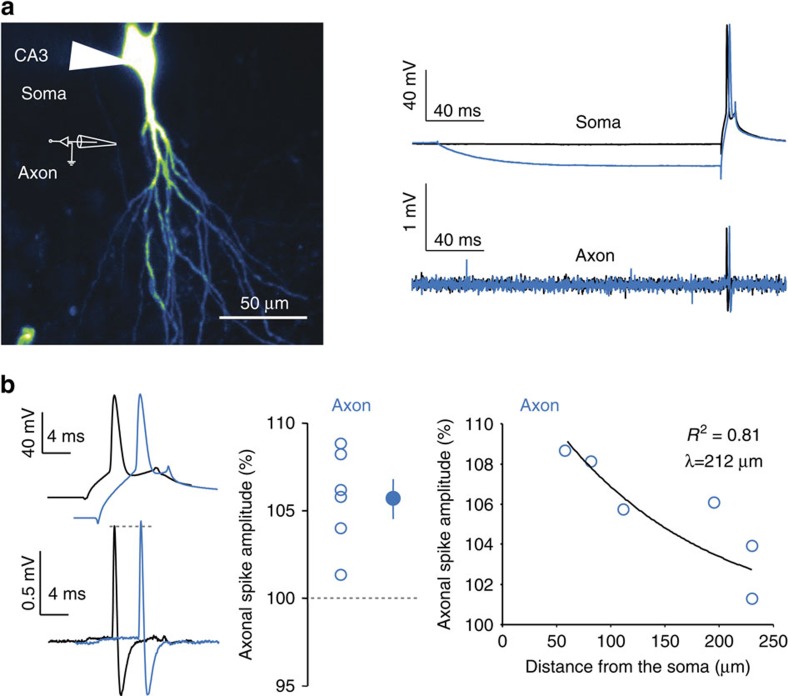
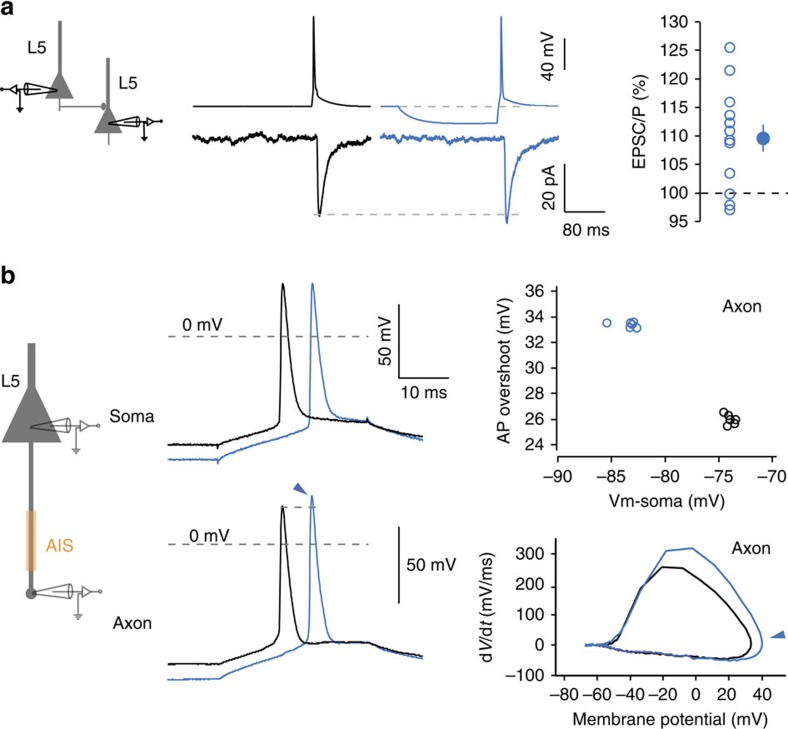
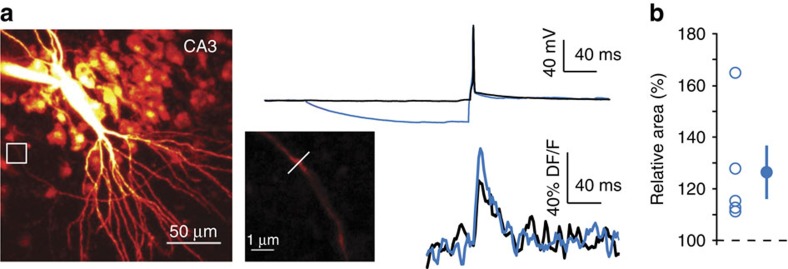
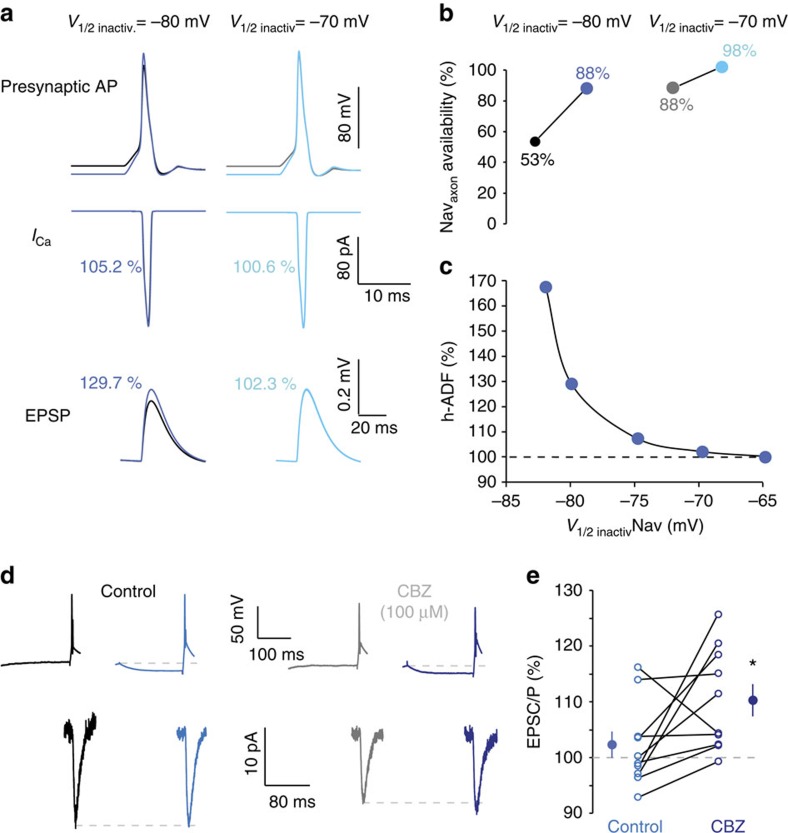
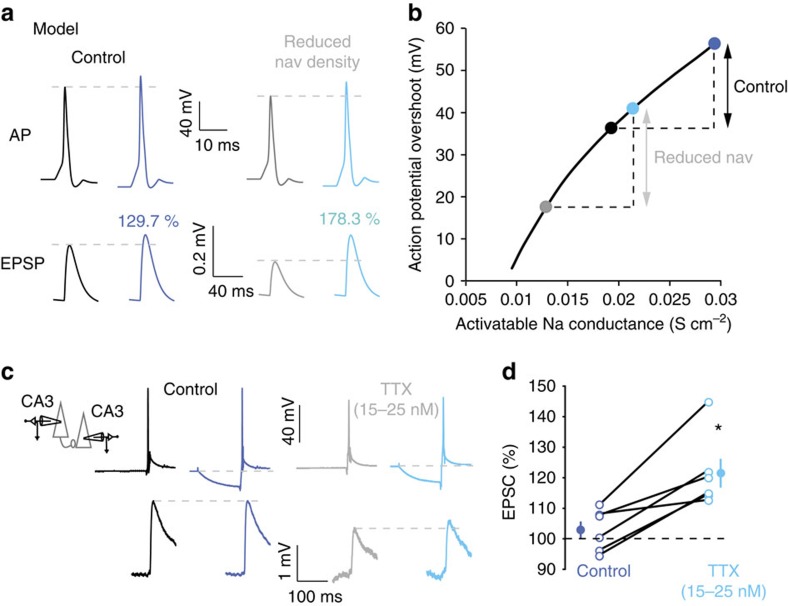
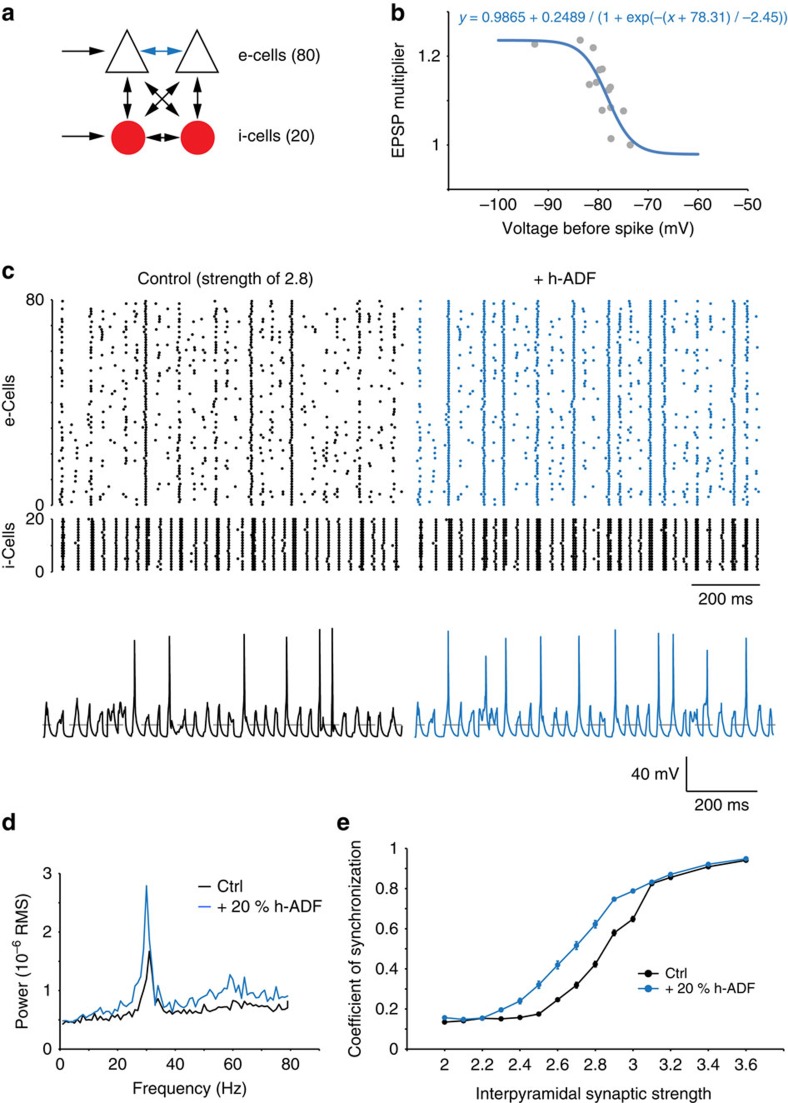
In the mammalian brain, synaptic transmission usually depends on presynaptic action potentials (APs) in an all-or-none (or digital) manner. Recent studies suggest, however, that subthreshold depolarization in the presynaptic cell facilitates spike-evoked transmission, thus creating an analogue modulation of a digital process (or analogue-digital (AD) modulation). At most synapses, this process is slow and not ideally suited for the fast dynamics of neural networks. We show here that transmission at CA3-CA3 and L5-L5 synapses can be enhanced by brief presynaptic hyperpolarization such as an inhibitory postsynaptic potential (IPSP). Using dual soma-axon patch recordings and live imaging, we find that this hyperpolarization-induced AD facilitation (h-ADF) is due to the recovery from inactivation of Nav channels controlling AP amplitude in the axon. Incorporated in a network model, h-ADF promotes both pyramidal cell synchrony and gamma oscillations. In conclusion, cortical excitatory synapses in local circuits display hyperpolarization-induced facilitation of spike-evoked synaptic transmission that promotes network synchrony.


Figures

Figure 1
Figure 1. Synaptic facilitation induced by transient hyperpolarization (h-ADF) in CA3 neurons.
(a) Facilitation of synaptic transmission at CA3–CA3 connections by a hyperpolarizing pre-pulse (200 ms duration). Left, schematic of the recording configuration. Middle, example of facilitation produced by the presynaptic hyperpolarizing pulse (10 traces were averaged). Right, summary of facilitation induced by presynaptic hyperpolarization of increasing amplitude. Note that no further facilitation was induced when the magnitude of the hyperpolarizing pre-pulse was increased. (b) h-ADF can be induced by brief presynaptic hyperpolarization. Left, examples of recording from a pair of connected CA3 pyramidal neurons with no hyperpolarization and 15, 50, 100 and 200 ms of hyperpolarization to −93 mV before the spike. Right, summary of facilitation induced by 15, 50, 100 and 200 ms (all Wilcoxon test, P<0.05, n=7). (c) d- and h-ADF are coexpressed at CA3–CA3 connections. Left, representative example. Top traces, membrane potential of the presynaptic neuron in control (black), during d-ADF (red), during h-ADF (blue) and when d- and h-ADF are combined (dark red). Bottom traces, postsynaptic responses in each case averaged over 10 trials. Right, group data (Mann–Whitney test, n=16, for d-ADF, 11 for h-ADF and 16 for d- and h-ADF). Note the stepwise increase in transmission when d- and h-ADF are combined.
Figure 2
Figure 2. Physiological induction of h-ADF.
(a) Presynaptic IPSPs induce h-ADF. Left, schematic representation of the system used to inject a dynamic current mimicking a GABAergic input in the presynaptic neuron. Middle, examples of electrophysiological recordings from a connected pair of CA3 neurons in control conditions (black traces) and when a simulated GABAergic input is injected into the presynaptic cell (blue traces). Right, scatter plot showing the normalized EPSP/C as a function of the peak value of the simulated presynaptic IPSP. A clear linear correlation was observed (y=−1.8x+101.8, Pearson's R2=0.39, P<0.05, n=11). (b) h-ADF induced during subthreshold θ oscillation in CA3 neurons. Left, representative example. Presynaptic spikes are triggered at different phases during a subthreshold oscillation of the membrane potential at 4 Hz. Note that facilitation is observed when the spike is triggered during the hyperpolarized phases of the oscillation. Right, quantitative data (n=8). Stars: significant changes (Wilcoxon, P<0.05).
Figure 3
Figure 3. h-ADF enhances spike amplitude in the axon.
(a) Left, confocal image of a CA3 neuron filled with Alexa 488. The axon collateral (white arrow) is identified on the left and recorded in a cell-attached configuration. Right, simultaneous recordings from the soma (top) and axon (bottom) when the spike is triggered from resting membrane potential (black) or from a transient hyperpolarizing pre-pulse (blue). (b) Left, comparison of the spike amplitude measured in the axon evoked with (blue) or without (black) hyperpolarizing pre-pulse. Note the increase in amplitude in the axon when the spike is triggered from the hyperpolarizing pre-pulse. Middle, quantitative analysis of the hyperpolarization-induced enhancement of the axonal spike amplitude in six neurons. Right, scatter plot of the change in the axonal spike amplitude as a function of axonal distance (exponential fit, y=11.6ex/212, r2=0.81).
Figure 4
Figure 4. h-ADF at L5–L5 synapses.
(a) Paired recording of synaptically connected L5 pyramidal neurons. Middle, synaptic facilitation produced by a brief presynaptic hyperpolarization (−20 mV; 200 ms). The EPSCs correspond to averages over 25 traces. Right, h-ADF obtained in 12 L5–L5 pairs. (b) Dual soma–axon recordings in L5 pyramidal neurons. Left, experimental design showing double recording from the soma and the axonal bleb of L5 pyramidal neuron. Middle, Soma–axon recording in L5 pyramidal neurons. Note that a brief hyperpolarization of the soma enhances the amplitude of the spike in the axon but not in the soma. Right top, AP overshoot measured in the axon as a function of membrane potential in the cell body, for resting (black) or hyperpolarized (blue) potentials (n=6 traces for each case). Right bottom, phase plot of the axonal spikes evoked at rest (black) and following a brief hyperpolarization (blue). Note the enhanced amplitude after a brief hyperpolarization (arrow). The rate of depolarization is also enhanced and the spike threshold is slightly hyperpolarized.
Figure 5
Figure 5. h-ADF enhances spike-evoked calcium signal in the presynaptic terminal of CA3 neurons.
(a) A brief hyperpolarizing pre-pulse enhances the spike-evoked Ca2+ transient. Left top, experimental design showing a CA3 pyramidal neuron filled with Alexa-594 and Fluo-4. White box: area enlarged at right, showing a presynaptic bouton. Right top, voltage traces recorded in the cell body of a CA3 pyramidal neuron. Right bottom, example of fluorescent signals recorded in the presynaptic bouton. The spike-evoked Ca2+ transient was increased by ∼20% when the presynaptic spike was evoked following a transient hyperpolarization. (b) Quantitative data (n=5).
Figure 6
Figure 6. Role of Nav inactivation in h-ADF.
(a) Simulated h-ADF in control conditions (V1/2 inactivation=−80 mV for axonal sodium channels). Note the increased amplitude of the spike. Lack of h-ADF when the half-inactivation of the axonal sodium channel is depolarized (V1/2=−70 mV). (b) Summary of the availability of Navaxon with V1/2 inactivation=−80 mV or −70 mV. Note the marked increase with −80 but not −70 mV. (c) Magnitude of simulated h-ADF as a function of V1/2 inactivation of Nav channels in the axon. Note the increase in h-ADF induced by the hyperpolarization of V1/2. (d) Experimental enhancement of Nav inactivation with CBZ increases the magnitude of h-ADF. Under control condition (left), this connection expresses no h-ADF. When CBZ is added, h-ADF is now visible (right). (e) Quantitative data for 10 mature CA3–CA3 connections (DIV 24–32). Star: Wilcoxon, P<0.05.
Figure 7
Figure 7. Decreasing Nav channel density with TTX enhances h-ADF.
(a) Reduction of Nav channel density in the model of h-ADF. Under control conditions (left), h-ADF amounts to +30%. After reducing the Nav channel density (70% of the control, right), h-ADF is increased to +80%. (b) Modulation of the presynaptic spike amplitude as a function of activatable Na conductance. Under control conditions, the hyperpolarization from −78 to −93 mV only slightly increases the spike amplitude (black double arrow). When the Nav channel density is reduced, the increase in the spike amplitude is enhanced by 20% (light-blue double arrow). (c) Experimental reduction of Nav density with TTX. Under control condition (left), this connection expresses no h-ADF. When a low concentration of TTX is added, transmission is preserved and h-ADF is now visible (right). (d) Quantitative data for six mature CA3–CA3 connections (DIV 20–32). Star: Wilcoxon, P<0.05.
Figure 8
Figure 8. h-ADF promotes network synchrony.
(a) Scheme of a CA3 network model. The network is composed of 80 e-cells (white triangles) and 20 i-cells (red circles). Pyramidal cells and interneurons were fed by stochastic input. The connections between pyramidal neurons (blue arrows) are the only connections in which h-ADF can be added as h-ADF was not tested experimentally in other connections. (b) h-ADF rule at excitatory synapses between pyramidal neurons. A maximal 20% facilitation is applied, according to the membrane voltage measured 17 ms before the spike. (c) Effect of the h-ADF rule on network synchrony. Left top, rastergram showing the network activity in control conditions with a synaptic strength of 2.8 mS. Left bottom, representative trace in an e-cell. Right top, with the h-ADF rule (+20% h-ADF), the synchrony is increased. Right bottom, representative trace in an e-cell. Note that membrane potential crosses the −73-mV limit between spikes (dotted lines). (d) Power spectrum of the data shown in c (synaptic strength of 2.8 mS). Adding h-ADF rules dramatically increases the network synchrony around the gamma frequency (29 Hz). (e) Synchronization coefficients calculated for synaptic strengths from 2 to 3.6. Incorporation of h-ADF increases synchrony (blue).

Similar articles

Cited by

References

    1. Shimahara T. & Tauc L. Multiple interneuronal afferents to the giant cells in Aplysia. J. Physiol. 247, 299–319 (1975) . - PMC - PubMed
    1. Shimahara T. & Peretz B. Soma potential of an interneurone controls transmitter release in a monosynaptic pathway in Aplysia. Nature 273, 158–160 (1978) . - PubMed
    1. Nicholls J. & Wallace B. G. Modulation of transmission at an inhibitory synapse in the central nervous system of the leech. J. Physiol. 281, 157–170 (1978) . - PMC - PubMed
    1. Shapiro E., Castellucci V. F. & Kandel E. R. Presynaptic membrane potential affects transmitter release in an identified neuron in Aplysia by modulating the Ca2+ and K+ currents. Proc. Natl Acad. Sci. USA 77, 629–633 (1980) . - PMC - PubMed
    1. Shu Y., Hasenstaub A., Duque A., Yu Y. & McCormick D. A. Modulation of intracortical synaptic potentials by presynaptic somatic membrane potential. Nature 441, 761–765 (2006) . - PubMed

Publication types