. 2015 Dec 14;10(12):e0144596.
doi: 10.1371/journal.pone.0144596. eCollection 2015.

Ethanol Inhibits High-Affinity Immunoglobulin E Receptor (FcεRI) Signaling in Mast Cells by Suppressing the Function of FcεRI-Cholesterol Signalosome

Affiliations

Ethanol Inhibits High-Affinity Immunoglobulin E Receptor (FcεRI) Signaling in Mast Cells by Suppressing the Function of FcεRI-Cholesterol Signalosome

Lubica Draberova et al. PLoS One. .

Abstract

Ethanol has multiple effects on biochemical events in a variety of cell types, including the high-affinity immunoglobulin E receptor (FcεRI) signaling in antigen-activated mast cells. However, the underlying molecular mechanism remains unknown. To get better understanding of the effect of ethanol on FcεRI-mediated signaling we examined the effect of short-term treatment with non-toxic concentrations of ethanol on FcεRI signaling events in mouse bone marrow-derived mast cells. We found that 15 min exposure to ethanol inhibited antigen-induced degranulation, calcium mobilization, expression of proinflammatory cytokine genes (tumor necrosis factor-α, interleukin-6, and interleukin-13), and formation of reactive oxygen species in a dose-dependent manner. Removal of cellular cholesterol with methyl-β-cyclodextrin had a similar effect and potentiated some of the inhibitory effects of ethanol. In contrast, exposure of the cells to cholesterol-saturated methyl-β-cyclodextrin abolished in part the inhibitory effect of ethanol on calcium response and production of reactive oxygen species, supporting lipid-centric theories of ethanol action on the earliest stages of mast cell signaling. Further studies showed that exposure to ethanol and/or removal of cholesterol inhibited early FcεRI activation events, including tyrosine phosphorylation of the FcεRI β and γ subunits, SYK kinases, LAT adaptor protein, phospholipase Cγ, STAT5, and AKT and internalization of aggregated FcεRI. Interestingly, ethanol alone, and particularly in combination with methyl-β-cyclodextrin, enhanced phosphorylation of negative regulatory tyrosine 507 of LYN kinase. Finally, we found that ethanol reduced passive cutaneous anaphylactic reaction in mice, suggesting that ethanol also inhibits FcεRI signaling under in vivo conditions. The combined data indicate that ethanol interferes with early antigen-induced signaling events in mast cells by suppressing the function of FcεRI-cholesterol signalosomes at the plasma membrane.


Conflict of interest statement

Competing Interests: The authors have declared that no competing interests exist.

Figures

Fig 1
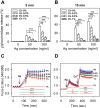
Fig 1. Short-term exposure to ethanol inhibits antigen-induced degranulation and calcium response in BMMCs.
IgE-sensitized cells were preincubated for 15 min with various concentrations of ethanol (0–1%), which was also present during antigen-mediated activation. (A, B) Degranulation (release of β-glucuronidase) was measured 5 min (A) or 15 min (B) after exposure of the cells to the indicated concentrations of antigen. (C, D) Calcium response after addition of antigen (arrow, Ag, 100 ng/ml) was measured in the presence of 1 mM extracellular calcium (C), or in its absence (D), followed by addition of 1 mM calcium (arrow, Ca2+ in D). Calcium levels in the absence of antigen activation but in the presence of 1% ethanol is also shown in C and D (empty circles). Data are means ± SEs (n = 6–8). Statistical significance of intergroup differences is shown in A and B. In C and D, statistical significance of differences between control cells (0% ethanol) and cells exposed to 0.2% ethanol (violet line), 0.5% ethanol (green line) or 1% ethanol (red line) calculated for the corresponding time intervals (coloured lines) are also indicated.
Fig 2
Fig 2. The inhibitory effect of ethanol on antigen-induced degranulation is not affected by blocking alcohol dehydrogenase.
IgE-sensitized cells were pretreated or not (Ctrl) for 15 min with ethanol (0.5%) and/or 4-MP (0.1 or 1.0 mM). The cells were non-activated or activated with antigen (100 ng/ml) in the presence of ethanol and/or 4-MP for 15 min and degranulation was determined. Data are means ± SEs (n = 6). Statistical significance of differences between antigen-activated control cells and ethanol-treated cells is also shown. 4-
Fig 3
Fig 3. Involvement of cholesterol in the inhibitory effect of ethanol on FcεRI-mediated degranulation.
(A, B) IgE-sensitized BMMCs were preincubated for 15 min without (Ctrl) or with Mβ (2 mM), and/or ethanol (0.5%), followed by exposure to the indicated concentrations of antigen in the presence of the drugs. Degranulation was measured 5 min (A) or 15 min (B) after triggering. (C) IgE-sensitized cells were preincubated for 15 min without (Ctrl) or with Mβ (2 mM), sMβ (2 mM), and/or ethanol (0.5%) and then activated (Ag; 100 ng/ml) or not in the presence of the drugs. Degranulation was determined 15 min after triggering. (D) IgE-sensitized cells were preincubated with various drugs as above, then exposed to various concentrations of antigen and cell activation, measured by CD107a (LAMP1) expression, was determined by flow cytometry. Data are means ± SEs (n = 4–12). Statistical significance of the intergroup differences is also shown.
Fig 4
Fig 4. Involvement of cholesterol in the inhibitory effect of ethanol on FcεRI-mediated calcium response.
(A, B) IgE-sensitized BMMCs were incubated for 15 min without (Ctrl) or with ethanol (Et, 0.5%) and/or Mβ (2 mM). Calcium response after adding antigen (arrow, Ag; 100 ng/ml) was measured in the presence of the drugs as indicated. The cells were activated in the presence of extracellular calcium (A) or in its absence, followed by addition of 1 mM calcium (B, Ca2+, arrow). (C) IgE-sensitized cells were incubated for 15 min in medium alone (Ctrl) or medium supplemented with ethanol (Et; 0.5%), Mβ saturated with cholesterol (sMβ; 2 mM), or sMβ (2mM) and ethanol (0.5%). The cells were activated in the presence of the drugs with antigen (arrow, Ag; 100 ng/ml) and calcium response was determined. (D) Data from Fig 4C were used to calculate the difference between calcium response in cells exposed to sMβ or Ctrl and sMβ+Et or Et. Data are means ± SEs (n = 6–12). Statistical significance of differences in A and B [Ctrl versus Et-treated cells (green line) and Ctrl versus Mβ+Et-treated cells (brown line)], C [sMβ versus Ctrl (green line) and sMβ+Et versus Et (red line)], and D [sMβ—Ctrl versus sMβ+Et—Et (black line)] calculated for the corresponding time intervals (coloured lines) are also indicated.
Fig 5
Fig 5. Ethanol or cholesterol removal inhibit expression of cytokine genes in antigen-activated BMMCs.
(A) IgE-sensitized cells were preincubated for 15 min with the indicated concentrations of ethanol, which were also present during activation with antigen (100 ng/ml). mRNAs for TNF-α, IL-6, and IL-13 were isolated one hour after triggering and quantified by qPCR. (B) The cells were exposed to medium alone (-), ethanol (0.5%) and/or Mβ (2 mM) and mRNAs for TNF-α, IL-6, and IL-13 were quantified as above. Data are means ± SEs (n = 6–8). The statistical significance of the intergroup differences is also shown.
Fig 6
Fig 6. Protective effect of cholesterol against ethanol-mediated inhibition of ROS production in antigen-activated BMMCs.
(A) IgE-sensitized cells were incubated for 15 min with the indicated concentrations of ethanol, which was also present during the activation. Then the cells were activated or not with antigen (250 ng/ml) and ROSs were determined using H2DCFDA as a substrate. The values on y-axes indicate fluorescence intensities observed 10 min after triggering. (B) The cells were exposed to BSS-BSA supplemented or not with ethanol (0.5%), Mβ (2 mM) and/or sMβ (2 mM), and after 20 min activated or not with antigen (250 ng/ml). ROSs were determined as above. Data are means ± SEs (n = 6–8). The statistical significance of the intergroup differences is also shown.
Fig 7
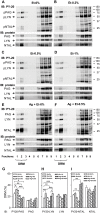
Fig 7. Ethanol-induced changes in protein tyrosine phosphorylation in the plasma membrane domains.
(A–F) IgE-sensitized BMMCs were pretreated or not with the indicated concentrations of ethanol for 15 min and then non-activated (A–D) or activated with antigen (E and F; 100 ng/ml) for 5 min. Then the cells were solubilized in 1% Brij-96-containing lysis buffer and fractionated on sucrose density gradient. Individual fractions were collected from the top of the gradient (fraction 1), size fractionated by SDS-PAGE and examined for tyrosine phosphoproteins by immunoblotting (IB) with PY-20-HRP conjugate (PY-20) or with antibodies specific for PAG, LYN, and NTAL). Positions of PAG, LYN, and NTAL are indicated by arrows on the left. Fractions (1–3) containing detergent-resistant membranes are marked (DRM). Numbers on the right indicate positions of molecular weight markers in kDa. Representative immunoblots from three to four independent experiments are shown. (G–I) All immunoblots were analyzed by densitometry, and the relative amounts of PAG (G), LYN (H), and NTAL (I) and their tyrosine phosphorylated forms (PY-20) in DRMs were determined. Means ± S.E. were calculated and the statistical significance of intergroup differences was determined.
Fig 8
Fig 8. Pretreatment with ethanol inhibits tyrosine phosphorylation of FcεRI β and γ subunits and some other proteins involved in FcεRI signaling.
(A) IgE-sensitized cells were preincubated for 15 min with BSS-BSA alone (Ctrl) or supplemented with ethanol (0.5%) and/or Mβ and then activated or not with antigen (100 ng/ml) in the presence or absence of the compounds. After 5 min the cells were solubilized in 0.2% Triton X-100 and FcεRI was immunoprecipitated (IP) from postnuclear supernatants. The immunoprecipitates were resolved by SDS-PAGE and analyzed by immunoblotting with PY-20-HRP conjugate. For loading controls, the same membrane was stripped and re-blotted with FcεRI-β-chain-specific antibody. Representative immunoblots from three to five independent experiments are shown on the left. The immunoblots were analyzed by densitometry and the fold increase in tyrosine FcεRI-β and -γ chain phosphorylation, normalized to non-activated cells and the amount of FcεRI-β chain, is also shown on the right. (B) IgE-sensitized cells were incubated and activated as above. Five min after triggering the cells were solubilized, size fractionated, and tyrosine phosphorylated proteins were detected by immunoblotting with the phosphoprotein-specific antibodies. Antibodies for the corresponding proteins were used for detection of loading controls. Representative immunoblots from three to four independent experiments are shown. (C) The immunoblots were analyzed by densitometry. Fold increases of protein tyrosine phosphorylation, normalized to control (Ctrl) non-activated cells and the corresponding protein loads are shown. (D and E) IgE-sensitized cells were incubated with the drugs as in A and then activated with antigen (100 ng/ml) in the presence of the drugs for the indicated time intervals. The cells were solubilized, size fractionated, and LYN phosphorylated on Tyr 507 (D) or Tyr 416 (E) was detected by immunoblotting with the corresponding antibodies. After stripping, the membranes were developed for LYN used as a loading control. Fold increase in protein tyrosine phosphorylation, normalized to non-activated cells (Ctrl) and protein load, is also shown. Means ± SEs and the statistical significance of differences in A, C, E, and D were calculated from three to five independent experiments.
Fig 9
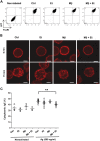
Fig 9. Pretreatment with ethanol and cholesterol removal do not interfere with the FcεRI expression but affect its internalization.
(A) The cells were incubated or not for 15 min with BSS-BSA alone (Ctrl) or supplemented with ethanol (0.5%) and/or Mβ (2 mM) and then stained for surface KIT and FcεRI by direct immunofluorescence followed by flow cytometry analysis. (B) IgE-sensitized cells were incubated with the drugs as above and activated or not with antigen (500 ng/ml). After 15 min the cells were fixed, permeabilized, labeled for IgE and analyzed by confocal microscopy. Bars = 5 μm. (C) Distribution of IgE in individual cells was evaluated and the fraction of IgE detected in the cytoplasm was determined. Each spot represents one cell, bars indicate means. Statistical significance of intergroup differences is also indicated.
Fig 10
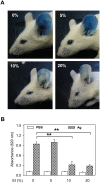
Fig 10. Inhibitory effect of ethanol on mast cell-mediated PCA.
PCA was performed as described in Materials and methods. Sensitizing IgE in PBS and PBS alone were injected into left and right ears, respectively. (A) Representative photographs of ears of the mice injected intraperitoneally with 0.5 ml (per mouse weighing 20 g) PBS alone (0%) or with 0.5 ml of PBS containing 5%, 10%, or 20% ethanol, followed by intravenous administration of Evans blue and antigen in PBS. (B) Quantitative data for ear-tissue extracted Evans blue from left (IgE) and right (PBS) ears in mice treated as above. Means ± SEs were calculated from 3–4 animals in each group. Statistically significant differences between control mice injected with PBS alone and mice injected with 10% or 20% ethanol in PBS are shown.
Fig 11
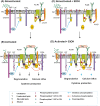
Fig 11. Model of FcεRI-mediated activation in ethanol-pretreated mast cells.
In nonactivated cells (A), the topography of FcεRI and other signaling molecules, such as SRC family kinase LYN, protein tyrosine phosphatase (PTP), and adaptor proteins (LAT, PAG, and NTAL), prevents signaling. An important role in this process is played by the plasma membrane cholesterol. Aggregation of the FcεRI-IgE complexes by multivalent antigen (B) induces topographical changes that lead to formation of the FcεRI signalosome and enhanced tyrosine phosphorylation of the FcεRI β and γ subunits by LYN and SYK kinases. This results in enhanced degranulation, calcium response, cytokine production and numerous other events. In the cells exposed to ethanol and/or with reduced amount of cholesterol (C), the topography of plasma membrane molecules is slightly modified, resulting in increased tyrosine phosphorylation of some signaling molecules even in nonactivated cells. Aggregation of the receptor in ethanol-treated cells leads to suboptimal topographical changes resulting in reduced tyrosine phosphorylation of the FcεRI β and γ subunits by LYN and SYK kinases and/or enhanced activity of the corresponding phosphatases (D). This leads to reduced degranulation, calcium response, cytokine production and other events. Ethanol could also bind directly to some cytoplasmic or plasma membrane proteins, such as ion channel proteins, and in this way inhibit the cell signaling.

References

    1. Peoples RW, Li C, Weight FF. Lipid vs protein theories of alcohol action in the nervous system. Annu Rev Pharmacol Toxicol. 1996; 36: 185–201. 10.1146/annurev.pa.36.040196.001153 - DOI - PubMed
    1. Meyer HH. Zur theorie der alkoholnarkose. I. Mitt. welche eigenschaft der anästhetika bedingt ihre narkotische wirkung? Arch Exp Pathol Pharmakol. 1899; 42: 109–108.
    1. Meyer KH. Contribution to the theory of narcosis. Trans Faraday Soc. 1937; 33: 1062–1068.
    1. Chin JH, Goldstein DB. Effects of low concentrations of ethanol on the fluidity of spin-labeled erythrocyte and brain membranes. Mol Pharmacol. 1977; 13: 435–441. - PubMed
    1. Chen SY, Yang B, Jacobson K, Sulik KK. The membrane disordering effect of ethanol on neural crest cells in vitro and the protective role of GM1 ganglioside. Alcohol. 1996; 13: 589–595. S0741832996000730. - PubMed

Publication types