. 2015 Dec 14:5:18272.
doi: 10.1038/srep18272.

The interplay of the Notch signaling in hepatic stellate cells and macrophages determines the fate of liver fibrogenesis

Affiliations

The interplay of the Notch signaling in hepatic stellate cells and macrophages determines the fate of liver fibrogenesis

Ruchi Bansal et al. Sci Rep. .

Abstract

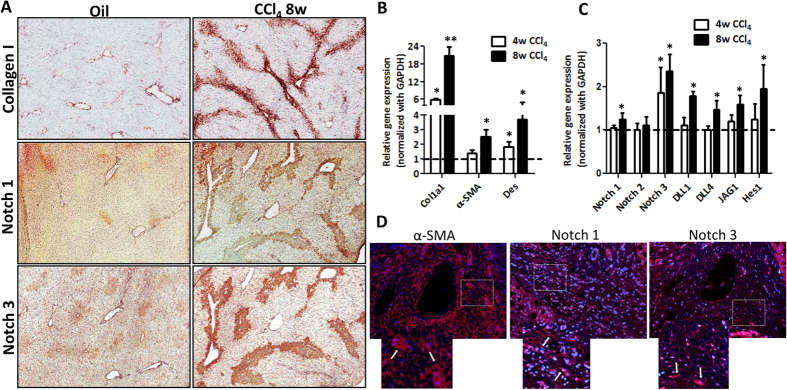
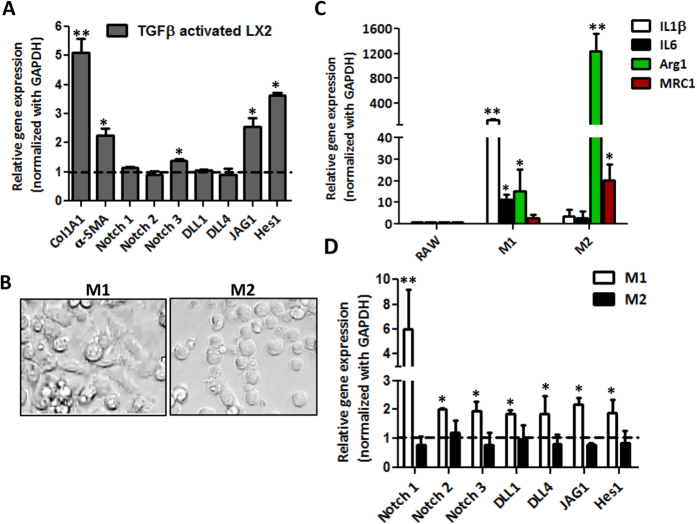
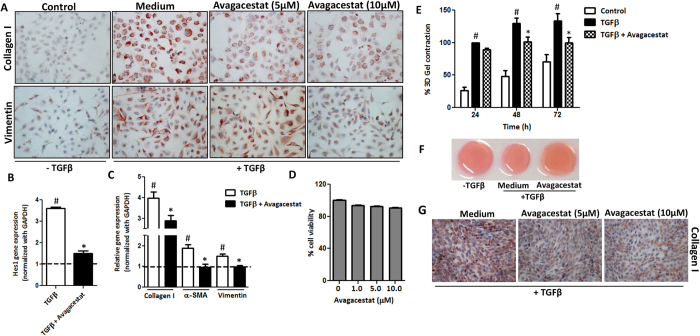
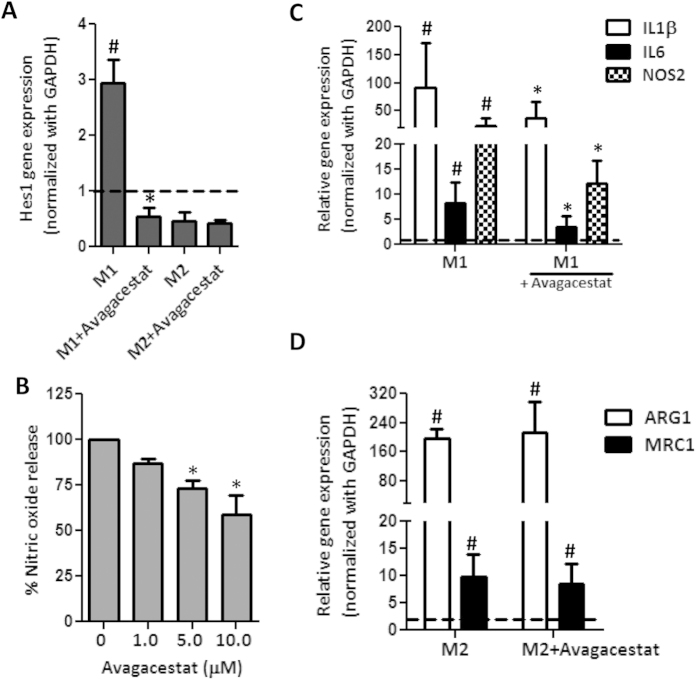
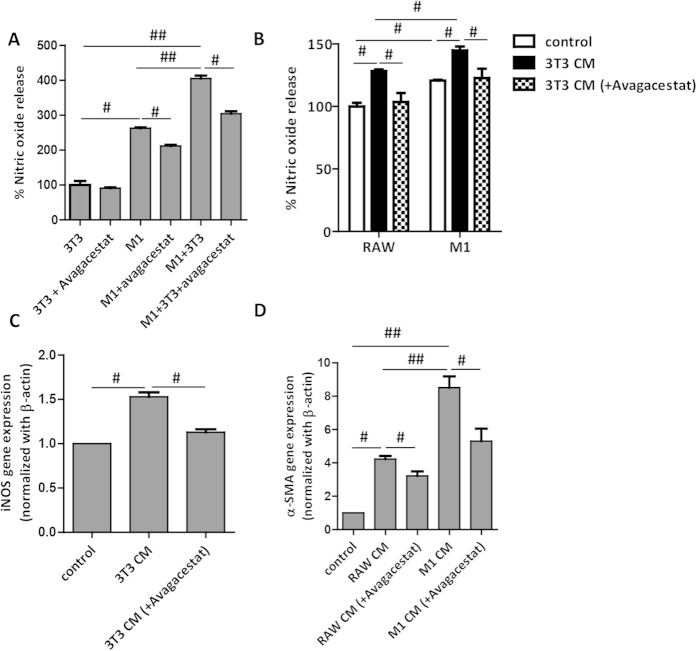
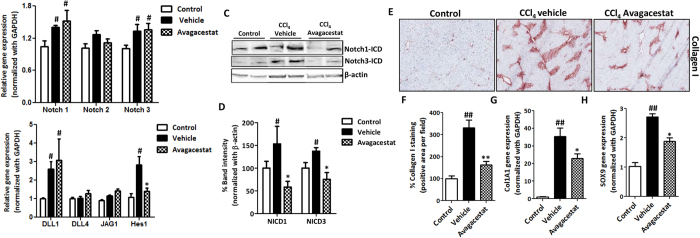
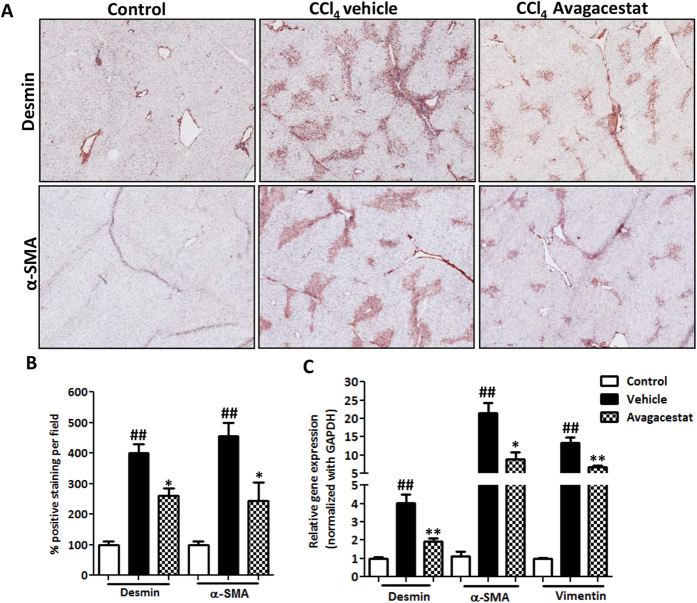
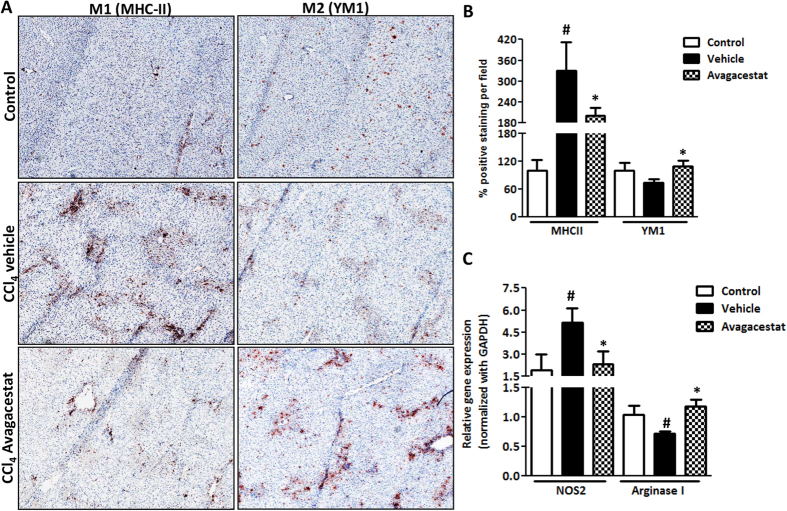
Hepatic stellate cells (HSCs) known as "master producers" and macrophages as "master regulators", are the key cell types that strongly contribute to the progression of liver fibrosis. Since Notch signaling regulates multiple cellular processes, we aimed to study the role of Notch signaling in HSCs differentiation and macrophages polarization and to evaluate its implication in liver fibrogenesis. Notch pathway components were found to be significantly upregulated in TGFβ-activated HSCs, inflammatory M1 macrophages, and in mouse and human fibrotic livers. Interestingly, inhibition of Notch using a selective γ-secretase inhibitor, Avagacestat, significantly inhibited TGFβ-induced HSC activation and contractility, and suppressed M1 macrophages. Additionally, Avagacestat inhibited M1 driven-fibroblasts activation and fibroblasts-driven M1 polarization (nitric oxide release) in fibroblasts and macrophages co-culture, and conditioned medium studies. In vivo, post-disease treatment with Avagacestat significantly attenuated fibrogenesis in CCl4-induced liver fibrosis mouse model. These effects were attributed to the reduction in HSCs activation, and inhibition of inflammatory M1 macrophages and upregulation of suppressive M2 macrophages. These findings suggest that Notch signaling plays a crucial role in HSC activation and M1/M2 polarization of macrophages in liver fibrosis. These results provide new insights for the development of novel therapies against liver fibrosis through modulation of Notch signaling.


Figures

Figure 1
Figure 1. Notch signaling pathway in CCl4-induced chronic liver fibrosis in mice and fibrotic human livers.
(A) Representative photomicrographs (200 μm) showing Collagen I, Notch-1 and Notch-3 stained liver sections from olive oil-treated (non-fibrotic) control mice and CCl4-treated (fibrotic) mice (n = 5). Quantitative gene expression (normalized with GAPDH) of (B) fibrotic parameters (Col1A1, α-SMA and desmin), and (C) Notch pathway components: Notch receptors (Notch-1, -2 and -3), Notch ligands (Dll1, Dll4 and Jag1) and downstream Notch signaling molecule (Hes1) in the livers of olive oil-treated (non-fibrotic controls) and CCl4-treated (fibrotic) mice. (D) Representative fluorescent photomicrographs (200 μm) showing α-SMA, Notch-1 and Notch-3 stained liver sections (in red) from fibrotic human livers (n = 4). Nuclei were stained blue using DAPI. The lower panel shows a zoomed in area, where white arrows indicates positive staining. Bars represent mean ± SEM of n = 5. *p < 0.05 and **p < 0.01 denotes significance versus respective olive oil treated control group (denoted as dotted line).
Figure 2
Figure 2. Expression of Notch signaling pathway activation in human HSCs and macrophages.
(A) Quantitative gene expression analysis of fibrotic marker (Col1A1), HSC activation marker (α-SMA) Notch receptors (Notch-1,-2 and -3), Notch ligands (Dll1, Dll4 and Jag1) and downstream Notch signaling molecule (Hes1) in TGFβ-activated HSCs versus control HSCs (expressed as dotted line). (B) Representative microscopic images of M1-differentiated (LPS/IFNγ treated) and M2-differentiated (IL-4/IL-13 treated) macrophages (scale bars, 200 μm). Quantitative gene expression analysis of (C) M1-specific markers (IL-1β and IL-6) and M2-specific markers (Arginase I, Arg1 and Mannose receptor C type 1, MRC1); (D) Notch pathway related genes: Notch receptors (Notch-1, -2 and -3); Notch ligands (Dll1, Dll4 and Jag1) and downstream Notch signaling molecule (Hes1), in M1-differentiated and M2-differentiated RAW macrophages. Untreated/undifferentiated RAW cells are denoted as dotted line. Bars represent mean ± SEM of atleast three independent experiments. *p < 0.05 and **p < 0.01 denotes significance versus respective control cells.
Figure 3
Figure 3. Effect of Notch inhibition on the activation and contractility of TGFβ-activated human HSCs.
(A) Representative images (scale bars, 200 μm) of collagen I and vimentin stained LX2 cells treated with medium alone (control), TGFβ (5 ng/ml) ± 5 μM or 10 μM Notch inhibitor (Avagacestat). Quantitative gene expression analysis (normalized with GAPDH) of (B) Notch signaling molecule Hes1, (C) Fibrotic parameters: collagen I, α-SMA and Vimentin on LX2 cells treated with medium alone (control expressed as dotted line), TGFβ (5 ng/ml) ± 10 μM Avagacestat. (D) Graph showing % cell viability performed on LX2 cells incubated with increasing concentrations of Avagacestat. (E) Graph depicts % 3D-collagen-I gel contraction after 24, 48 and 72 h of treatment with medium alone (control), TGFβ (5 ng/ml) ± 10 μM Avagacestat. (F) Representative microscopic images of the contracted collagen gels after 72 h of treatments. (G) Representative pictures (scale bars, 200 μm) of collagen I stained mouse 3T3 fibroblasts treated with medium alone (control), TGFβ (5 ng/ml) ± 5 μM or 10 μM Avagacestat. Bars represent mean ± SEM of atleast three independent experiments. #p < 0.05 denotes significance versus respective control cells; *p < 0.05 denotes significance versus TGFβ-treated cells.
Figure 4
Figure 4. Effect of Notch inhibition on the polarization of M1- and M2-differentiated macrophages.
(A) Quantitative gene expression analysis of Hes1 in M1-differentiated and M2-differentiated RAW macrophages incubated with 10 μM Avagacestat. Untreated/undifferentiated RAW macrophages are expressed as dotted line. (B) Graph depicts nitric oxide release (expressed in %) by M1-differentiated macrophages incubated with increasing concentrations of Avagacestat. (C) Quantitative gene expression analysis of M1 markers (IL-1β, IL-6 and NOS2) in M1-differentiated RAW macrophages incubated with 10 μM Avagacestat. (D) Quantitative gene expression analysis of M2 markers (Arg1 and MRC1) in M2-differentiated RAW macrophages incubated with 10 μM Avagacestat. Untreated/undifferentiated RAW macrophages are expressed as dotted line. Bars represent mean ± SEM of atleast three independent experiments. #p < 0.05 denotes significance versus respective untreated RAW cells. *p < 0.05 denotes significance versus M1-differentiated RAW macrophages.
Figure 5
Figure 5. Effect of Avagacestat on the cross-talk between 3T3 fibroblasts and RAW macrophages.
(A) Graph depicting nitric oxide release (expressed in %) from RAW macrophages and 3T3 fibroblasts cultured either alone or together (co-culture). 3T3 (TGFβ-activated) and M1-differentiated macrophages were treated with 10 μM Avagacestat either separately or in co-culture. (B) Graph depicts nitric oxide release (expressed in %) from undifferentiated RAW macrophages and M1-differentiated macrophages treated with medium alone (control), 3T3-conditioned medium (3T3 CM) and Avagacestat (10 μM) treated 3T3-conditioned medium (3T3 CM + Avagacestat). (C) Quantitative gene expression analysis of iNOS (normalized with GAPDH) in RAW macrophages treated with medium alone (control), 3T3-conditioned medium (3T3 CM) and Avagacestat (10 μM) treated 3T3-conditioned medium (3T3 CM + Avagacestat). (D) α-SMA gene expression analysis (normalized with GADPH) in 3T3 fibroblasts treated with medium alone (control), undifferentiated RAW macrophages conditioned medium (RAW CM), Avagacestat (10 μM) treated RAW macrophages conditioned medium (RAW CM + Avagacestat), M1-differentiated macrophages conditioned medium (M1 CM) and Avagacestat (10 μM) treated M1-differentiated macrophages conditioned medium (M1 CM + Avagacestat). Bars represent mean ± SEM of atleast three independent experiments. #p < 0.05, ##p < 0.01 denotes significance.
Figure 6
Figure 6. Effect of Notch pathway inhibition on CCl4-induced acute liver fibrogenesis.
Quantitative real time PCR analysis for (A) Notch receptors (Notch-1, -2 and -3); (B) Notch ligands (Dll1, Dll4 and Jag1) and Notch signaling molecule Hes1 in olive oil-treated control, vehicle- and Avagacestat-treated CCl4 mice. Representative image (C) and quantitative analysis (D) of the Western blots for Notch-1 intracellular domain (NICD1), Notch-3 intracellular domain (NICD3) and β-actin performed on liver homogenates from olive oil-treated control, vehicle- and Avagacestat-treated CCl4 mice. Each band represents an individual mice. Quantitation was performed in n = 3 mice per group and represented as averaged % band intensity (normalized with respective β-actin band intensity). (E) Representative photomicrographs (200 μm) and (F) Quantitative histological analysis of Collagen I stained liver sections from olive oil-treated (control), vehicle- and Avagacestat-treated CCl4 mice. Quantitative gene expression analysis of (G) collagen I (Col1A1) and (H) Sox9 in the livers of different treated groups. Bars represent mean ± SEM of n = 5. #p < 0.05, ##p < 0.01 denotes significance versus respective olive-oil treated control group; *p < 0.05, **p < 0.01 denotes significance versus CCl4-treated vehicle group.
Figure 7
Figure 7. Effect of Notch inhibition on HSC activation in CCl4-induced acute liver injury.
(A) Representative photomicrographs (200 μm) and (B) quantitative histological analysis of α-SMA and Desmin stained liver sections from olive oil-treated (control), vehicle- and Avagacestat-treated CCl4 mice. (C) Quantitative gene expression analysis of α-SMA, Desmin and Vimentin in the livers of different treated groups. Bars represent mean ± SEM of n = 5. ##p < 0.01 denotes significance versus respective olive-oil treated control group; *p < 0.05, **p < 0.01 denotes significance versus CCl4-treated vehicle group.
Figure 8
Figure 8. Effect of Avagacestat on macrophage polarization in CCl4-induced early liver fibrosis.
(A) Representative photomicrographs (200 μm) and (B) quantitative histological analysis of MHC-II and YM1 stained liver sections from olive oil-treated (control), vehicle- and Avagacestat-treated CCl4 mice. (C) Quantitative gene expression analysis of NOS2 and Arginase I in the livers of different treated groups. Bars represent mean ± SEM of n = 5. #p < 0.05 denotes significance versus respective olive oil treated control group; *p < 0.05 denotes significance versus CCl4-treated vehicle group.

References

    1. Friedman S. L. Hepatic fibrosis—overview. Toxicology 254, 120–129, 10.1016/j.tox.2008.06.013 (2008). - DOI - PubMed
    1. Hernandez-Gea V. & Friedman S. L. Pathogenesis of liver fibrosis. Annu. Rev. Pathol. 6, 425–456, 10.1146/annurev-pathol-011110-130246 (2011). - DOI - PubMed
    1. Schuppan D. & Afdhal N. H. Liver cirrhosis. Lancet 371, 838–851, 10.1016/S0140-6736(08)60383-9 (2008). - DOI - PMC - PubMed
    1. Gressner O. A., Weiskirchen R. & Gressner A. M. Evolving concepts of liver fibrogenesis provide new diagnostic and therapeutic options. Comp. Hepatol. 6, 7, 10.1186/1476-5926-6-7 (2007). - DOI - PMC - PubMed
    1. Trautwein C., Friedman S. L., Schuppan D. & Pinzani M. Hepatic fibrosis: Concept to treatment. J. Hepatol. 62, S15–S24, 10.1016/j.jhep.2015.02.039 (2015). - DOI - PubMed

Publication types

MeSH terms