. 2015 Dec 14:5:18193.
doi: 10.1038/srep18193.

RNA-mediated paternal heredity of diet-induced obesity and metabolic disorders

Affiliations

RNA-mediated paternal heredity of diet-induced obesity and metabolic disorders

Valérie Grandjean et al. Sci Rep. .

Abstract

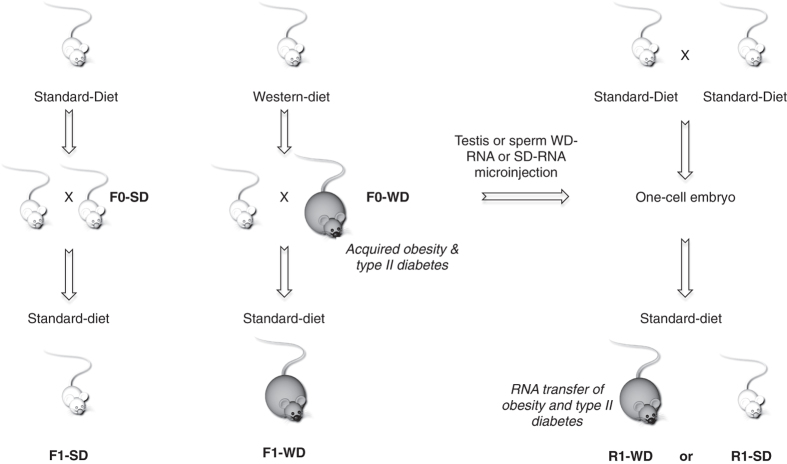
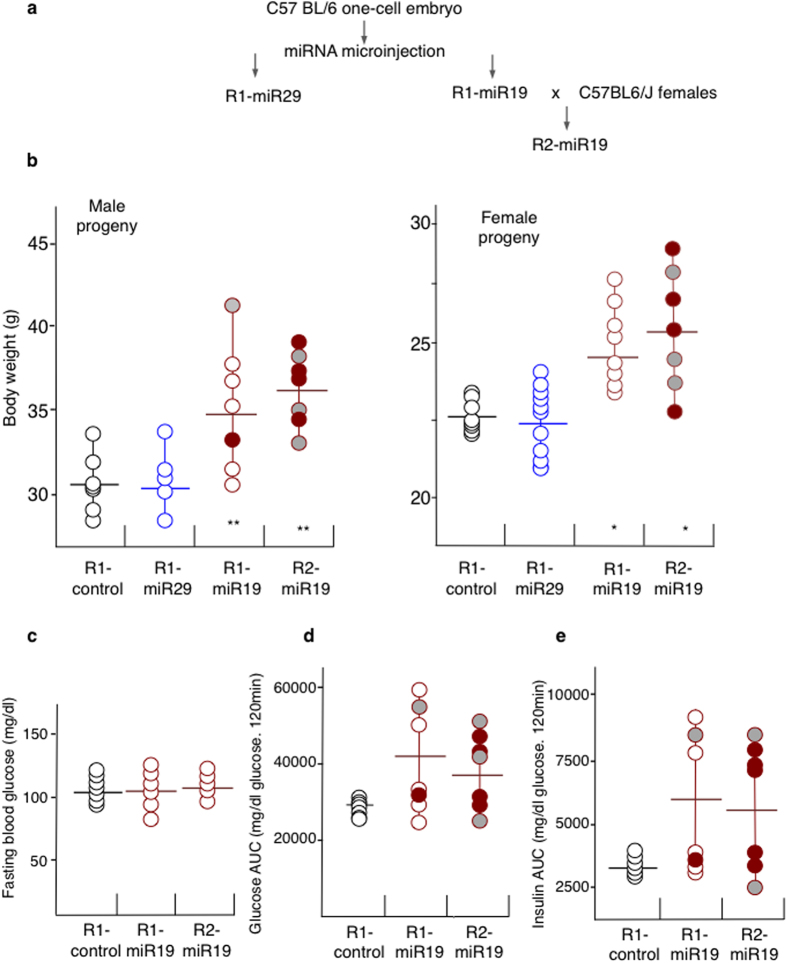
The paternal heredity of obesity and diabetes induced by a high-fat and/or high-sugar diet (Western-like diet) has been demonstrated through epidemiological analysis of human cohorts and experimental analysis, but the nature of the hereditary vector inducing this newly acquired phenotype is not yet well defined. Here, we show that microinjection of either testis or sperm RNA of male mice fed a Western-like diet into naive one-cell embryos leads to the establishment of the Western-like diet-induced metabolic phenotype in the resulting progenies, whereas RNAs prepared from healthy controls did not. Among multiple sequence differences between the testis transcriptomes of the sick and healthy fathers, we noted that several microRNAs had increased expression, which was of interest because this class of noncoding RNA is known to be involved in epigenetic control of gene expression. When microinjected into naive one-cell embryos, one of these small RNA, i.e., the microRNA miR19b, induced metabolic alterations that are similar to the diet-induced phenotype. Furthermore, this pathological phenotype was inherited by the offspring after crosses with healthy partners. Our results indicate that acquired food-induced trait inheritance might be enacted by RNA signalling.


Figures

Figure 1
Figure 1. Experimental procedure.
(Left part of the panel) 3-week-old C57Bl/6 male mice (F0 mice, Charles River) were divided into two groups. One group (F0-SD) was kept on a standard chow diet (SD) and the other one (F0-WD) was fed a western-like diet (WD) containing 17% casein, 0.3% DL-methionine, 34% sucrose, 14.5% cornstarch, 0.2% cholesterol, 5% cellulose, 7% CM 205B, 1% vit200 and 21% butter. At 16 weeks of age, they were crossed with females that were fed standard diet. The resulting F1 progeny were also fed standard diet. (Right part of the panel) Testis and sperm RNAs, extracted from males raised on either a standard (F0-SD) or western-like diet (F0-WD), were injected into C57BL/6 fertilised eggs collected after normal ovulation, as previously described. After reimplantation in foster mothers, half of the treated eggs developed into normal embryos, designated as the R1 generation. All mice were raised on a standard diet except for the F0-WD males.
Figure 2
Figure 2. Multiple metabolic alterations in F0 males exposed to western-like diet.
(a) Body weight of male mice on a control or high-fat diet was measured at 4 months (means ± sem, n = 10 for each group). Males fed a western-fat diet were significantly heavier than the controls. (b) Blood glucose tolerance test for 16-week-old males (n = 9 and 10, respectively). Mice were fasted for 12 h before beginning the experiment. Baseline glucose measurements were analysed from tail blood before intra-peritoneal glucose injection (2 mg/g body weight) using the OneTouch Vita system (LifeScan, Johnson & Johnson). Blood glucose measurements were taken from tail blood at 0 min, 15 min, 30 min, 60 min, 90 min and 120 min after injection. (c) Blood glucose levels during insulin tolerance test on males at 16 weeks (1 U/kg, n = 9 and 10, respectively. Mice were fasted for 12 h before intra-peritoneal insulin injection (NovoRapid, Novo Nordisk) diluted to 0.08 mU/μl in sterile saline for a final delivery concentration of 0.8 mU/g body weight. Glucose measurements were analyzed as above from tail blood at 0 min, 15 min, 30 min, 45 min and 90 min after injection. White and black circles correspond to mice raised on SD and WD, respectively.
Figure 3
Figure 3. RNA-mediated inheritance of metabolic features of males raised on Western-like diet.
Mice were raised on a standard diet except the F0-WD males. Body weights of male (a) and female (b) derived from either F0-WD or F0-SD fathers or from micro-injected one-cell embryos. (c) Fasting blood glucose levels measured as described in Materials and Methods. Areas under the curve (AUC) of the intra-peritoneal glucose tolerance test (AUC-GTT) and of the insulin tolerance test (AUC-ITT) were calculated using the trapezoidal rule in order to be able to distinguish the response to either glucose (d) or insulin (e) injections of each mouse individually. All values were recorded at four months of age. F0-SD mice (n = 10); open black circles), F0-WD mice (n = 10; filled black circles). F1-SD (n = 6; open blue circles) and F1-WD (n = 10; filled blue circles) progenies correspond to mice obtained from natural crosses between normal females and males raised on either S or W Diet, respectively. R1-SD (n = 10; open red circles), R1-WD-testis (n = 12; filled red circles) and R1-WD-sperm (n = 10; shaded red circles) correspond to mice derived from fertilised embryos microinjected with SD-RNA testis, WD-RNA testis or WD-RNA sperm, respectively. **p < 0.01.
Figure 4
Figure 4. Injections of miR-19b into one-cell embryos induced obesity and aspects of the diabetic phenotype.
(a) miR-19b and miR-29a were microinjected into one-cell embryos and the derived mice were named R1-miR19 or R1-miR29, respectively. At 16 weeks of age, two R1-miR19 male were crossed with females to obtain the R2-miR19 progeny. All mice were fed a Standard diet. (b) Body weights of 4-month-old males and females derived from the microinjection of no-RNA (R1-control; black circles), miR-29 (R1-miR29, n = 15; blue circles) or miR-19b microRNA (R1-miR19 (n = 7) and R2-miR19 (n = 7); red circles) into one-cell embryos. All mice were raised on the standard diet. (c) Fasting blood glucose levels. (d) Area under the curve of blood glucose after a glucose tolerance test. (e) The area under the curve of blood glucose during an insulin tolerance test on males at 16 weeks is shown. The areas under the curve (AUC-GTT) during the glucose tolerance test and during the insulin tolerance test (AUC-ITT) were calculated using the trapezoidal rule. The R1-miR19 fathers and their respective R2-miR19 progenies are indicated by grey-filled or red-filled circles.

References

    1. Chen L., Magliano D. J. & Zimmet P. Z. The worldwide epidemiology of type 2 diabetes mellitus–present and future perspectives. Nat Rev Endocrinol 8, 228–236 (2012). - PubMed
    1. Painter R. C. et al. Transgenerational effects of prenatal exposure to the Dutch famine on neonatal adiposity and health in later life. BJOG : an international journal of obstetrics and gynaecology 115, 1243–1249 (2008). - PubMed
    1. Veenendaal M. V. et al. Transgenerational effects of prenatal exposure to the 1944-45 Dutch famine. BJOG : an international journal of obstetrics and gynaecology 120, 548–553 (2013). - PubMed
    1. Kaati G., Bygren L. O., Pembrey M. & Sjostrom M. Transgenerational response to nutrition, early life circumstances and longevity. Eur J Hum Genet 15, 784–790 (2007). - PubMed
    1. Ng S. F. et al. Chronic high-fat diet in fathers programs beta-cell dysfunction in female rat offspring. Nature 467, 963–966 (2010). - PubMed

Publication types