. 2015 Dec 10:5:17326.
doi: 10.1038/srep17326.

Corresponding morphological and molecular indicators of crude oil toxicity to the developing hearts of mahi mahi

Affiliations

Corresponding morphological and molecular indicators of crude oil toxicity to the developing hearts of mahi mahi

Richard C Edmunds et al. Sci Rep. .

Abstract

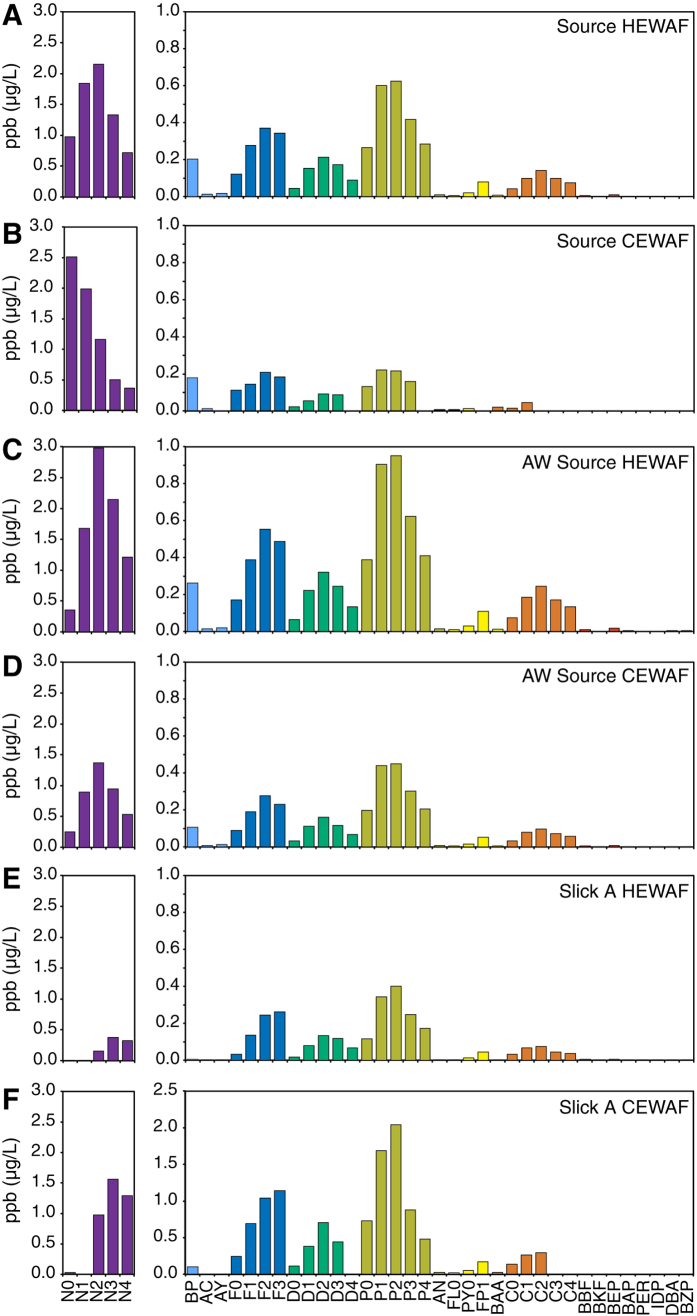
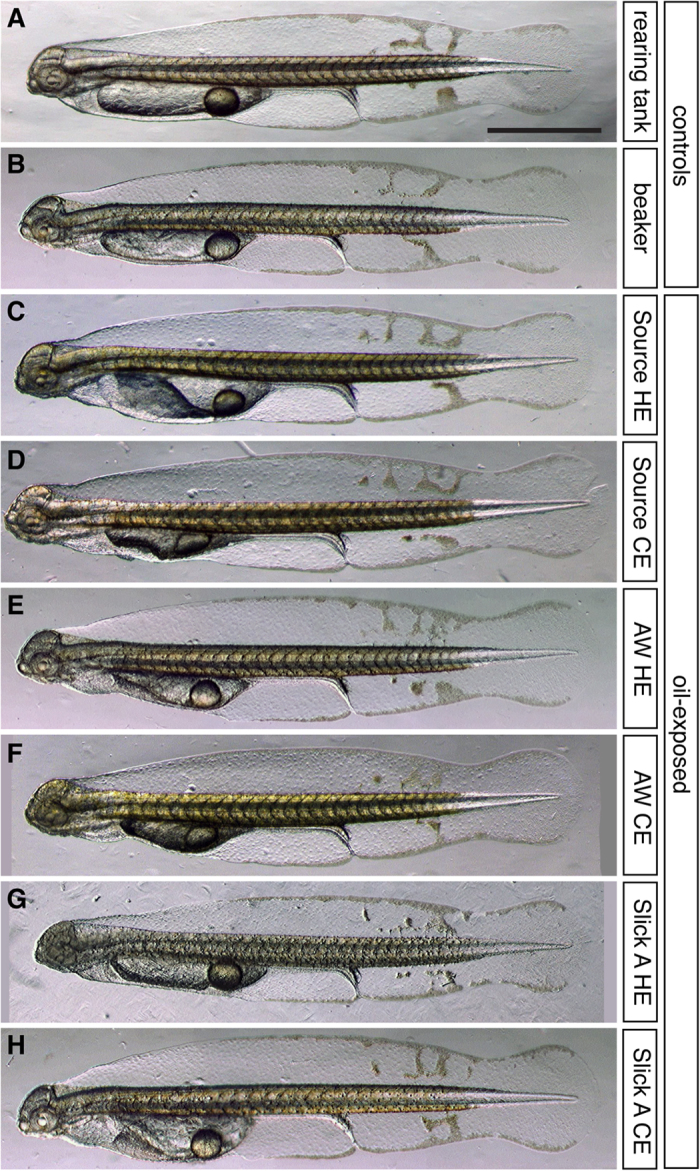
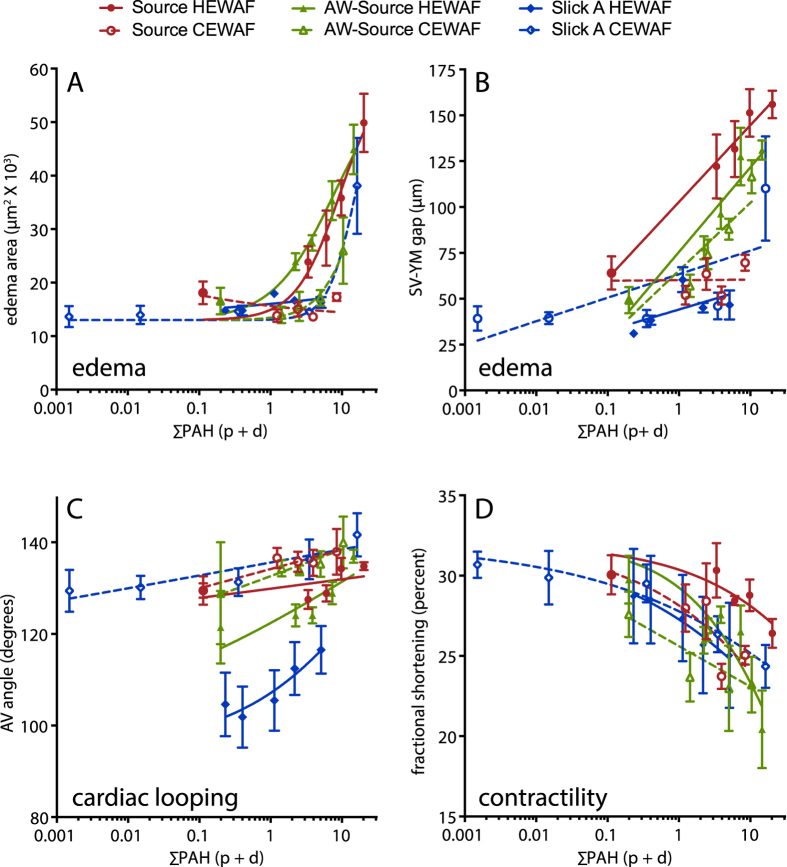
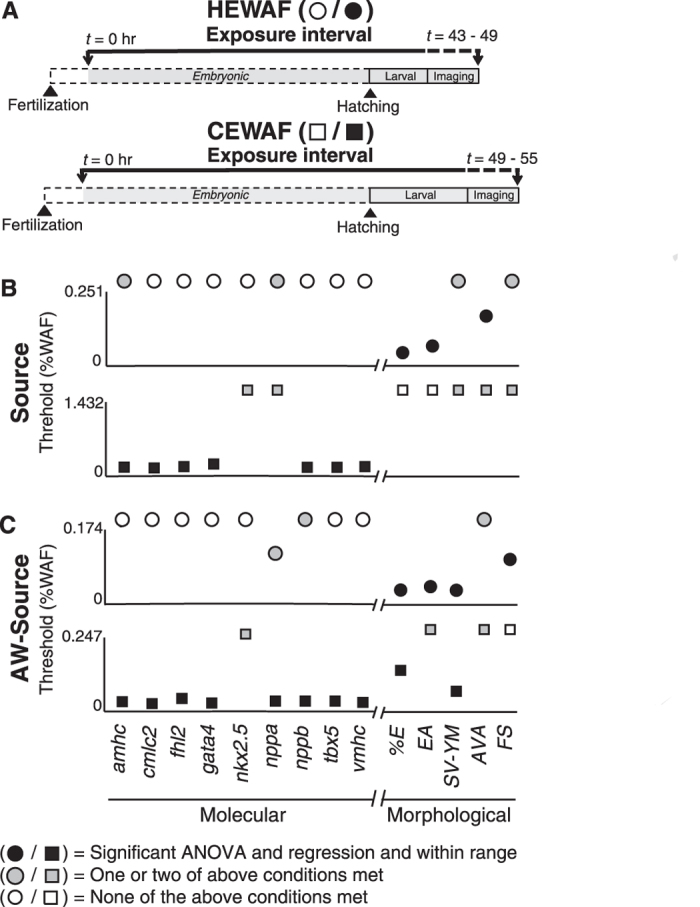
Crude oils from distinct geological sources worldwide are toxic to developing fish hearts. When oil spills occur in fish spawning habitats, natural resource injury assessments often rely on conventional morphometric analyses of heart form and function. The extent to which visible indicators correspond to molecular markers for cardiovascular stress is unknown for pelagic predators from the Gulf of Mexico. Here we exposed mahi (Coryphaena hippurus) embryos to field-collected crude oil samples from the 2010 Deepwater Horizon disaster. We compared visible heart defects (edema, abnormal looping, reduced contractility) to changes in expression of cardiac-specific genes that are diagnostic of heart failure in humans or associated with loss-of-function zebrafish cardiac mutants. Mahi exposed to crude oil during embryogenesis displayed typical symptoms of cardiogenic syndrome as larvae. Contractility, looping, and circulatory defects were evident, but larval mahi did not exhibit downstream craniofacial and body axis abnormalities. A gradation of oil exposures yielded concentration-responsive changes in morphometric and molecular responses, with relative sensitivity being influenced by age. Our findings suggest that 1) morphometric analyses of cardiac function are more sensitive to proximal effects of crude oil-derived chemicals on the developing heart, and 2) molecular indicators reveal a longer-term adverse shift in cardiogenesis trajectory.


Figures

Figure 1
Figure 1. PAH concentrations in HEWAF and CEWAF preparations at the onset of mahi mahi embryo exposures.
Values represent single measurements from the highest exposure levels for (A) Source HEWAF, (B) Source CEWAF, (C) AW-Source HEWAF, (D) AW-Source CEWAF, (E) Slick A HEWAF, and (F) Slick A CEWAF. N, naphthalenes; BP, biphenhyl; AC, acenaphthene; AY, acenaphthylene; F, fluorene; D, dibenzothiophene; P, phenanthrene; AN, anthracene; FL, fluoranthene; PY, pyrene; FP, fluoranthenes/pyrenes; BAA, benz[a]anthracene; C, chrysene; BBF, benzo[b]fluoranthene; BKF, benzo[j]fluoranthene/benzo[k]fluoranthene; BEP, benzo[e]pyrene; BAP, benzo[a]pyrene; PER, perylene; IDP, indeno[1,2,3-cd]pyrene, DBA, dibenz[a,h]anthracene/dibenz[a,c]anthracene; BZP, benzo[ghi]perylene. Parent compound is indicated by a 0 (e.g., N0), while numbers of additional carbons (e.g. methyl groups) for alkylated homologs are indicated as N1, N2, etc.
Figure 2
Figure 2. Gross morphology of hatching stage mahi mahi larvae exposed to MC252 HEWAF and CEWAF oil during embryonic development.
Embryos were exposed from shortly after fertilization to at least ~12 h after hatching (i.e., 48–60 hpf). (A,B) Unexposed controls incubated in clean water in a hatchery rearing tank (A) or 1-L beaker (B). (C–H) Representative larvae from the highest exposure levels. (C,D) Source HEWAF (0.25% WAF, 20.3 μg/L ΣPAH) and CEWAF exposed (1.4% WAF, 8.5 μg/L ΣPAH). (E,F) AW-Source HEWAF (0.17% WAF, 14.6 μg/L ΣPAH) and CEWAF exposed (0.25% WAF, 10.5 μg/L ΣPAH). (G,H) Slick A HEWAF (0.15% WAF, 5.1 μg/L ΣPAH) and CEWAF exposed (9.13% WAF, 16.4 μg/L ΣPAH). HE, HEWAF; CE, CEWAF; scale bars, 1 mm.
Figure 3
Figure 3. Morphometric indicators were generally dependent on PAH concentrations.
Edema area (A) and sinus venosus–yolk mass (SV–YM) gap (B) were quantitative measures related to the severity of edema, atrioventricular (AV) angle (C) was a measure of heart morphology (chamber looping), and fractional shortening (D) was a functional measure of contractility based on chamber diameters. All measures were made in digital video frames (see Methods) and plotted with lines representing non-linear (A,D) or linear regression (B,C) models. As described in the text, these regressions were used for graphical representation only and not statistical analyses (e.g., Figs 4 and 5, Supplemental Materials: Table S1). ∑PAH40 concentrations represent actual measured values of HEWAF dilutions including both particulate whole oil and dissolved PAHs. Data are mean ± SEM.
Figure 4
Figure 4. Comparison of threshold %WAF concentrations across molecular and morphometric cardiotoxicity indicators determined by linear regression for Source and AW-Source oils.
(A) Schematic depicting experimental design showing length of exposure, time of hatching, and period of imaging/tissue collection for HEWAF and CEWAF experiments. (B) Threshold %WAF values following exposure to Source 948 HEWAF (0–0.251%; top) and CEWAF (0–1.432%; bottom) preparations. (C) Threshold %WAF values following exposure to AW-Source oil HEWAF (0–0.174%; top) and CEWAF (0–0.247%; bottom) preparations. Molecular (amhc, cmlc2, fhl2, gata4, nkx2.5, nppa, nppb, tbx5, vmhc) and morphological (%E, EA, SV-YM, AVA, FS; see Methods) indicators are presented on left and right of X-axis break, respectively. Circles, HEWAF; squares, CEWAF; filled black symbols met all three of the following conditions: 1) significant one-way ANOVA (p < 0.05), 2) significant log-linear regression (p < 0.05), and 3) threshold %WAF within exposure range empirically tested (e.g., Supplemental Materials: Figure S5A); filled gray symbols met one or two of the above conditions; open symbols met none of the above conditions. Indicators with symbol above Y-axis maximum denotes non-significant log-linear regression (p > 0.05) or threshold %WAF value outside range empirically tested.
Figure 5
Figure 5. Comparison of threshold %WAF concentrations across molecular and morphometric cardiotoxicity indicators determined by linear regression for Slick A oil.
(A) Schematic depicting experimental design showing length of exposure, time of hatching, and period of imaging/tissue collection for HEWAF and CEWAF experiments. (B) Threshold %WAF values following exposure to Slick A HEWAF (0–0.15%; top) and CEWAF (0–9.13%; bottom) preparations. Molecular (amhc, cmlc2, fhl2, gata4, nkx2.5, nppa, nppb, tbx5, vmhc) and morphological (%E, EA, SV-YM, AVA, FS; see Methods) indicators are presented on left and right of X-axis break, respectively. Circles, HEWAF; squares, CEWAF; filled black symbols met all three of the following conditions: 1) significant one-way ANOVA (p < 0.05), 2) significant log-linear regression (p < 0.05), and 3) threshold %WAF within exposure range empirically tested (e.g., Supplemental Materials: Figure S5A); filled gray symbols met one or two of the above conditions; open symbols met none of the above conditions. Indicators with symbol above Y-axis maximum denotes non-significant log-linear regression (p > 0.05) or threshold %WAF value outside range empirically tested.
Figure 6
Figure 6. Expression of molecular cardiotoxicity indicators across developmental time in Control and AW-Source HEWAF exposed mahi mahi larvae.
(A–H,J) Quantitative PCR (qPCR) determined transcript abundance (i.e., Ct values) of nine cardiotoxicity indicator genes (A, amhc; B, cmlc2; C, fhl2; D, gata4; E, nkx2.5; F, nppa; G, nppb; H, tbx5; J, vmhc) and hsp70 (K) as a stress indicator across developmental time (48–58 hpf) in control and 0.10% AW-Source HEWAF exposed larvae. Gene-specific p values are from two-way ANOVA (Supplemental Materials: Table S2) and letter groupings indicate time points with statistically different expression levels (Tukey-Kramer HSD post-hoc, α = 0.05). Presented Ct values were corrected to geometric average of actc1b and rps25 following Reference Residual Normalization. (I) Legend depicting orientation of Y-axes and conversion of Ct to fold-change. Open symbols, control; Filled symbol, exposed. Ct, threshold cycle. Y-axes range 5 cycles or 32-fold. Data are mean ± SEM.
Figure 7
Figure 7. In situ hybridization showing endogenous localization of qPCR amplicon DIG-riboprobes in larval mahi mahi.
Ventricular myosin heavy chain (vmhc) and cardiac myosin light chain 2 (cmlc2) in situs show ventricle- and heart-specific localization, respectively. (A,C) Control larvae exposed to 0.8 μg/L ΣPAH (n = 12). (A′,C′) Larvae exposed to 6.2 μg/L ΣPAH Slick A HEWAF (n = 13). (B,D) Histograms depicting area-corrected mean pixel intensity of ventricle- and cardiac-specific expression of vmhc (B) and cmlc2 (D), respectively. Asterisks denote significant difference between control and HEWAF exposed (Student’s t-test, p < 0.05).

References

    1. Adams J. et al. Identification of compounds in heavy fuel oil that are chronically toxic to rainbow trout embryos by effects-driven chemical fractionation. Environ Toxicol Chem 33, 825–835 (2014). - PubMed
    1. Bornstein J. M. et al. Effects-driven chemical fractionation of heavy fuel oil to isolate compounds toxic to trout embryos. Environ. Toxicol. Chem. 33, 814–824 (2014). - PubMed
    1. Incardona J. P. et al. Aryl hydrocarbon receptor-independent toxicity of weathered crude oil during fish development. Environ. Health Perspect. 113, 1755–1762 (2005). - PMC - PubMed
    1. Incardona J. P., Collier T. K. & Scholz N. L. Defects in cardiac function precede morphological abnormalities in fish embryos exposed to polycyclic aromatic hydrocarbons. Toxicol. Appl. Pharmacol. 196, 191–205 (2004). - PubMed
    1. Brette F. et al. Crude oil impairs cardiac excitation-contraction coupling in fish. Science 343, 772–776 (2013). - PubMed

Publication types