. 2015 Sep;4(9):e334.
doi: 10.1038/lsa.2015.107. Epub 2015 Sep 25.

Visible light optical coherence tomography measures retinal oxygen metabolic response to systemic oxygenation

Affiliations

Visible light optical coherence tomography measures retinal oxygen metabolic response to systemic oxygenation

Ji Yi et al. Light Sci Appl. 2015 Sep.

Abstract

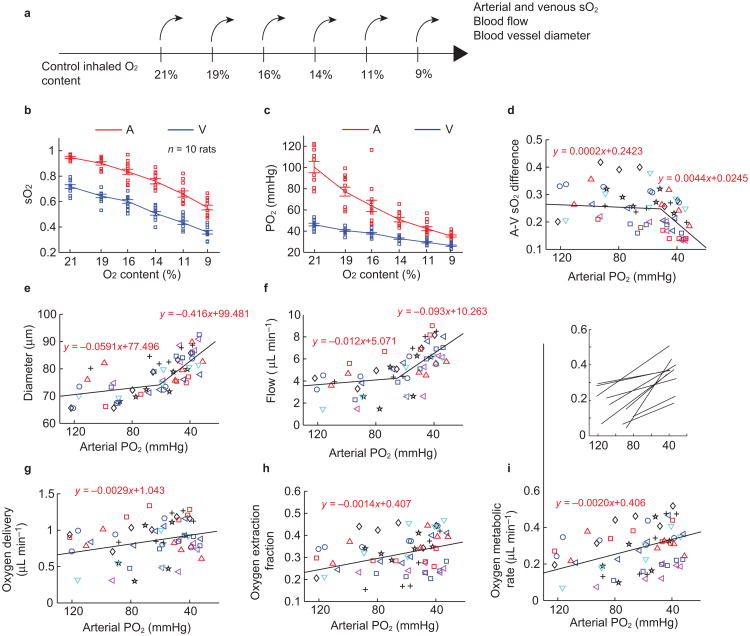
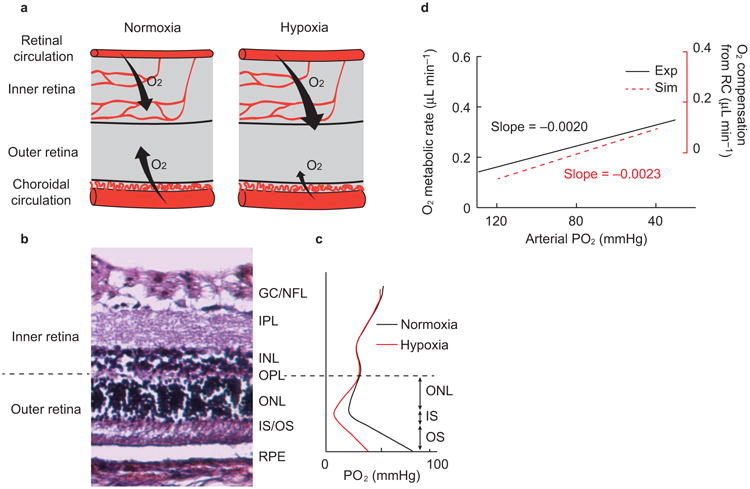
The lack of capability to quantify oxygen metabolism noninvasively impedes both fundamental investigation and clinical diagnosis of a wide spectrum of diseases including all the major blinding diseases such as age-related macular degeneration, diabetic retinopathy, and glaucoma. Using visible light optical coherence tomography (vis-OCT), we demonstrated accurate and robust measurement of retinal oxygen metabolic rate (rMRO2) noninvasively in rat eyes. We continuously monitored the regulatory response of oxygen consumption to a progressive hypoxic challenge. We found that both oxygen delivery, and rMRO2 increased from the highly regulated retinal circulation (RC) under hypoxia, by 0.28 ± 0.08 μL min-1 (p < 0.001), and 0.20 ± 0.04 μL min-1 (p < 0.001) per 100 mmHg systemic pO2 reduction, respectively. The increased oxygen extraction compensated for the deficient oxygen supply from the poorly regulated choroidal circulation. Results from an oxygen diffusion model based on previous oxygen electrode measurements corroborated our in vivo observations. We believe that vis-OCT has the potential to reveal the fundamental role of oxygen metabolism in various retinal diseases.

Keywords: oxygen metabolism; retinal circulation; visible light optical coherence tomography.


Figures

Figure 1
Figure 1
Principle of vis-OCT retinal imaging. (a) Illustration of vis-OCT system. A laser beam with a bandwidth from 520 nm to 630 nm was focused onto the retina. The reflected light interferes with the reference light, and the interference spectral fringes were collected by a home-built spectrometer. The interference spectral fringes were used to reconstruct the echo reflected from different depths of the retina. As the focal point was scanned across the retina by galvo mirrors, the 3D retinal structure was obtained. Further post-processing calculated the rMRO2 and produced the retinal microangiogram. (b) Example of a wide-field view of retinal microvasculature imaged by vis-OCT. (c–d) Magnified view of the highlight squared areas in the panel b. The arrows highlight the smallest capillary vessels. Bar: 200 μm.
Figure 2
Figure 2
Validation of blood flow and sO2 measurements in vivo using vis-OCT. (a) Illustration of scanning pattern for flow measurement. Two concentric circular trajectories around the optic disk scan cross all the major retinal blood vessels. (b) Pulsatile flow pattern from arterioles and the simultaneous recorded EKG signal. (c) Fourier transform of the pulsatile flow pattern from all arterioles showing the heart rate. (d) Correlation of arterial sO2 measurement by vis-OCT (y-axis) and spO2 measured by a pulse oximetry (x-axis). Measurements from different rats were labeled with different markers (n = 4 rats). Each vis-OCT sO2 was averaged from all the major arteries. Solid line plots the linear regression from all the data. Dashed line plots the ideal (unity slope) correlation line. (e) Variations in arterial (n = 5) and venous (n = 5) sO2 responding to the changing oxygen content of the inhaled air. Error bar = SEM.
Figure 3
Figure 3
Retinal vasculature diameter variation under hypoxia. (a–b) Mean intensity projection images around the optic disk under normoxia and hypoxia, respectively. The insets show pseudo-colored microvasculature images. (c) Comparison of average diameters of major arterioles (A) and veins (V) under normoxia and hypoxia (n = 33 from six rats). Error bar = SEM. (d) Magnified view of the inset in the panel a. (e) Magnified view of the inset in the panel b. (f) Comparison of the arteriole diameters highlighted in both panels d and e under normoxia and hypoxia. Bar: 200 μm. **p < 0.01 from two sample t-test.
Figure 4
Figure 4
Retinal oxygen consumption derived from retinal circulation in responding to systemic oxygen tension variation. (a) Progressive hypoxia challenge procedure. The oxygen content in the inhaling gas was reduced gradually in six steps from 21% to 9%. Arterial and venous sO2, blood flow, and blood vessel diameter were directly measured at each step. Arteriovenous sO2 difference, oxygen delivery, oxygen extraction fraction of retinal tissue, and rMRO2 were further calculated. (b) and (c) are sO2 and oxygen tension (PO2) changes under reduced oxygen content (red-arterial, blue-venous), respectively. The corresponding progression of (d) arteriovenous oxygenation difference, (e) average diameter of major retinal blood vessels, (f) retinal blood flow, (g) oxygen delivery from arterial vessels, (h) oxygen extraction fraction, and (i) retinal oxygen metabolism from retinal circulation. The solid lines in (d–i) are linear regressions from the scatter plots. Different rats were labeled with different markers (n = 10 rats). In i, regression lines for each rat are shown in the inset on the same axis as the main figure.
Figure 5
Figure 5
Balance of oxygen supplies between retinal and choroidal circulations under hypoxia. (a) Under systemic hypoxia, the retinal circulation provides more oxygen to the outer retina to compensate the deficit from the choroidal circulation. (b) Anatomical structure of a rat retina. The retinal pigment epithelium (RPE) resides beneath the neural retina, which consists of several defined layers: the outer (OS) and inner segment (IS) of the photoreceptor, and the outer nuclear layer (ONL), outer plexiform layer (OPL), inner nuclear layer (INL), inner plexiform layer (IPL), ganglion cell (GC), and nerve fiber layer (NFL). The boundary between the inner retina and outer retina is the OPL. (c) Simulated PO2 profile across the retina (Supplementary Fig. S9). The inner retinal PO2 is assumed to be constant under the level of hypoxia used here, while the outer retinal PO2 profile changes. The majority of the oxygen is consumed in the IS, where the PO2 reaches a minimum in the outer retina. The oxygen diffuses from both the choroidal and retinal circulations, forming two PO2 gradients toward the IS. This distinct PO2 profile in three segments in the outer retina can be modeled by a one-dimensional oxygen diffusion model. (d) Comparison of the oxygen metabolism from experimental observation and simulation. The experimental oxygen metabolic rate is re-plotted from Figure 4i.

References

    1. Hammes HP. Pericytes and the pathogenesis of diabetic retinopathy. Horm Metab Res. 2005;37:39–43. - PubMed
    1. Mozaffarieh M, Grieshaber MC, Flammer J. Oxygen and blood flow: players in the pathogenesis of glaucoma. Mol Vis. 2008;14:224–233. - PMC - PubMed
    1. Nowak JZ. Age-related macular degeneration (AMD): pathogenesis and therapy. Pharmacol Rep. 2006;58:353–363. - PubMed
    1. Caprara C, Grimm C. From oxygen to erythropoietin: relevance of hypoxia for retinal development, health and disease. Prog Retin Eye Res. 2012;31:89–119. - PubMed
    1. Lange CA, Bainbridge JW. Oxygen sensing in retinal health and disease. Ophthalmologica. 2012;227:115–131. - PubMed