. 2015 Dec 11:5:18046.
doi: 10.1038/srep18046.

Mitotic Spindle Disruption by Alternating Electric Fields Leads to Improper Chromosome Segregation and Mitotic Catastrophe in Cancer Cells

Affiliations

Mitotic Spindle Disruption by Alternating Electric Fields Leads to Improper Chromosome Segregation and Mitotic Catastrophe in Cancer Cells

Moshe Giladi et al. Sci Rep. .

Abstract

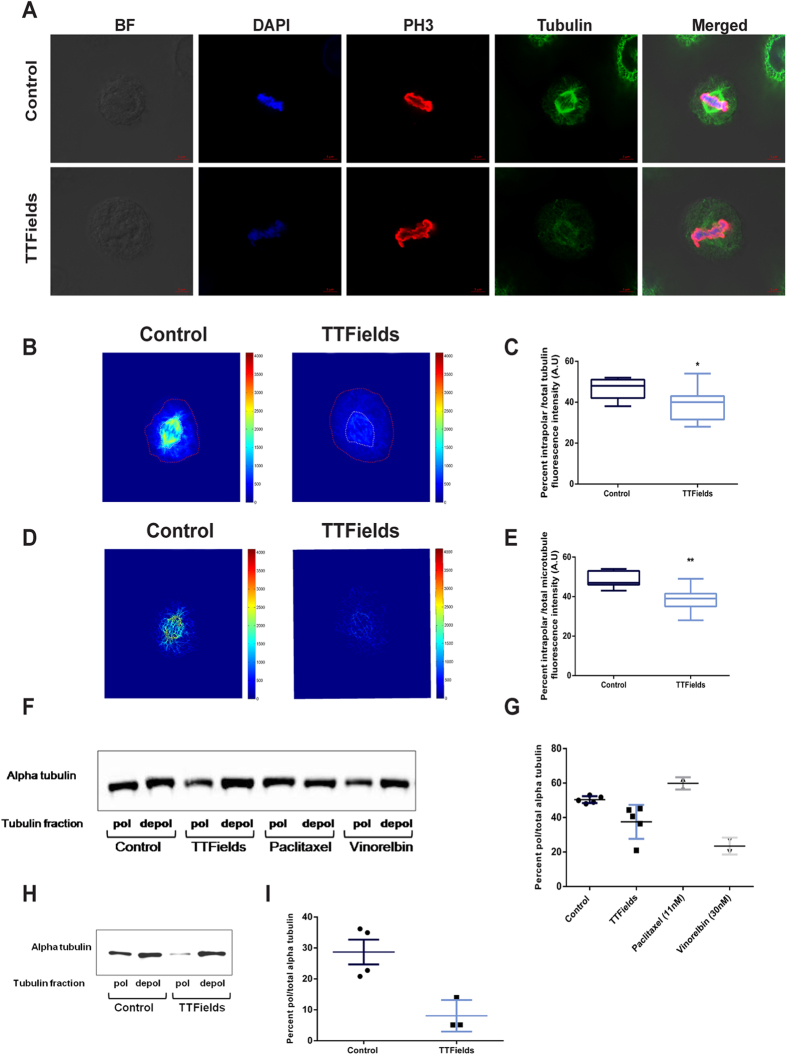
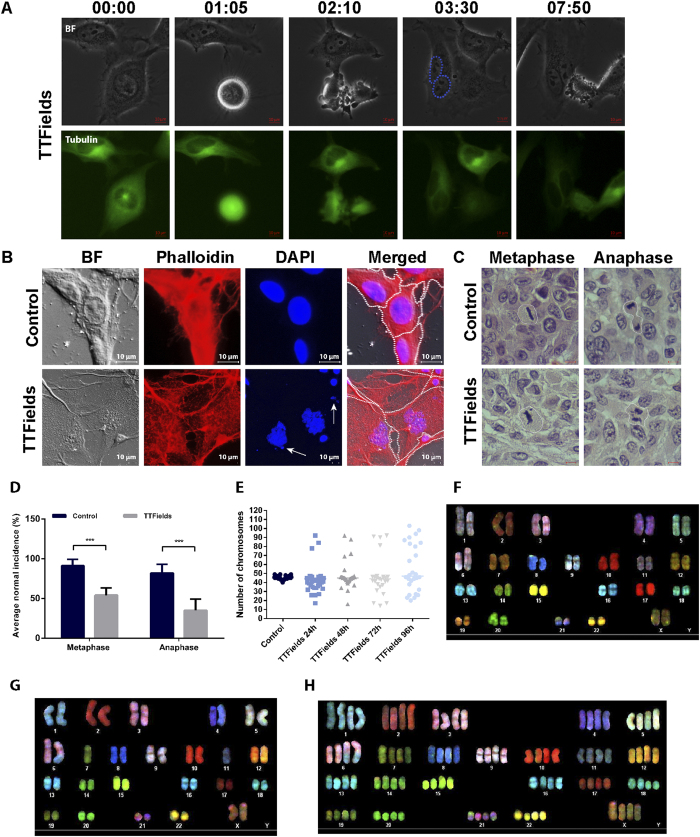
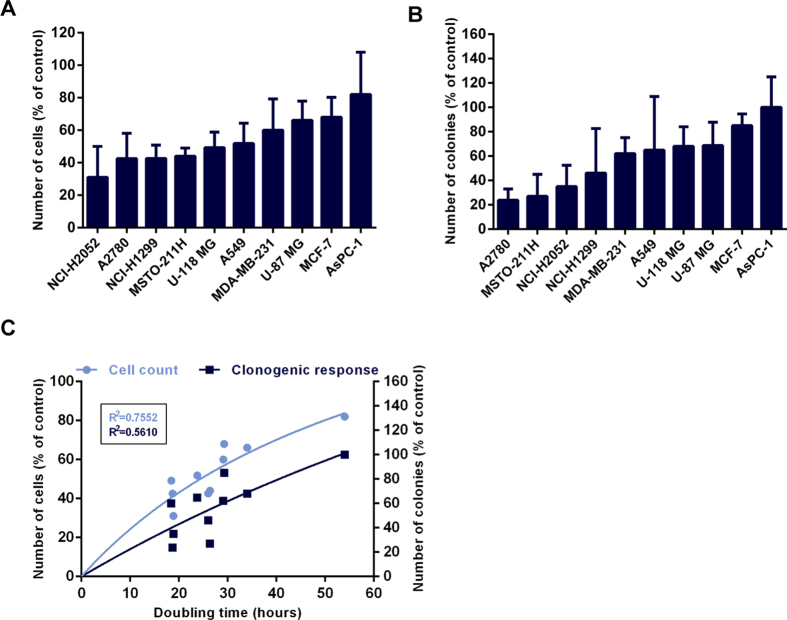
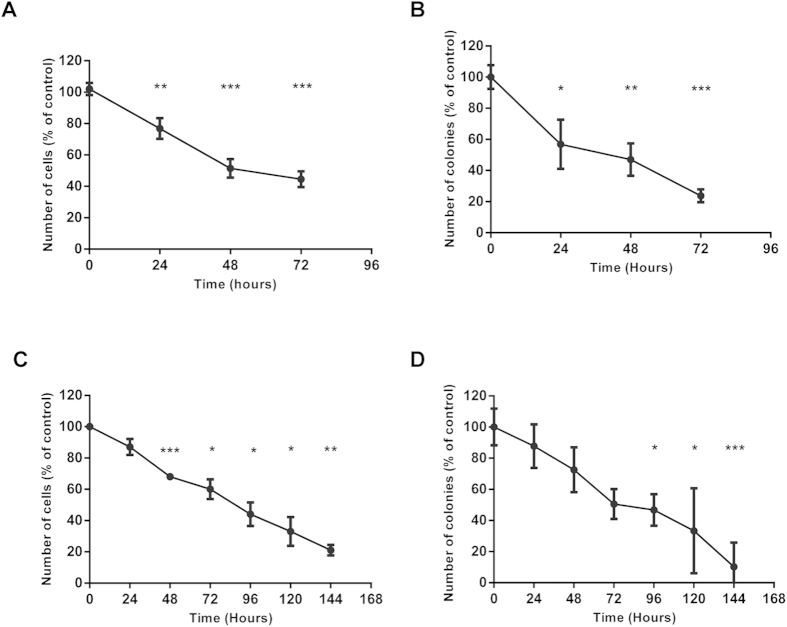
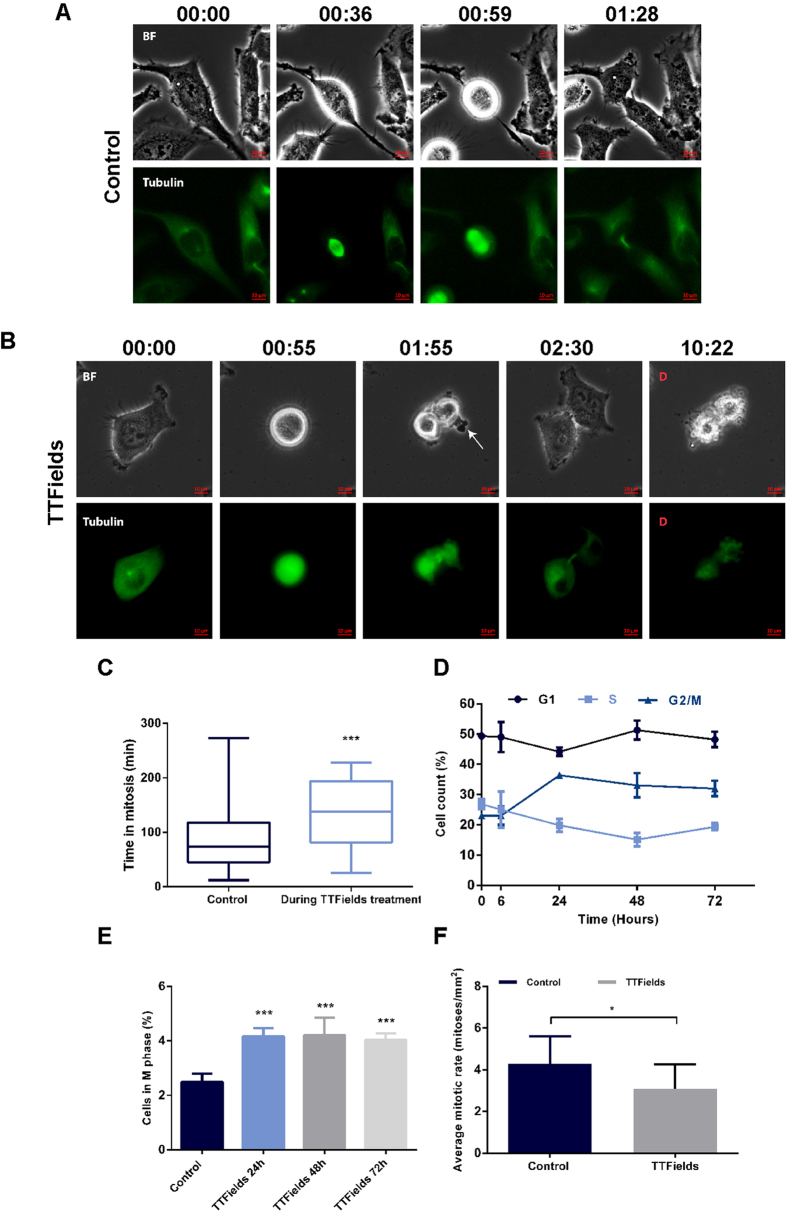
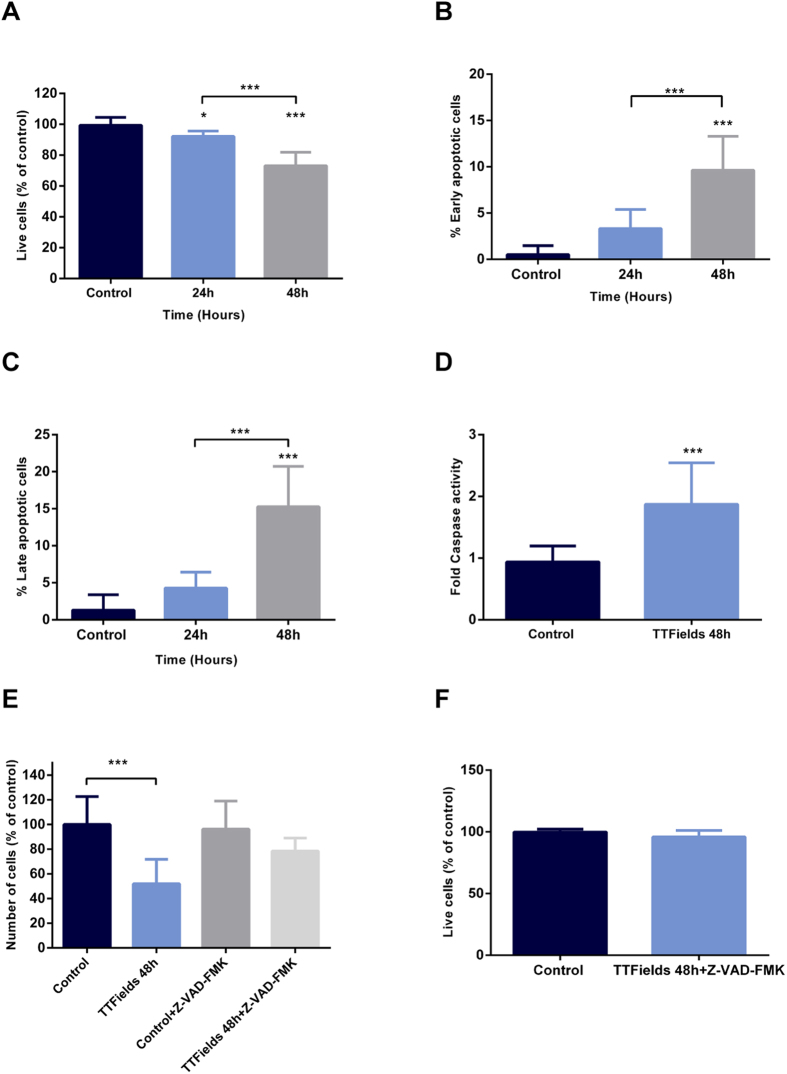
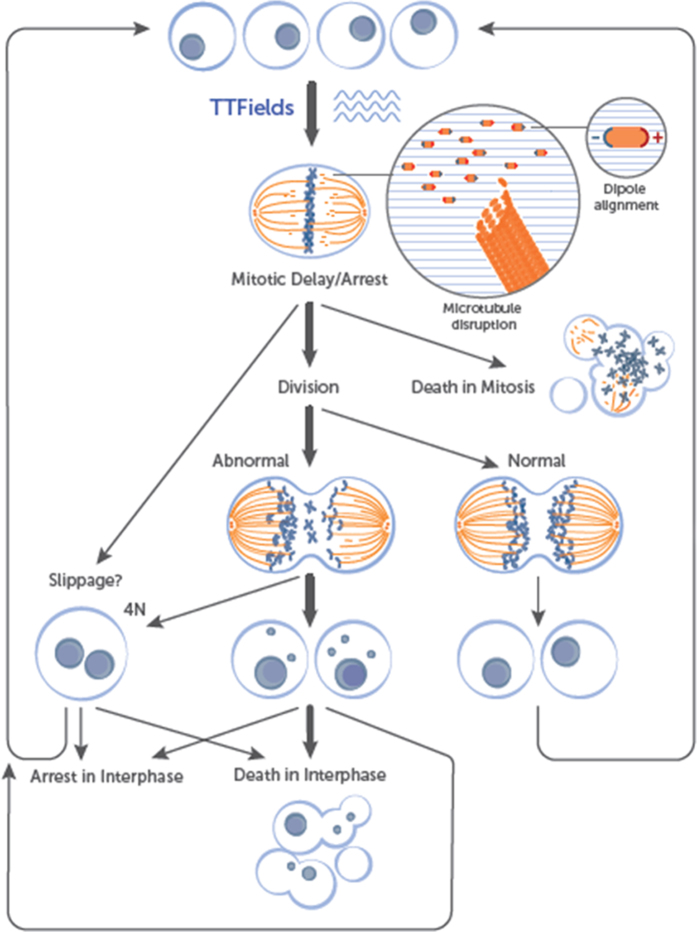
Tumor Treating Fields (TTFields) are low intensity, intermediate frequency, alternating electric fields. TTFields are a unique anti-mitotic treatment modality delivered in a continuous, noninvasive manner to the region of a tumor. It was previously postulated that by exerting directional forces on highly polar intracellular elements during mitosis, TTFields could disrupt the normal assembly of spindle microtubules. However there is limited evidence directly linking TTFields to an effect on microtubules. Here we report that TTFields decrease the ratio between polymerized and total tubulin, and prevent proper mitotic spindle assembly. The aberrant mitotic events induced by TTFields lead to abnormal chromosome segregation, cellular multinucleation, and caspase dependent apoptosis of daughter cells. The effect of TTFields on cell viability and clonogenic survival substantially depends upon the cell division rate. We show that by extending the duration of exposure to TTFields, slowly dividing cells can be affected to a similar extent as rapidly dividing cells.


Conflict of interest statement

We wish to disclose that Yoram Palti holds stock in Novocure Ltd. All other authors, except Yoram Palti are paid employees of Novocure. There are no other known conflicts of interest associated with this publication.

Figures

Figure 1
Figure 1. TTFields Treatment Induce Severe Mitotic Spindle Damage in Cancer Cell Lines.
(A–C) A549 cells were treated with TTFields for 24 hours. (A) Confocal fluorescence microscopy images of: Upper panel- normal metaphase alignment of chromosomes in control cell, Lower panel: metaphase alignment in TTFields treated cell. Blue, Dapi-stained DNA; Red, Phospho Histone 3 (PH3) stained chromosomes during mitosis; green, tubulin. The scale bar represents 5 μm. (B) Tubulin fluorescence images were inverted and pseudocolored so that increasing fluorescence intensity is indicated from blue to red (scale bar represent arbitrary units). Dashed lines define the region between the two spindle poles (white) and overall tubulin fluorescence within the cell (Red). (C) Box-and-whiskers plots show the percentage of fluorescence intensity defined by the spindle and poles in relation to the total sum of tubulin fluorescence within the cell. The boxes show the mean and the interquartile ranges, while the whiskers show the full range. (D) Z-stack based 2D visualization of the mitotic spindle structure in each cell following enhancement of the cytoskeletal filament networks. (E) Box-and-whiskers plots show the percentage of fluorescence intensity defined by the spindle and poles in relation to the total sum of microtubule fluorescence within the cell. (F,G) In a separate experiment cell lysates of A2780 cells were collected following 48 hours treatment with TTFields. (F) Immunoblot of polymerized (pol) and depolymerized (depol) tubulin fractions were compared to untreated cells and cells treated with paclitaxel or vinorelbin. (G) Graph represents the percentages of polymerized microtubules in relation to total tubulin. Horizontal bars indicate mean values with SD. (H) Immunoblot of polymerized (pol) and depolymerized (depol) tubulin fractions of cells treated with TTFields for 10 hours were compared to untreated cells, 16 hours after re-plating. (I) Graph represents the percentages of polymerized microtubules in relation to total tubulin. Horizontal bars indicate mean values with SD. 0.05 > *p > 0.01 and **p < 0.01 from control group.
Figure 2
Figure 2. TTFields Application Induce the Formation of Multinuclear Cells and Chromosome Aneuploidy.
(A) Phase-contrast and fluorescent time-lapse analysis of nuclei formation in TTFields treated Tubulin-GFP HeLa cells. Dashed line defines cell nuclei following division. Numbers show elapsed time (hour:minute). The scale bar represents 10 μm. In a separate experiment, U-87 MG cells were treated with TTFields for 72 hours. (B) Upper panel, U-87 MG control cells. Lower panel, TTFields treated cells. Arrow indicates micronuclei structures. Blue, Dapi-stained DNA; Red, Phalloidin-stained Actin. The scale bar represent 10 μm. Dashed line defines cell boundaries. (C,D) Fischer rats inoculated intracranially with F-98 glioma cells were treated with 200 kHz TTFields for 7 days, 1 week after tumor inoculation. At the end of treatment, tumors were removed and evaluated for atypical mitotic figures. (C) Representative images of mitotic figures. White lines encircle mitotic cells. The scale bar represent 5 μm. (D) Quantification of normal mitotic figures is expressed as percentage. At least 120 cells in metaphase or anaphase were analyzed in each group. ***p < 0.001 from control group. (E) A2780 cells were treated with TTFields for 96 hours. Chromosome number was evaluated every 24 hours. Horizontal bars indicate median values (p < 0.0001 ; Brown-Forsythe test). (F–H) Spectral karyotyping of A2780 cells (46, xx, der(6)t(1;6)) showing numerical aberrations following TTFields treatment. (F) Control.(G) Hypodiploidy following treatment. (H) Tetraploidy following treatment.
Figure 3
Figure 3. TTFields Treatment Efficacy Is Cell Doubling Time Dependent.
Comparison of cell lines response to TTFields treatment. Cells were treated with TTFields for 72 hours at optimal frequency (Table 1). (A) Effect of TTFields treatment on cell count of various cancer cell lines. (B) Clonogenic survival of various cancer cell lines following TTFields treatment. (C) Correlation between cell doubling time and cell count (p = 0.008) and clonogenic response (p = 0.023) following TTFields treatment.
Figure 4
Figure 4. TTFields Treatment Efficacy is Dependent on Treatment Duration.
(A,B) A2780 cells were treated with TTFields for 72 hours. (A) Effect of TTFields treatment on number of A2780 cells. (B) Clonogenic survival of A2780 cells following TTFields treatment. (C,D) In a separate experiment, U-87 MG cells were treated with TTFields for 144 hours. (C) Effect of TTFields treatment on number of U-87 MG cells. (D) Clonogenic survival of U-87 MG cells following TTFields treatment. 0.05 > *p > 0.01, **p < 0.01, and ***p < 0.001 from control group.
Figure 5
Figure 5. Mitotic Arrest and Mitotic Cell Death Are Possible Outcomes of TTFields Treatment.
(A–C) Phase-contrast and fluorescent time-lapse analysis of mitosis in Tubulin-GFP HeLa cells. (A) Control cells. (B) TTFields treated cells (8 h). Numbers show elapsed time relative to entry to mitosis (hour: minute). Arrow indicates membrane blebbing. Cell death is indicated as D. The scale bar represents 10 μm. (C) Box-and-whiskers plots show the time that cells spent arrested in mitosis. The boxes show the mean and the interquartile ranges, while the whiskers show the full range. (D,E) In a separate experiment, A2780 cells were treated with TTFields for 72 hours. (D) Cell cycle analysis was performed using flow cytometry. (E) Graph represents the change in percentage of A2780 cells in M phase following TTFields application. (F) Fischer rats inoculated intracranially with F-98 glioma cells were treated with 200 kHz TTFields for 7 days 1 week after tumor inoculation. At the end of treatment, tumors were removed and evaluated for average mitotic rate. 0.05 > *p > 0.01, ***p < 0.001 from control group.
Figure 6
Figure 6. TTFields Kill Cancer Cells by Triggering Caspase Mediated Apoptosis.
A2780 cells were treated with TTFields for 48 hours. (A–C) Cell samples were collected and evaluated for apoptosis. (A) Live cells. (B) Early apoptotic cells. (C) Late apoptotic cells. (D) Caspase activity was evaluated using flow cytometry analysis following 48 hours of TTFields application. (E,F) Effect of pan-caspase inhibition by Z-VAD-FMK on A2780 response to TTFields treatment. (E) Evaluation of number of cells (unpaired t-test). (F) Evaluation of apoptosis. 0.05 > *p > 0.01, and ***p < 0.001 from control group.
Figure 7
Figure 7. Effects of TTFields on replicating cells.
TTFields exert directional forces on polar microtubules and interfere with the assembly of the normal mitotic spindle. Such interference with microtubule dynamics results in abnormal spindle formation and subsequent mitotic arrest or delay, possibly due to improper attachment of chromosomes to the spindle fibers. Cells can die while in mitotic arrest, however, a more common outcome (highlighted by bold arrow) is progression to cell division. This can lead to the formation of either normal or abnormal aneuploid progeny. The formation of the tetraploid cells can occur either due to mitotic exit through slippage or can occur during improper cell division. Abnormal daughter cells can die in the subsequent interphase, can undergo a permanent arrest, or can proliferate through additional mitosis where they will be subjected to further TTFields assault.

References

    1. McCaig C. D., Rajnicek A. M., Song B. & Zhao M. Controlling cell behavior electrically: current views and future potential. Physiol. Rev. 85, 943–978 (2005). - PubMed
    1. Markx G. H. The use of electric fields in tissue engineering: A review. Organogenesis 4, 11–17 (2008). - PMC - PubMed
    1. Bassett C. A. The development and application of pulsed electromagnetic fields (PEMFs) for ununited fractures and arthrodeses. Clin. Plast. Surg. 12, 259–277 (1985). - PubMed
    1. Repacholi M. H. & Greenebaum B. Interaction of static and extremely low frequency electric and magnetic fields with living systems: health effects and research needs. Bioelectromagnetics 20, 133–160 (1999). - PubMed
    1. Elson E. Biologic effects of radiofrequency and microwave fields: in vivo and in vitro experimental results in The biomedical engineering handbook (ed. Bronzino J. D.) 1417–1423 (CRC Press, 1995).