. 2015 Dec 9;35(49):16034-45.
doi: 10.1523/JNEUROSCI.1422-15.2015.

MEG Multivariate Analysis Reveals Early Abstract Action Representations in the Lateral Occipitotemporal Cortex

Affiliations

MEG Multivariate Analysis Reveals Early Abstract Action Representations in the Lateral Occipitotemporal Cortex

Raffaele Tucciarelli et al. J Neurosci. .

Abstract

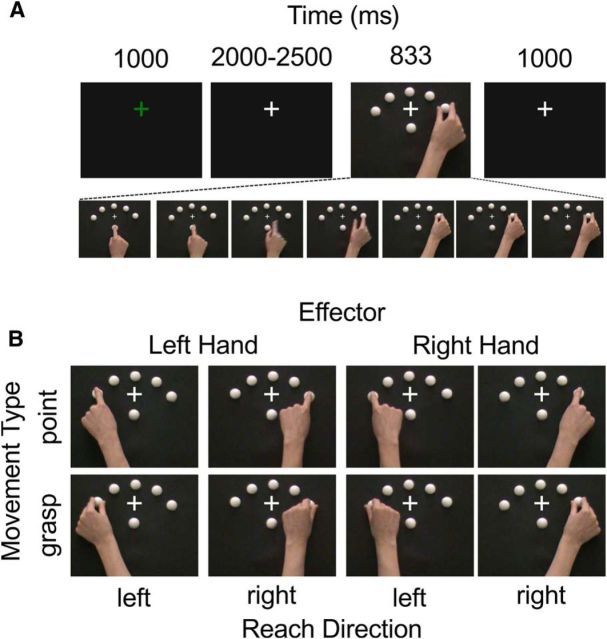
Understanding other people's actions is a fundamental prerequisite for social interactions. Whether action understanding relies on simulating the actions of others in the observers' motor system or on the access to conceptual knowledge stored in nonmotor areas is strongly debated. It has been argued previously that areas that play a crucial role in action understanding should (1) distinguish between different actions, (2) generalize across the ways in which actions are performed (Dinstein et al., 2008; Oosterhof et al., 2013; Caramazza et al., 2014), and (3) have access to action information around the time of action recognition (Hauk et al., 2008). Whereas previous studies focused on the first two criteria, little is known about the dynamics underlying action understanding. We examined which human brain regions are able to distinguish between pointing and grasping, regardless of reach direction (left or right) and effector (left or right hand), using multivariate pattern analysis of magnetoencephalography data. We show that the lateral occipitotemporal cortex (LOTC) has the earliest access to abstract action representations, which coincides with the time point from which there was enough information to allow discriminating between the two actions. By contrast, precentral regions, though recruited early, have access to such abstract representations substantially later. Our results demonstrate that in contrast to the LOTC, the early recruitment of precentral regions does not contain the detailed information that is required to recognize an action. We discuss previous theoretical claims of motor theories and how they are incompatible with our data.

Significance statement: It is debated whether our ability to understand other people's actions relies on the simulation of actions in the observers' motor system, or is based on access to conceptual knowledge stored in nonmotor areas. Here, using magnetoencephalography in combination with machine learning, we examined where in the brain and at which point in time it is possible to distinguish between pointing and grasping actions regardless of the way in which they are performed (effector, reach direction). We show that, in contrast to the predictions of motor theories of action understanding, the lateral occipitotemporal cortex has access to abstract action representations substantially earlier than precentral regions.

Keywords: MVPA; action observation; action understanding; neural dynamics.


Figures

Figure 1.
Figure 1.
Example of a trial sequence and experimental design. A, During MEG recording, N = 17 participants watched video clips of simple reach-to-point or reach-to-grasp movements (duration: 833 ms). Participants were instructed to fixate on a central fixation cross while attentively observing the entire video without performing any movements. To ensure that participants paid attention to the videos, different types of questions were asked during occasional catch trials, which were later discarded from the analysis (see Material and Methods). The green fixation cross indicated the period during which participants were told to blink. Eye movements were recorded using an MEG-compatible eye tracker. B, We used a 2 × 2 × 2 design, manipulating the type of movement (pointing/grasping), reach direction (left/right), and effector (left/right hand) .
Figure 2.
Figure 2.
Feature selection. Schematic representation of the method we adopted for selecting the features used for the multivariate analysis. Here we show one specific step of the algorithm with the selected central sensor (black dotted circle) with one neighboring sensor only (gray dotted circle) for illustrative purpose. A, Time–frequency representations (colors indicate power intensity) in the posterior sensors of the MEG helmet in two conditions of interest (conditions A and B). The arrows starting from the circles indicate the corresponding magnified sensors. B, Enlarged views of the two example sensors for conditions A and B. The dotted rectangles illustrate an example time–frequency bin (2 neighboring bins per side for the time dimension; 4 neighboring bins per side for the frequency dimension; see Materials and Methods). For feature selection, for each time–frequency bin, we scanned each individual sensor with its 10 neighboring sensors. B shows a matrix representation of the specific sensor/frequency/time bins. C, We then rearranged the dimensions of the matrix from 3D to 1D to obtain the corresponding feature vectors for conditions A and B. The feature vectors were used as input for the decoding analysis over sensors, frequency, and time. Specifically, the feature vectors were partitioned in independent chunks and used for training and testing the classifier. In the depicted example, each feature within the matrices was assigned with a number to show the same feature within the feature vectors for visualization purposes.
Figure 3.
Figure 3.
Behavioral results. Behavioral performance (percentage correct) for categorizing the two observed movements (grasping, pointing) as a function of video duration, collapsed across effector and reach direction. As expected, participants responded more accurately with increasing video duration. Statistical analysis confirmed that participants reached above-chance performance in classifying the two movements from 233 ms onwards (see Material and Methods, Statistical analysis, Behavioral experiment). Each dot represents data from a single participant. The continuous line indicates the linear model that best fits the data.
Figure 4.
Figure 4.
Theta, alpha, and beta band activity during action observation and univariate contrast. A, Time–frequency representation of the difference (expressed in t scores) between grasping and pointing (collapsed across effector and reach direction) for the sensor highlighted in the head model. The four dotted lines indicate the following events, from left to right: (1) video onset, (2) median movement onset, (3) approximate time at which the hand touches the object (∼550 ms), and (4) video offset (833 ms). B, Same as A, but those time–frequency bins that did not survive the permutation test with Monte Carlo and cluster-based method for multiple-comparisons correction were set to zero. C, D, Topography representation of the two frequency bands observed in B. E, Power change during action observation relative to baseline (fixation cross) over a representative sensor. The power change was calculated as (activation − baseline)/baseline, such that 1 indicates 100% increase relative to baseline and −1 indicates 100% decrease relative to baseline. The classical power decrease in alpha and beta bands following observed movement onset (at t = 0 s) is evident.
Figure 5.
Figure 5.
Results of the neural spatiotemporal decoding. To identify abstract action representations of the observed actions (e.g., observing “grasping” regardless of whether it was performed with the left or the right hand), we trained the MVPA classifier to discriminate between pointing and grasping using one effector (e.g., the left hand) and one reach direction (e.g., toward the left), and tested the performance of the classifier using an independent dataset, using pointing and grasping movements performed with the other hand toward the opposite reach direction. We decoded the observed movements over time bins, frequency bins, and sensors using a time–frequency–channel searchlight analysis. A, The lateral plots show the time–frequency representation of the decoding in sensors depicted in the inset topoplots. Reddish colors indicate higher classification. Sensors were selected on the basis of the highest decoding accuracy at the frequency of interest. The central inset shows the two clusters that survived the correction for multiple comparisons (cluster obtained at early time point: 200–600 ms; cluster obtained at late time point: 600–1200 ms). B, Topography of the decoding at 400 ms and low frequencies (6 and 8 Hz; smoothing: 4 Hz). C, Topography of the decoding at 900 ms and higher frequencies (10 and 18 Hz; smoothing: 3 Hz). D, E, Sources accounting for the decoding effect found at sensor level, thresholded to retain only those voxels with the 10% highest decoding accuracies. For sensor-level analysis only, significant differences were computed using permutation analysis and Monte Carlo methods and results are cluster corrected for multiple comparisons. Maps were projected on the population-average, landmark-based, and surface-based atlas (Van Essen, 2005), using Caret software (Van Essen et al., 2001).
Figure 6.
Figure 6.
Maximum accuracy within each region. Within each identified source, the voxel with the maximum mean accuracy was selected and plotted with individual accuracies (black dots). Left MTG, Middle temporal gyrus (MNI: −50, −64, 12); Left SPL, superior parietal lobule (MNI: −20, −56, 48); Right PCG, precentral gyrus (MNI: 28, −6, 28); Right IFG, inferior frontal gyrus (MNI: 20, 24, 28; Table 2).
Figure 7.
Figure 7.
Comparison between univariate and multivariate analyses. Comparison between univariate (top row) and multivariate (bottom row) analyses in two time windows (200–600 and 600–1200 ms). The upper topoplots show the sensors that survived the permutation test when comparing grasping versus pointing (collapsing across effector and reach direction). The lower topoplots show the sensors that survived the permutation test when comparing the observed accuracy of the classifier to distinguish between pointing and grasping (generalizing across effector and reach direction) against chance level (50%). Multivariate analysis was more sensitive in detecting the subtle differences between the neural signals induced by observation of the two movement types in the earlier time window. All shown clusters are corrected for multiple comparisons (p < 0.05).
Figure 8.
Figure 8.
Neural decoding over time. The topoplots show the dynamics of above-chance accuracy (expressed as t scores) of the classifier in discriminating observed grasping and pointing (generalizing across effector and reach direction) for specific frequency bands (theta: 5–7 Hz; low alpha: 7–9 Hz; alpha: 9–11 Hz; beta: 17–19 Hz). A, The earliest significant decoding occurred in the posterior part of the helmet configuration in the lower-frequency bands. B, Decoding in the higher frequency bands was significant at a later latency.
Figure 9.
Figure 9.
Simulation analysis. Illustration how “low” classification accuracy (53.46% for sensor data; 50% is chance level) can be highly significant, using normal distribution probability plots of Monte Carlo-simulated classification accuracy distribution (relative to chance, 50%). The simulation uses the same parameters as those used in the study (17 participants; minimum after-trial rejection: 544 trials per participant; same cross-validation scheme as used in original data). Dependency across cross-validation folds was set to r = 0.3289 (green crosses) to match the value observed in the original data; for comparison, results are also shown for the cases of no dependence (r = 0.00; blue) and full dependence (r = 1.00; orange). The maximum classification accuracy above chance as observed in the original data is indicated by a black line.

Similar articles

Cited by

References

    1. Brainard DH. The psychophysics toolbox. Spat Vis. 1997;10:433–436. doi: 10.1163/156856897X00357. - DOI - PubMed
    1. Buxbaum LJ, Shapiro AD, Coslett HB. Critical brain regions for tool-related and imitative actions: a componential analysis. Brain. 2014;137:1971–1985. doi: 10.1093/brain/awu111. - DOI - PMC - PubMed
    1. Caggiano V, Giese M, Thier P, Casile A. Encoding of point of view during action observation in the local field potentials of macaque area F5. Eur J Neurosci. 2015;41:466–476. doi: 10.1111/ejn.12793. - DOI - PubMed
    1. Caramazza A, Anzellotti S, Strnad L, Lingnau A. Embodied cognition and mirror neurons: a critical assessment. Annu Rev Neurosci. 2014;37:1–15. doi: 10.1146/annurev-neuro-071013-013950. - DOI - PubMed
    1. Cattaneo L, Sandrini M, Schwarzbach J. State-dependent TMS reveals a hierarchical representation of observed acts in the temporal, parietal, and premotor cortices. Cereb Cortex. 2010;20:2252–2258. doi: 10.1093/cercor/bhp291. - DOI - PubMed

Publication types

LinkOut - more resources