. 2015 Dec 9;35(49):16236-58.
doi: 10.1523/JNEUROSCI.3977-14.2015.

A Unified Dynamic Model for Learning, Replay, and Sharp-Wave/Ripples

Affiliations

A Unified Dynamic Model for Learning, Replay, and Sharp-Wave/Ripples

Sven Jahnke et al. J Neurosci. .

Abstract

Hippocampal activity is fundamental for episodic memory formation and consolidation. During phases of rest and sleep, it exhibits sharp-wave/ripple (SPW/R) complexes, which are short episodes of increased activity with superimposed high-frequency oscillations. Simultaneously, spike sequences reflecting previous behavior, such as traversed trajectories in space, are replayed. Whereas these phenomena are thought to be crucial for the formation and consolidation of episodic memory, their neurophysiological mechanisms are not well understood. Here we present a unified model showing how experience may be stored and thereafter replayed in association with SPW/Rs. We propose that replay and SPW/Rs are tightly interconnected as they mutually generate and support each other. The underlying mechanism is based on the nonlinear dendritic computation attributable to dendritic sodium spikes that have been prominently found in the hippocampal regions CA1 and CA3, where SPW/Rs and replay are also generated. Besides assigning SPW/Rs a crucial role for replay and thus memory processing, the proposed mechanism also explains their characteristic features, such as the oscillation frequency and the overall wave form. The results shed a new light on the dynamical aspects of hippocampal circuit learning.

Significance statement: During phases of rest and sleep, the hippocampus, the "memory center" of the brain, generates intermittent patterns of strongly increased overall activity with high-frequency oscillations, the so-called sharp-wave/ripples. We investigate their role in learning and memory processing. They occur together with replay of activity sequences reflecting previous behavior. Developing a unifying computational model, we propose that both phenomena are tightly linked, by mutually generating and supporting each other. The underlying mechanism depends on nonlinear amplification of synchronous inputs that has been prominently found in the hippocampus. Besides assigning sharp-wave/ripples a crucial role for replay generation and thus memory processing, the proposed mechanism also explains their characteristic features, such as the oscillation frequency and the overall wave form.

Keywords: dendritic spikes; learning; memory; network; replay; sharp-wave/ripples.


Figures

Figure 1.
Figure 1.
Nonlinear dendritic interactions. A, Dendritic current Ids as defined in Equation 8 for standard parameters. B, Somatic depolarization V of a postsynaptic neuron in response to presynaptic stimulation at time t = 0 (blue solid line) that is sufficiently strong such that a dendritic spike current is elicited (i.e., the total stimulation is larger than the dendritic threshold Θb). The black dashed line is the somatic response in the absence of dendritic nonlinearities (linear dendritic input summation).
Figure 2.
Figure 2.
Delay distributions for standard parameters. The green line shows the distribution of the (distance-dependent) axonal delay. The distribution of total conduction delays from excitatory-to-inhibitory and from inhibitory-to-inhibitory neurons is shown in blue (τin,ex = τin,in = τax + τin). Likewise the distribution of the total conduction delays to excitatory neurons is shown in purple (τex,ex = τex,in = τax + τex).
Figure 3.
Figure 3.
Place tuning and phase precession of single cells. A, When the actual position x is within the place field of a neuron, rectangular current pulses are injected to the neuron. Their amplitudes Ipf (solid, left vertical axis; Eq. 16) and temporal offsets (DT) with respect to the background theta rhythm (dashed line, right vertical axis; Eq. 17) are functions of the relative position (rel. pos.) in the place field (compare Eq. 15). B, Examples of the current pulses for a place field, P = [10, 40] cm, and the positions x = {15, 25, 35} cm. The positions in the place field are shown in the top subpanel; the resulting input currents are shown in the bottom subpanel. C, The main panel displays the resulting spatiotemporal receptive field. The inset shows the average firing rate (solid; left vertical axis) and average phase shift against the theta rhythm (dashed; right vertical axis) as a function of the current position. The neuron increases the firing rate for positions within the place field and shows phase precession. D, Bottom, Two example membrane voltage traces during the traversal of a place field of a neuron with the characteristics summarized in C. To indicate the spikes, voltage excursions to Vmax = 0 mV are added to the membrane voltage whenever a spike is generated. Top, The (virtual) theta rhythm; the dots indicate the spiking times of the considered neurons. The place field has a width of Δw = 30 cm, and it is traversed in jumps of Δx = 2 cm per theta cycle (i.e., v = 16 cm/s). For further details, see Materials and Methods.
Figure 4.
Figure 4.
Learning feedforward structures. A, Example trajectory of a modeled run along a linear track of a total length of Ltot = 190 cm with average velocity = 8 cm/s. For simplicity, we assume that the position is fixed for the short period of one theta cycle (T = 125 ms). Between consecutive theta cycles, the position increases randomly in a jump-like manner, here on average by 1 cm (compare zoomed view of the trajectory presented in the inset). Place fields are assigned to Npf = 1500 of Nex = 2500 excitatory neurons, and the centers are distributed homogeneously in the interval [Δw2,LtotΔw2] (indicated by the gray shaded area). B, C, Spiking activity of the excitatory neuron population for the period of one theta cycle at different positions (indicated by the blue and green markers in A). The colored area indicates the fraction of neurons with place fields containing the current position. D, Distribution of synaptic weights as a function of the distance between the place field centers of the postsynaptic and the presynaptic neuron. The solid line indicates the mean weight, and the colored area is the interval containing 80% of the weights (0.1- 0.9 percentile). Different colors show the distribution after different numbers of runs as indicated by the inset. E, Connectivity matrix for connections between the first 400 neurons after 10 runs (D, red curve).
Figure 5.
Figure 5.
Alternative STDP kernel generating stable learning dynamics for large numbers of runs. A, B, Top, STDP time windows (compare Eqs. 9 and 26); bottom, distributions of weights versus the distances of the place-field centers of postsynaptic and presynaptic neurons (compare Fig. 4D). A, A standard STDP window (compare Eqs. 9–11) results in more prominent feedforward substructures for more runs along the linear track. After a large number of runs, replay events are initiated even during the exploration phase and cause pathological activity, which amplifies the connection strengths even more. B, A different STDP window where causal spiking induces depression for larger Δt yields stable learning dynamics (compare Eq. 26, with A = 8, τx = 17 ms and α = 0.18; other parameters as before). As in A, a prominent feedforward structure forms, but the depression for large Δt confines strong connections to neurons with nearby place fields and thus prevents overlearning and pathological activity states.
Figure 6.
Figure 6.
Impact of unreliable spiking phase. A–C, Spatiotemporal receptive fields with different widths (A, Δτ = 20 ms, Imax = 500 pA; B, Δτ = 40 ms, Imax = 340 pA; C, Δτ = 60 ms, Imax = 280 pA). The underlying theta oscillation has a frequency of 8 Hz. D–F, Distribution of synaptic weights as a function of the distance between the place field centers of the postsynaptic and the presynaptic neuron after multiple runs along the linear track with phase precession given by the receptive field above. The running speed is = 8 cm/s, and the place-field width is Δw = 40 cm. Broader distributed, more unreliable phase shifts do not qualitatively change the feedforward structure formation. It only requires more runs, because the actual spiking times have less reliable order and temporal difference.
Figure 7.
Figure 7.
Replay of spike patterns during sharp-wave/ripple-like events induced by synchronous stimulation. A, Average number of consecutive synchronous groups (ripples) versus the number of initially synchronously stimulated neurons g0 (spike times drawn from a Gaussian distribution with σstim = 0.5 ms). Different colors correspond to the different number of runs along the linear track. The inset shows the average fraction pfrac of place cells that spike at least once during the replay events. The data are derived by averaging over n = 10,000 replay events. B, The relative power in the high-frequency band (150–250 Hz) versus the temporal width σstim of the initial synchronous pulse. With increasing σstim, the relative power decreases. For large σstim, a signal can still propagate along the feedforward structure, yet the replay is not clearly structured in consecutive firing synchronous groups (therefore, no ripples occur; compare F). C–F, Examples of network activity (C–E, σstim = 0.5 ms; F, σstim = 5.0 ms): top, firing rate; bottom, spiking activity of the excitatory (black) and the inhibitory (red) neuron population. The size of the initial stimulation and number of runs along the linear track are indicted by the markers (top and A, B). The gray shaded area in bottom panels indicate the subset of neurons that have an active place field on the track. E1, F1, Close-up view of the spike data shown in E and F. For further explanations, see the main text.
Figure 8.
Figure 8.
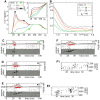
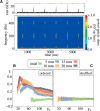
Characteristics of replay events. A, Bottom, Spectrogram of the spiking rate dynamics of the excitatory neuron population displayed in Figure 7E. Top, Corresponding network rate. There are clear maxima at a frequency of about 200 Hz during replay events. Furthermore, there are peaks at the higher harmonics and at low frequencies reflecting the overall increase of activity. B, Average matching index I (solid lines) versus the number of initially synchronously spiking neurons g0 after different numbers of runs along a linear track (same data and color code as in Fig. 7A). Only runs where at least two ripples are initiated are considered for the analysis; therefore, the curves are truncated at the left side. The shaded areas indicate the value range containing 50% of the values (0.25–0.75 quantiles). With the increasing number of ripples (compare Fig. 7A), the quality of the ordering within replay events increases. C, As a control experiment, we shuffled the neuron indices and calculated the matching index: it fluctuates around zero, highlighting that the sequence is randomly ordered.
Figure 9.
Figure 9.
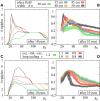
Impact of place-field width and strength of inhibitory feedback loop on replay events. The number of ripples (A, C) and the matching index (B, D) versus the number of g0 of initially synchronous neurons after a fixed number of runs (averaged over n = 10,000 replay events) are shown. In A and B, different colors indicate different place-field widths Δw, and in C and D, different colors correspond to different scaling γ of the inhibitory feedback loop (compare Eq. 28) as indicated above the panels. Increasing Δw yields a faster learning of feedforward structure, and thus a faster increase of the ordering of replay events. The inhibitory feedback controls the number of ripples per replay event: with decreasing γ, more and more ripples (i.e., longer events) emerge. However, the longer replay events do not lead to more ordered sequences as the synchronous signal tends to spread out over larger parts of the recurrent network. For more detailed discussion, see the main text.
Figure 10.
Figure 10.
Replay events elicited by unspecific (random) stimulation. After an initial exploration phase (15 runs, Δw = 50 cm, remaining parameters as before), a random subset of g0 = 50 excitatory neurons (Nex = 2500) is stimulated to spike synchronously. We consider all events with at least five ripples, i.e., five consecutive synchronous groups (3273 of 10,000 events). For each of these events, we draw S = 200 neurons out of the Npf = 1500 place-encoding neurons and calculate the matching index I for the spiking activity of these neurons only (to gain better statistics, we repeated the drawing 100 times for each event and evaluated the computed I independently). A, The resulting distribution of matching indices (orange) is shifted to positive values compared with the control setting where the neuron indices are shuffled before calculation of the matching indices (black): the spikes of the neurons within the events are ordered according to the order of their place-field centers along the linear track. B–D, Examples of spiking dynamics of subsets of S = 200 neurons (main panels) and the population activity (top; black, excitatory neurons; red, inhibitory neurons) for different matching indices I as indicated in the top panels.
Figure 11.
Figure 11.
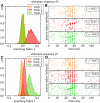
Recall of multiple sequences. Before recall, the network is trained in an exploration phase on ntr = 3 different linear tracks (Δw = 40 cm, 30 runs in total; remaining parameters as before), which are traversed one after another. The set of neurons (Npf = 1500 neurons per track) that encode places on each track are drawn randomly. In the recall phase, g0 = 40 neurons with neighboring place fields are stimulated synchronously (compare Fig. 7). A, C, Distribution of matching indices (n = 10,000 events) with respect to the order of place-field centers of different tracks (color code). The set of initially stimulated neurons is taken from place-encoding neurons of track 2 (A) or track 3 (C), respectively. B, D, Example rasterplots of all place-encoding neurons of different tracks (same color code as in A and C; IID refers to the matching index for the track ID). The neurons are ordered according to the ordering of place-field centers. We note that the neurons encode positions on multiple tracks. By chance, the order of firings can agree or disagree on two tracks for a larger majority of neuron pairs. Such an “overlap” leads to distributions of matching indices for the nonstimulated tracks that are clearly shifted from zero, as in (C).
Figure 12.
Figure 12.
Impact of learning during rest/sleep with SPW/R-like replay events. The feedforward substructure is first learned in an exploration phase (for 5, 10, and 15 runs along the tracks in A–C, respectively; the network is the same as in Fig. 10). The networks continue to learn in the subsequent simulated rest/sleep phase, where SPW/R-like events are initiated by stimulating a random subset of g0 = 50 excitatory neurons every 400 ms. Different colors show the mean connection strength as a function of the distance between the place-field centers of the postsynaptic and the presynaptic neuron after 0, 500, 1000, and 4000 events. The feedforward structure is attenuated.

Comment in

Similar articles

Cited by

References

    1. Abeles M. Local cortical circuits: an electrophysiological study. Berlin: Springer; 1982.
    1. Abeles M. Corticonics: neural circuits of the cerebral cortex. Cambridge, UK: Cambridge UP; 1991.
    1. Aihara T, Abiru Y, Yamazaki Y, Watanabe H, Fukushima Y, Tsukada M. The relation between spike-timing dependent plasticity and Ca2+ dynamics in the hippocampal CA1 network. Neuroscience. 2007;145:80–87. doi: 10.1016/j.neuroscience.2006.11.025. - DOI - PubMed
    1. Amaral D, Ishizuka N, Claiborne B. Neurons, numbers and the hippocampal network. Prog Brain Res. 1990;83:1–11. doi: 10.1016/S0079-6123(08)61237-6. - DOI - PubMed
    1. Andersen P, Soleng AF, Raastad M. The hippocampal lamellar hypothesis revisited. Brain Res. 2000;886:165–171. doi: 10.1016/S0006-8993(00)02991-7. - DOI - PubMed

Publication types